the Creative Commons Attribution 4.0 License.
the Creative Commons Attribution 4.0 License.
When nature meets the divine: effect of prohibition regimes on the structure and tree species composition of sacred forests in northern Greece
Valentino Marini Govigli
John R. Healey
Jennifer L. G. Wong
Kalliopi Stara
Rigas Tsiakiris
John M. Halley
Sacred forests are an integral component of the mountainous cultural landscape of northern Greece, hypothesized to be the result of both ecological processes and site-specific forest management regimes through strict religious prohibition. These practices acted as constraints on natural forest development by suppressing understory growth, while prohibition of woodcutting has preserved large trees. The aim of this study was to investigate the relative effects of physical site environment and management regimes on the structure and composition of woody plant groups in six such forests. Species rank–abundance curves, dissimilarity indices and cluster analyses were used to assess variation within and amongst the woody plant groups of the sites. Species abundance was found to be highly variable amongst the sites, with notable variation between canopy and understory layers indicating dynamic change in floristics and structure. Cluster analysis revealed four main woody plant groups statistically associated with environmental variables (aspect) and forest management (different forest prohibition regimes, and presence or absence of infrastructure). Our results indicate that tree composition is significantly associated with different prohibition regimes linked to the forests' sacred status, as well as the inherent environmental variation amongst sites. Exploring further the role of traditional management systems in shaping sacred forest structure is a relevant research path for designing effective conservation practices tailored to sacred natural sites facing cultural abandonment.
- Article
(2683 KB) - Full-text XML
- BibTeX
- EndNote
Sacred forests are amongst the best-known types of sacred natural sites1 (SNSs) and are not restricted to any particular religion or belief system. Bhagwat and Rutte (2006), in their extensive review, reported 33 examples of SNS occurring in 10 different biomes across all continents except Antarctica. In Europe, sacred forests exist in several forms, both as vestiges of ancient spiritual traditions that have been absorbed into the local practices of modern religions and as components of church-owned landscapes (Mallarach, 2012).
For sacred forests, it is generally the local community that acts as the custodian of a site, managing and conserving its cultural, spiritual, and environmental value (Wild and McLeod, 2008). Here, religious observance, nature conservation, and productive management practices are often combined. The custodial groups (which include local religious authorities) define specific management regimes, including duties and prohibitions on forest use. Such regimes vary from site to site and reflect the communities' objectives and the way they wish to manage local resources, their environment, and their spiritual values (e.g., strict protection, prohibition of felling trees, control of grazing; Stara et al., 2016; Frosch et al., 2016).
Environment, ecology, governing rules, and socioeconomic settings are all relevant and contribute to sacred forests' inter- and intra-site diversity. Despite this diversity, these forests often share common features. Bhagwat and Rutte (2006) showed that SNSs are often situated close to agricultural landscapes and community settlements. Jäckle et al. (2013) found that sacred forests in northern Morocco are mainly located in elevated and prominent areas. Sacred forests have also been observed to have higher biodiversity levels than neighboring habitats (Wild and McLeod, 2008; Dudley et al., 2009, Gao et al., 2013; Avtzis et al., 2018). However, this is not always the case for small sacred forests (Garcia et al., 2006) when the condition of the surrounding landscape matrix becomes crucial for the biodiversity of each forest (Daye and Healey, 2015).
In this study, we investigate the interaction of environment and management regimes on the structure and tree species composition of sacred forests, using data collected from six sites, in the north of the Epirus region in NW Greece. Sacred forests have existed in the area since the Ottoman period (1479–1912) and take the form of small forest patches embedded in active agricultural landscapes (Stara et al., 2016). A modern sensibility recognizes that these forests provided several regulatory ecosystem services to their neighboring communities, such as protective wooded buffers above villages, reserves of essential natural resources in times of dire need, grazing areas, and spaces for religious observance and spiritual retreat. Moreover, this variety of services reflects the diverse ritual praxes used to establish the forests (dedication to individual saints and threat of excommunication for rule breaking), which led to a variety of forest prohibition regimes2, from strict protection to controlled management.
As large numbers of people moved away from traditional dwellings and livelihoods in the 20th century, these practices fell into disuse. Rural abandonment, particularly severe after 1950, resulted in Epirus becoming one of the most sparsely populated regions of Europe. Such abandonment had an impact on the whole landscape, with fields and pastureland left derelict, allowing widespread forest expansion (Papanastasis, 2007; Tsiakiris et al., 2009; Blondel et al., 2010). As a result, the social function of sacred forests and associated prohibition regimes are now fading with concomitant ecological changes to forest structure and composition.
The main goal of this study is to determine whether there are dissimilar types of woody plant communities that reflect different prohibition regimes in sacred mountain forests. To this end we (i) perform the first detailed forest inventory of a sample of sacred forests in NW Greece, (ii) assess differences in species composition between understory and canopy vegetation, and (iii) classify woody vegetation into types using floristics and structural characters to examine how far these are differentiated by environmentally driven gradients and forest prohibition regimes. Our results allowed us to both identify variation in tree species composition across different forests and structural stages and link them to environmental and social variables related to local prohibition regimes. This information will be valuable for the conservation of individual sacred forests, as a substantial addition to the available broad site-level vegetation descriptions (e.g., Korakis et al., 2014). Finally, we offer our work up as confirmation that past and present forest management regimes are susceptible to analysis, providing relevant insights and basis for further research for the protection and future management of SNSs.
2.1 Study areas
The study area is in the north of the Epirus region (northwestern Greece), specifically within the local administrative units of Zagori and Konitsa. This is a mountainous area of scattered small villages that has suffered from rural abandonment during several depopulation periods and is presently one of the most sparsely populated areas of Greece. The area hosts a rich flora and fauna including several endemic and endangered species (Amanatidou, 2005), and most of the region is included in the NATURA 2000 network of protected areas, while part of it is protected as national forest (EEA, 2016) and was designed as a national park in 2005 (Northern Pindos National Park, 2017). The area is characterized by a Mediterranean climate of hot summers dominated by dry continental air masses and wet mild winters (Northern Pindos National Park, 2017). Rainfall in the area is intense, especially in the autumn, with about 1195 mm of rainfall per year (Papigo weather station, 2017). There are two to three dry summer months each year (usually July and August). Temperatures in the area correspond to continental zones, with a high amplitude between the mean maximum (about 30.8 ∘C, in August) and the mean minimum (about 3.6 ∘C in January; Papigo weather station, year 2019).
A total of 16 sacred forests encompassing a variety of existing ecosystems have recently been researched in detail (Stara et al., 2016; Avtzis et al., 2018). Six of these were selected for the present study to cover a range of environmental conditions (altitude and aspect) and forest prohibition regimes. They are (i) Agios Nikolaos in Livadakia, belonging to the village of Vitsa; (ii) Kouri, village of Mazi; (iii) Mereao, village of Palioseli; (iv) Agia Paraskevi, village of Vovoussa; (v) Toufa, village of Greveniti; and (vi) Graditsa, village of Kapesovo (Fig. 1). Table 1 presents a summary of the historical, social, and ecological features of the selected sites.
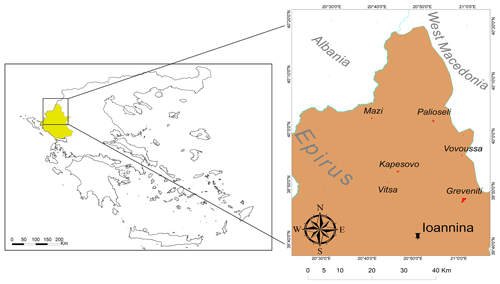
Figure 1Location of the Epirus region in northwestern Greece and (inset) location of the six studied sacred forests and the capital of Epirus (Ioannina). © Adapted from the GADM database.
Table 1Cultural characteristics, environmental characteristics, and sampling details of the six studied sacred forests.

a Classification follows Stara et al. (2016).
b Altitude values have been recomputed from field data for the present study
from the values reported by Stara et al. (2016).
c In Palioseli the maximum possible number of sample
plots was restricted to 19.
2.2 Data collection
During the summers of 2014 and 2015, a tree inventory was undertaken in each site. A systematic sampling design was applied by fitting a square grid orientated to the cardinal directions over the site. In the absence of pre-existing maps of the extent of the sacred forests, notional boundaries of each site were defined by Tsiakiris et al. (2013) as the former forest extent on ortho-rectified aerial photographs taken in 1945.
The required grid spacing (S) was estimated using Eq. (1) (Wong et al., 2007):
Here n (the number of grid intersections, i.e., the plot locations) was set at 30, and the forest area in hectares (Af) included a 50 m buffer outside the forest boundary derived from the aerial photographs (Ab). Plots lying partially outside the external boundary were not included in the sample. In total, 161 plots were recorded across the six sites. Each grid intersection defined the southwestern corner of three nested plots of differing sizes:
-
a 15 m×15 m plot, where all trees with a diameter at breast height (d1)≥5 cm were identified and their d1 measured;
-
a 5 m×5 m understory subplot, where all saplings and/or shrubs (saplings: diameter at ground layer d0≥1 cm and d1<5 cm; shrubs: all other woody plants – e.g., showing no leading stem, width greater than height, leaves at ground layer) were identified and their d0 measured;
-
a 1 m×1 m sub-subplot, where all seedlings of woody species (individuals with d0<1 cm) were identified.
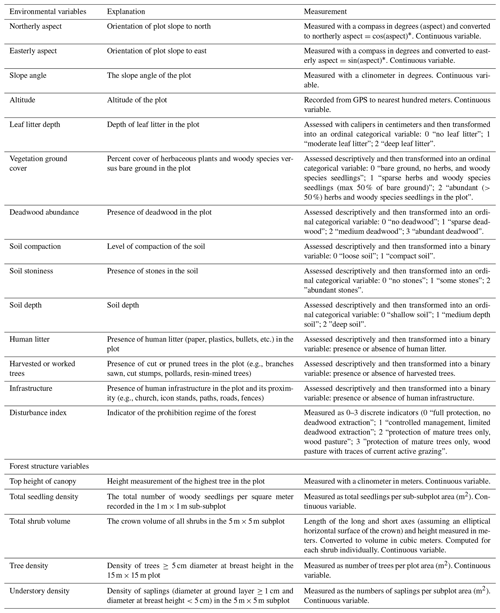
Herbaceous species were excluded from the data collection. Additional variables were recorded for each plot (Appendix A), including
-
geographical variables (aspect, slope angle, and altitude);
-
ground cover and soil properties (leaf litter depth, percentage of vegetation ground cover, deadwood abundance, soil compaction, depth, and stoniness);
-
forest management indicators such as presence of human litter, (e.g., gun cartridges) presence of human infrastructure (e.g., buildings, icon stands, paths, roads) in the plot or in its close proximity, presence of cut or pruned trees, indicators of forest prohibition regimes including former and active grazing (e.g., recent browsing damage, animal footprints, presence of grazing animals, historical information on the forest management status);
-
forest structure (top height of canopy, total woody species seedling density, total shrub volume, density of trees and understory woody plants).
2.3 Data analysis
To investigate the tree diversity of each site, we constructed species rank abundance distributions (RADs) for both canopy (15 m×15 m plots) and understory (5 m×5 m subplots) layers. In this analysis, we used only the tree species found in the canopy. Thus all shrub and herbaceous species were excluded. Additionally, the deciduous oaks (Quercus cerris, Q. frainetto, Q. petraea, Q. pubescens) were lumped at the genus level (Quercus spp.) for the subplot data. This was done because of the difficulty of identifying individuals in the sapling and shrub size classes to the species level within this group. Plot-level data of deciduous oaks were also pooled at the genus level as this analysis aimed to compare understory and canopy data.
RAD curves provide valuable information about species evenness (the steepness of the curve) and richness (the number of species sampled) (Magurran, 2004). The frequency of sampled tree species was used to examine variation in woody species composition between canopy and understory layers of the sample sites via a Wilcoxon signed-rank test. This test allowed us to assess whether their population mean ranks differed.
The purpose of this analysis was to categorize the woody vegetation of the six sacred forests according to their vegetation composition and structure and then assess the respective influence of physical, environmental, and forest management variables. To do so, we followed a four-stage methodology. Firstly, we computed the Bray–Curtis measure of dissimilarity to assess tree composition difference amongst plots across sites using Bray–Curtis-based nonmetric multidimensional scaling (NMDS). Secondly, we created clusters based on closeness within the relative distance matrix, at both canopy and understory layers. Thirdly, we merged the two sets of clusters in a final configuration of four canopy–understory groups which were represented across sites. Lastly, we ran a regression model on the woody plant groups with environmental and forest management variables, to explore any significant relationships.
Tree basal area as a measure of dominance per species (B), rather than presence–absence or density, was used to assess dissimilarity in woody composition in the canopy layer. Equation (2) gives the standard basal area index used, expressed in square meters:
where Ts is the total number of trees per species s, and d1(j) is the diameter of tree j at breast height. The analysis of saplings and shrubs in the 5 m×5 m subplots was undertaken with presence–absence data, due to the more homogeneous size distribution of individuals between d0≥1 cm and d1<5 cm. The plots that had no tree or shrub cover in the sampled size classes at either plot or subplot layers (18 overall) were removed from the analysis of woody species composition.
The resulting distance matrix was then repeatedly clustered (iteratively from 2 to 10 clusters) using a “k-means” clustering protocol with 25 random starts (Aerts et al., 2006; Dufrene and Legendre, 1997). A measure of cluster homogeneity (silhouette) was used to identify the most explanatory cluster level. A configuration of five clusters was selected as a meaningful partition of the sample at the canopy–plot layer. Four clusters were selected for the understory–subplot layer. Indicator species analysis was applied to determine which group of tree species best characterized each of the selected clusters. The indicator species analysis was run following the prescriptions of Dufrene and Legendre (1997) with 1000 permutations. Similarly, only those indicator species that emerged as significant (p<0.05) and with an indicator value >25 % were considered (De Cáceres et al., 2012).
In order to investigate the association of environmental gradients with variation between the plot–subplot clusters, nonmetric multidimensional scaling (NMDS) was run on the clusters based on plot basal area measurements (and presence–absence data for the subplots)3. NMDS was performed with three dimensions, a Bray–Curtis measure of distance, and a maximum number of 500 iterations. The relationship between the resulting NMDS axes and each environmental characteristic recorded at plot level was tested with multiple linear mixed models. Each model included a fixed effect of site, controlling for the nested design of the sampling strategy (i.e., a series of plots sampled across six sites). Additional analyses were run to test the multiple regression assumptions for all models (linearity, homoscedasticity, independence, and normality). Due to the spatial nature of the study dataset (systematic grids within six study sites), Moran's autocorrelation coefficient was used to quantify whether NMDS outcomes were affected by the presence of spatial autocorrelation (Paradis, 2019). The test was performed on the three NMDS axes, using as distance weight matrix the plots' coordinates (Greek grid). The results of the test showed a significant positive autocorrelation across observations for all resulting NMDS axes at both plot and subplot levels. The spatial correlation trend existing in the data was inspected using variogram plots. This assessment identified a linear correlation structure as the best model for the spatial correlation of the data. This variogram model was then fitted to all regression models (except one model at the subplot level, which was better fitted using an exponential spatial correlation structure) in order to filter out the effect of the spatial correlation on the analyses. Explanatory variables were tested for multi-collinearity, using a generalized variance inflation factor (GVIF; Fox and Monette, 1992). Variables showing a GVIF greater than 2 were removed. Subsequently, a backward stepwise regression analysis based on the model Akaike information criterion (AIC) was used to select the most parsimonious model (Akaike, 1974). In order to achieve normality of residuals, Box–Cox transformations were applied as required. Only in one case (the first NMDS axis of the subplot cluster analysis) did the regression assumptions' test fail, due to a nonlinear distribution of model residuals. A simple measure of correlation (Kendall rank correlation coefficient) between environmental variables and the corresponding NMDS axis was used in that case.
Kruskal–Wallis nonparametric tests of differences were performed to examine whether environmental variables were distributed differently across clusters at plot and subplot levels (Appendices C and D). This analysis helped to understand how to cross-reference plot and subplot data into new groups in order to assess the pattern across the size classes of woody plants simultaneously. Post hoc comparisons were run to confirm whether differences occurred between groups, at mean and median levels of environmental and forest structure variables. Because of ties in data (observations having the same value), the Nemenyi test with chi-squared approximation was used (Pohlert, 2014). The relationship between the four groups emerging from the combination of canopy–plot and understory–subplot and correlated environmental variables and forest management indicators was explored using an ordered logit regression and quantified using relative odds ratios. The logit model was fitted using a mixed-effect ordinal logistic regression to account for the nested design of the sampling. Latitudinal data of the plots were employed as additional covariates to accommodate spatial correlation of data (Hu and Lo, 2007). This final analysis assumes that the dependent variable (the four woody plant groups) behaves as an ordered attribute, according to varying probabilities associated with a pool of independent variables. The results of this regression model categorize the different woody plant groups according to variation in environmental and prohibition regimes. Statistical analyses were performed using the R computing environment (R Core Team, 2017).
3.1 Woody plant communities in the sacred forests and intra-site floristic diversity
The inventory recorded 51 woody species across the six sites, of which 63 % were present both as canopy trees (in the plot layer) and as understory saplings or shrubs (in the subplot layer) and 20 % appeared only in the understory, 9 % only in the canopy, and 8 % only as seedlings (sub-subplot layer). A total of 18 plots had no tree canopy or understory and only contained herbaceous plants. The tree canopy of each site is dominated by a handful of species, though with some parallels between sites. The canopies in Vitsa, Mazi, and Kapesovo are characterized by deciduous oaks (Quercus frainetto, Q. cerris, and Q. pubescens and only in Mazi also including the semi-deciduous Q. trojana), Greveniti is dominated by beech (Fagus sylvatica), and Vovoussa and Palioseli are dominated by black pine (Pinus nigra).
The composition of saplings and shrubs in the understory is more variable. In Vitsa, Mazi, and Kapesovo a shrubby and sclerophyllous evergreen understory (dominated by Quercus coccifera and Juniperus oxycedrus) is present in combination with deciduous oak and oriental hornbeam (Carpinus orientalis) saplings in Mazi and Kapesovo, together with saplings of mock privet (Phillyrea latifolia) in Mazi and saplings of Montpellier maple (Acer monspessulanum) in Kapesovo. Palioseli and Vovoussa are characterized by an understory comprising saplings of hop-hornbeam (Ostrya carpinifolia), hornbeam (Carpinus betulus), and black pine (P. nigra). In Greveniti the understory is mainly dominated by saplings of beech (F. sylvatica).
Species rank–abundance curves for the most abundant tree species in each of the six sites confirmed that overall, the composition and community structure of the woody plants in the understory broadly match those of trees in the canopy (Fig. 2). Wilcoxon signed-rank tests revealed no significant statistical differences between understory and canopy compositions. However, there are a few differences worth noting. In Greveniti three species (Acer opalus, P. nigra, Fraxinus angustifolia) and deciduous Quercus spp. present in the canopy were totally missing from the understory. In two sites, some tree species occur at a smaller relative abundance in the understory compared with the canopy layer: C. orientalis in Vitsa and deciduous Quercus spp. and semideciduous Q. trojana in Mazi. In the other three sites, several species were more abundant in the understory layer than in the canopy: mainly C. orientalis, Cornus mas, Juniperus oxycedrus, J. communis, and Prunus avium in Vovoussa, mainly Fraxinus ornus and C. mas in Mazi, and mainly J. oxycedrus in Palioseli.
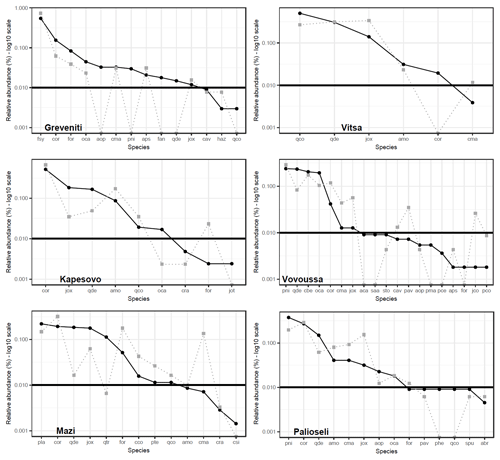
Figure 2Tree species rank–abundance curves in the six sacred forests. Black curves indicate the relative abundance of the most common species in the canopy layer (main plots). Gray dotted curves indicate the relative abundance of saplings in the understory layer (subplots) matching the tree species found in the canopy. The horizontal straight line sets the abundance threshold of 1 %. Full species names are given in Appendix I. Deciduous Quercus spp. (Quercus cerris, Q. frainetto, Q. petraea, and Q. pubescens) are lumped into a single taxon.
3.2 Inter-site variation and effects of environmental and management variables
The NMDS ordination of tree species recorded in the plot layer showed three dimensions that produced the greatest reduction in average stress (Aerts et al., 2006). These dimensions were then examined in relation to the three ordination axes to interpret the characteristics of the five clusters identified in the plot layer. The first ordination axis partitions north-facing plots (coefficient −0.24; ; p<0.001) with greater slope angles (coefficient −0.01; ; p=0.019) from the others. It also identifies plots associated with the presence of human infrastructure (coefficient 0.18; t=2.10; p=0.038) and higher levels of disturbance associated with forest prohibition regimes (increased wood removal and grazing) (coefficient 0.28; t=2.23; p=0.028). Examination of the species in these plots shows that this first axis partitions cluster 1 dominated by black pine in the canopy and cluster 4 with beech canopy from the other clusters (2, 5) which have canopies of other species (Fig. 3; further details in Appendices C and E). The second axis partitions clusters 4 and 5 from the rest and corresponds to forests with limited presence of cut or pruned trees (coefficient −0.15; ; p<0.050). The third axis partitions plots with less compact soil (coefficient −0.13; ; p=0.054) and separates cluster 3 from the rest.
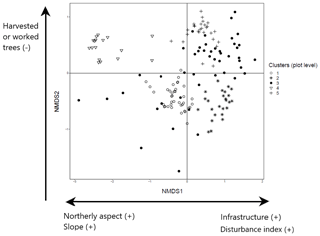
Figure 3NMDS ordination (axes 1 and 2) of 154 plots across six sacred forests for canopy trees. Plots are labeled according to the five clusters produced by the cluster analysis (1: pine (Pinus nigra); 2: mixed oaks (dominated by Quercus coccifera and Q. frainetto); 3: sclerophyllous species (Acer monspessulanum, Q. coccifera, and Juniperus oxycedrus); 4: beech (Fagus sylvatica); 5: mixed broadleaves (Q. pubescens and Carpinus orientalis). Arrows indicate the main forest prohibition regimes and environmental variables statistically related to the axis coordinates. An increase in the “disturbance index” points to forest prohibition regimes that allow higher levels of disturbance (increased wood removal and grazing).
For saplings and shrubs recorded in the subplot layer, the NMDS analysis also shows three dimensions and yields four clusters. Ordination of the first two NMDS axes shows that the first axis separates cluster 1 (dominated by beech) and cluster 4 (mixed broadleaves of C. betulus and O. carpinifolia) from clusters 2 and 3 (Appendices D and E). Cluster 1 is strongly and cluster 4 more weakly negatively associated with stronger forest prohibition regimes that limit disturbance (less wood removal and grazing) (Kendall rank correlation coefficient 0.44; p<0.001), whereas they are positively associated with greater slope angle (−0.32; p<0.001) and altitude (−0.22; p<0.001) amongst other variables. Additionally, the first axis is positively correlated with low leaf litter depth (0.22; p= 0.001), limited deadwood abundance (0.32; p<0.001), and shallow and compacted soil (0.29; p<0.001, and 0.37; p<0.001). Axis 3, on the other hand, shows a positive and significant association with forest prohibition regimes with higher levels of disturbance (increased wood removal and grazing) (coefficient 0.05; t=2.57; p=0.011), while it shows a negative association with leaf litter depth (−0.07; ; p=0.014) (Fig. 4) and separates cluster 2 (dominated by C. orientalis and A. monspessulanum) from cluster 3.
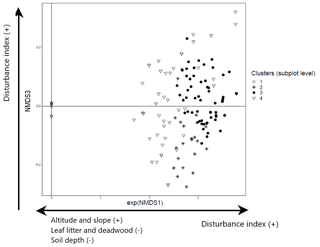
Figure 4NMDS ordination (axes 1 and 3) of 147 subplots across six sacred forests for understory saplings and shrubs. Subplots are labeled according to the four clusters produced by the cluster analysis (1: Fagus sylvatica; 2: Carpinus orientalis/Acer monspessulanum; 3: no significant species; 4: Carpinus betulus/Ostrya carpinifolia). The first axis of the NMDS ordination was transformed as exp(NMDS) to improve readability. Arrows indicate the main forest prohibition regimes and environmental variables statistically related to the axis coordinates. An increase in the “disturbance index” points to forest prohibition regimes allowing higher levels of disturbance (increased wood removal and grazing).
Significant differences were found for both trees (plot layer) and saplings/shrubs (subplot layers) when comparing environmental variables amongst clusters. These differences are mostly significant between (i) clusters 1 and 4 and (ii) clusters 2, 3, and 5 for trees (Appendix F) and between (i) clusters 1 and 4 and (ii) clusters 2 and 3 for saplings/shrubs (Appendix G). The results of the two cluster analyses were merged into a final reconfiguration of four woody plant groups, to reflect the pattern across the size classes of woody plants simultaneously (Appendix H).
The four woody plant groups are as follows.
-
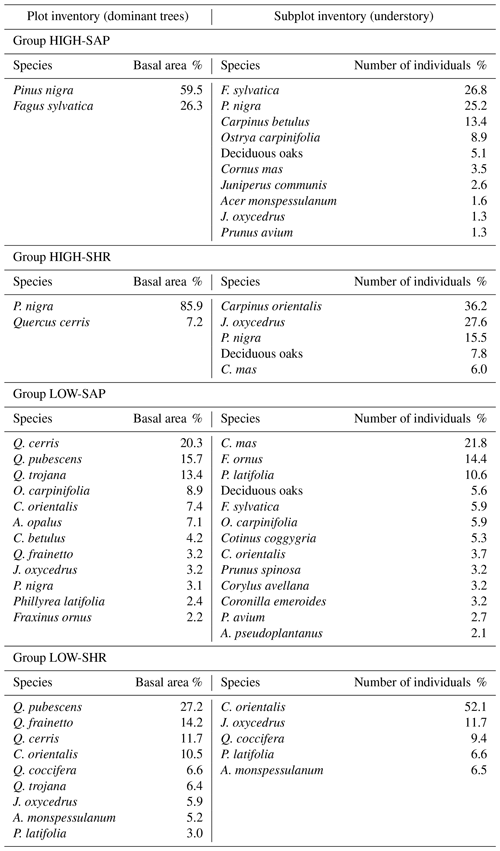
The first group is high-canopy forest (average canopy top height 31.6±1.7 m) with an understory dominated by saplings of single or mixed tree species (HIGH-SAP). This group is dominated by F. sylvatica or P. nigra – Q. cerris. The dense canopy layer shades the understory dominated by either pole-sized trees of F. sylvatica or saplings of P. nigra, C. betulus, and O. carpinifolia, with only a low abundance of shrubs. These forests are characterized by soil with a deep leaf litter layer and a high abundance of deadwood.
-
The second group is high-canopy forest (average canopy top height 24.6±1.8 m) with an understory dominated by short and often shrubby saplings (HIGH-SHR). This group is dominated by P. nigra, and it is largely similar to group 1 with the main difference being the denser shrubby nature of its understory, dominated by species such as C. orientalis and J. oxycedrus.
-
The third group is low-canopy forest (average canopy top height 15.1±1.8 m) with an understory dominated by saplings of mixed tree species (LOW-SAP). This group is characterized by oak and mixed broadleaf forest communities (including Q. cerris, Q. pubescens, and Q. trojana). These forests have smaller tree diameters and lower tree densities than groups 1 and 2. The understory is dominated by tree saplings, most commonly of Cornus mas, Fraxinus ornus, and P. latifolia. The soil is characteristically much more compact and shallower and with a thinner litter layer than in groups 1 and 2.
-
The fourth group is low-canopy forest (average canopy top height 9.8±0.6 m) with an understory dominated by shrubs (LOW-SHR). It has a canopy characterized by small-stature oaks (Q. pubescens, Q. cerris, Q. frainetto), interspersed with patches dominated by dense shrubs. Sclerophyllous vegetation is abundant with the main species being C. orientalis, Q. coccifera, and J. oxycedrus. This group has lower abundance of deadwood and a soil with a shallow leaf litter layer compared with the other groups.
The four identified woody plant groups can be assigned to existing classifications of habitat and vegetation types in Europe. According to the EUNIS forest habitat classification (Schaminée and Hennekens, 2013), the HIGH-SAP group includes both G1.6 (Fagus woodland) and G3.5 (Pinus nigra woodland) habitat types, HIGH-SHR includes G3.5 (Pinus nigra woodland), LOW-SAP relates to G1.7 (Thermophilous deciduous woodland), and LOW-SHR relates to both G.1.7 and G2.1 (Mediterranean evergreen (Quercus) woodland). More precisely, LOW-SAP and LOW-SHR can be respectively assigned to the associations Phillyreo latifoliae–Carpinetum orientalis and Verbasco glabrati–Quercetum frainetto as identified in Bergmeier and Dimopoulos (2008); HIGH-SHR can be assigned to the vegetation type Pyrolo chloranthae–Pinetum nigrae (Bergmeier, 2002).
When compared at mean and median levels, the four identified woody plant groups constitute ordered categories of sampled environmental and stand variables (Fig. 5, Appendix I). The low canopy–shrub forest group (LOW-SHR) exhibits the highest disturbance index (i.e., increased deadwood removal and grazing) and the highest shrub volume in the understory. In contrast, the high canopy–sapling forest group (HIGH-SAP) has the highest average canopy height and the steepest slope. The other groups show intermediate values. This statistically significant ordination across the four groups is also supported by the results of the ordered logit regression (Table 2) with the odds ratio showing that, holding all other variables constant, the odds of a plot being a high canopy–sapling forest, rather than a low canopy–shrub forest are
-
increased 305 % by an increase in orientation of the aspect of the plot to the north;
-
decreased 90 % with a shift to a forest prohibition regime with higher levels of disturbance (increased wood removal and grazing);
-
decreased 68 % by the presence of human infrastructure.
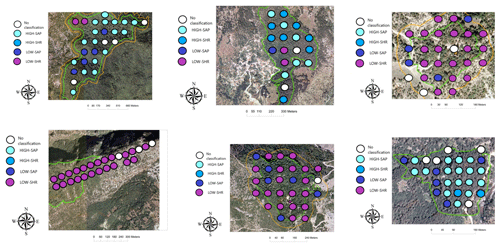
The distribution of the four woody groups across the six forests reveals that the spatial distribution of plots classified into each of the final groups does not map to individual sites but is rather spread across sites, with HIGH-SAP being the most abundant group in Greveniti and Vovoussa and LOW-SHR the most abundant group in Vitsa, Mazi, and Vovoussa (Appendix H).
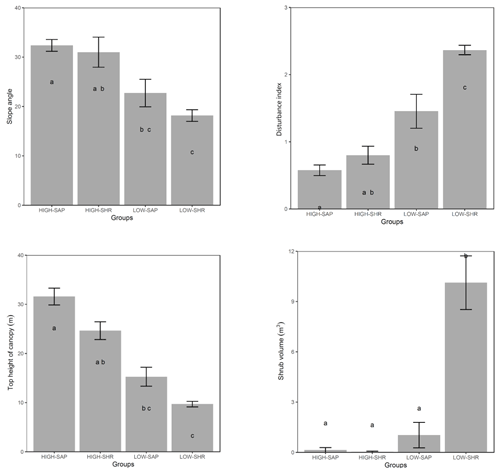
Figure 5Selected forest stand and environmental variables averaged for the five habitat clusters. Letters indicate groups that do not significantly differ (Kruskal–Wallis nonparametric test, p value <0.05). Error bars are ± SE.
Table 2Ordered logit model showing the relationship between selected environmental variables and the final reconfiguration of four woody plant groups across six sacred forests (HIGH-SAP, HIGH-SHR, LOW-SAP, LOW-SHR). The numbers in parentheses represent the different levels of the ordinal categorical variables.
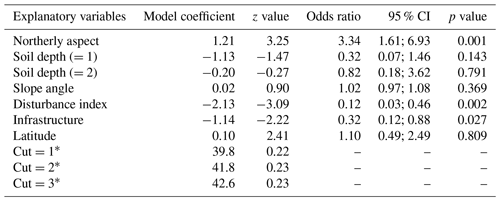
a Cut points representing the three different levels of the ordered logit model.
4.1 Vegetation variability in sacred forests
The first objective of this study was to distinguish groups of woody plants occurring within sacred forests in northern Greece, based on their tree species composition and structural characteristics. Ours is the first study that attempts to use objective (plot-data-based) vegetation analysis to examine the species composition and structural characteristics of sacred forests in Greece as previous studies focused on the overall biodiversity (flora and fauna) value of such forests compared with non-sacred forests (Avtzis et al., 2018), or on their history, ethnography, and folklore (e.g., Stara et al., 2016).
Our results show that the vegetation of the sampled sacred forests differed greatly amongst the sites. This finding is not itself surprising as the sites cover a wide range of environmental conditions such as altitude, geology, and aspect, which are known to influence species composition. We examined both the canopy and understory composition separately and together to further understand the forests' structure and dynamics. The species rank analysis revealed that the canopies are dominated by distinct tree species, which are also similar in abundance in the understory of all six sites. We took this as an indication that the forests are not undergoing a trajectory of change in the composition of their dominant species.
Nevertheless, there were some notable site-specific exceptions, with species in the canopy underrepresented or missing from the understory. Lack of regeneration of the dominant canopy species has been observed as a common feature of sacred forests that are heavily disturbed by human activities, such as firewood collection, timber extraction, and grazing (Mishra et al., 2004; Upadhaya et al., 2008). However, historical evidence shows that sacred forests in Greece have been subject to cultural abandonment since ca. 1950, linked to prevailing patterns of rural depopulation (Blondel et al., 2010; Stara et al., 2015). Where minor discrepancies occurred between canopy and understory species composition (e.g., in Vitsa, Mazi, and Greveniti sacred forests, Fig. 2), we link this to both anthropogenic and environmental factors, possibly indicating (i) former anthropogenic disturbance events, which affected seed dispersal, plant establishment, and growth at a given moment in time and (ii) expansion of the forests into the surrounding matrix of former farmland, after it became subject to less active management. Field evidence and historical reconstructions corroborate these processes. In Mazi the discrepancy between species abundance in canopy and understory layers can be linked to past disturbance events; specifically the lack of medium-sized oaks has been linked to former grazing practices, which reduced the abundance of the most palatable species, e.g., via browsing and cutting small trees to provide fodder (Tsiakiris et al., 2020). In Greveniti, the lack of several canopy species from the understory (e.g., beech saplings coupled with adult oaks and black pines) seems to indicate that the beech forest has expanded into adjacent areas, which had a different vegetation layer. This has been verified by interviews with local informants and in situ observations.
4.2 Management regimes influence the structural and species composition of sacred forests
The final configuration of plot and subplot clusters into four woody groups indicates a series of variables significantly associated with tree species composition and structure in the sampled sacred forests: northerly aspect, forest prohibition regimes, and presence or absence of human infrastructure. We can thus infer two main types of variation associated with tree species composition and structure of sacred forests in northwestern Greece: (i) variation in site environment (especially aspect) and (ii) variation in management and prohibition regimes. Previous studies have identified how site aspect can influence water availability in Mediterranean forests and that north-facing slopes tend to support taller-stature and denser woody plant communities than south-facing slopes (Kutiel, 1992; Sternberg and Shoshany, 2001). This is reflected in the difference we found in tree height across the four forest communities, which is likely to be linked to the observed variation in floristic diversity (as in Zilliox and Gosselin, 2014). However, we also found evidence of independent variation linked to differences in the past management regimes amongst the sites associated with their sacred status (forest with strict prohibition regimes versus forest where regulated management practices were permitted, e.g., low-intensity grazing), as well as variation in the extent to which these regimes have been maintained to the present day. The logit model shows a significant association of the strictness of the historical prohibition regime and its maintenance with current tree composition.
Through our analysis, sites emerge as being usually dominated by one of the four woody vegetation groups – HIGH-SAP in Greveniti, Vovoussa, and, partially, Palioseli and LOW-SHR in Vitsa, Mazi, and Kapesovo. The dominance of these two groups in the six sacred forests corresponds to the former management regime of the sites: complete protection for slope stability in the former and open canopy managed for shade and grazing in the latter.
The sites dominated by the HIGH-SAP group are all on steep slopes in elevated areas and exhibit minimal indicators of human interference (i.e., no evidence of former or current grazing, limited deadwood extraction). Their condition reflects the strong priority placed on these forests to protect downslope valley settlements from landslides and rockfalls (Volkwein et al., 2011). In addition, sacred forests characterized by these woody groups (at Palioseli and Greveniti) were governed through the threat of excommunication of trespassers, which acted as a strong deterrent to tree cutting or grazing (Stara et al., 2016). Such rules lead to a strict protection regime, which explains the lack of indicators of grazing and of human infrastructure (e.g., churches, roads, fences) in the HIGH-SAP group. Observance of these prohibitions extended to banning removal of fallen trees at least in Greveniti, which continues to the present day as revealed by the observation of Cullen (2015) of a great number of fallen trees at various stages of decay.
The three sites dominated by the low-canopy forest group (LOW-SHR) are characterized by the presence of browsed shrubs, coppice stools, and pollarded trees. This reflects use of the oak and mixed broadleaved communities for livestock grazing, for harvesting of tree fodder, and as shaded rest areas for the animals (in Greek stálos; Stara et al., 2016; although this now occurs less frequently, Pion, 2014). Thus, the high density of shrubs in these groups is a likely indicator of continuing livestock management practices. Grazing pressure can also influence species, e.g., J. oxycedrus a species avoided by goats and sheep, which can persist for decades in the understory, and is a good indicator of past and continuing grazing pressure (Rackham, 2015). J. oxycedrus accounts for 11.7 % of the total number of woody plants sampled in the subplots in the LOW SHR group (Appendix J).
The intermediate woody plant groups HIGH-SHR and LOW-SAP show the strongest evidence of undergoing change as the legacy of past management diminishes. This can be seen through processes of growth of the understory forest layer and regeneration in canopy gaps. Sites strictly protected to prevent erosion and landslides (which tended to be dominated by the HIGH-SAP group) have expanded through natural regeneration into the adjacent matrix of formerly more open areas. These younger secondary forests are often classified into the HIGH-SHR group. On-site observations of the vegetation at Greveniti indicate that the high forest has expanded into former wood pasture dominated by deciduous oaks, the remnants of which are still present as large decaying trunks. This is also evidenced by the abundance of J. oxycedrus, which accounts for 27.6 % of the total number of woody plants sampled in the subplots of the HIGH-SHR group (Appendix J). In these plots J. oxycedrus is often senescent, indicating that it is remnant of former open shrubland dominated by heavy-grazing impacts.
In areas where the intensity of grazing by goats and sheep has diminished, there has been an increase in natural tree regeneration in open patches identified as LOW-SAP, a likely indicator of a drift towards a less disturbed forest structure. As shown by previous work at Mazi and Vitsa by Pion (2014), the presence of active grazing has a strong influence on the structure of the understory – active grazing favors shrub species and shrubby form in palatable tree species (Carpinus orientalis) and sclerophyllous species (Juniperus spp.), while cessation of grazing allows sapling development.
4.3 Management implications
Our results indicate that tree composition in sacred forests is associated with variation in environmental variables as well as with variation in prohibition regimes in place in the forests. The capacity for ecological recovery of forests from the impact of previous management practices should be taken into account in planning for future conservation of sacred forests in Epirus. This recovery has been rapid following the major reduction in human and livestock impact in the region after major socioeconomic changes. This has transformed both the matrix and the internal structure and composition of some formerly isolated sacred forest patches. Therefore, linking habitat characteristics to former prohibition regimes as well as to current management is an essential part in the development of effective conservation management strategies for sacred forests in Greece. In this sense, an innovative integrated management to conserve both cultural and ecological value of sacred Greek forests could be initiated, focusing on reinstating former management practices (e.g., low-intensity grazing) to limit further changes in the heterogeneous structure and composition of the forests. This would support retaining large-sized trees, one of the main iconic cultural symbols of the sacred forests, which are currently threatened by increased competition from regenerating trees (Pulido and Diaz, 2005), which was observed to be occurring at a high rate in the present study. Revival of traditional management practices has also been proposed by Soliva et al. (2008) as a valid future scenario for Europe's mountain landscapes. Additionally, management of the boundary zone and the surrounding matrix could play a key conservation role in the near future, as forest fires, for example, could extirpate the rare forms of old growth wood pastures, especially those in the oak forest zone, which are now in danger of being lost. Finally, the role of local communities and their participatory involvement in the management of the sacred forests should also be recognized. The inclusion of a wide range of stakeholders into the management of the sacred forests and their boundary zones – including the community custodians – could enable the drafting of management plans legitimized by all relevant social groups, without interfering with existing cultural norms and taboos. This approach would allow the retention of the cultural and spiritual value of the forests in a changing environment and society, which would have a positive impact on key ecological conservation priorities (e.g., preservation of large-sized trees and conservation of taxa which benefit from older trees).
4.4 Conclusions
Through an analysis of vegetation patterns, we have shown that (i) variation in vegetation structure and composition amongst sacred forests in Epirus is substantial and it is linked to both environmental and sociocultural drivers; (ii) there is no major evidence indicating an overall trajectory of change in tree species composition between canopy and understory layers, though there are localized shifts in species and structure related to changes in intensity of management; and (iii) distinct woody plant groups can be identified across sites according to key environmental gradients and their association with the intensity and type of past forest prohibition regimes. In particular, historical control of grazing is identified as a major determinant of the current species composition and structure of sacred forests. Small size, large variability in species composition, and high variation in past prohibitions and the extent to which they have been gradually abandoned have led to a high level of variation in structure and species composition between sites. This suggests that, in order to maintain and preserve the sum of their conservation values (in particular beta diversity), a large conservation network of these forest patches should be promoted, maintaining distinct management regimes between the individual sites. As well as the direct benefits for landscape-scale biodiversity, this would increase socioecological resilience through promoting stronger local recognition and reducing the risk of complete loss of some components, e.g., due to fires (Avtzis et al., 2018) or, conversely, complete loss of disturbance by livestock. Understanding the main management drivers of sacred forests' dynamics is crucial for the design of participatory conservation practices, which are now urgently needed to maintain the important bio-cultural heritage of sacred forests in Greece. The recent inclusion of sacred forests in Greece in the UNESCO National Inventory of Intangible Cultural Heritage in 2014 (Intangible Cultural Heritage of Greece, 2016) creates opportunities and future challenges for the management of this peculiar socioecological system.
A canonical correspondence analysis (CCA) was performed as a check of the robustness of the main NMDS ordination. The CCA was run on both plot and subplot data, in order to identify associations between the tree similarity matrices and a pool of environmental variables (Appendix A). In order to account for spatial autocorrelation, we performed a partial CCA controlling for the effect of spatial correlation by including in a third matrix the coordinates for each plot (the variable used to filter out the spatial correlation). This analysis was repeated for both plot and subplot data. The results of the CCA are displayed below (only the first two axes and significant environmental variables are shown).
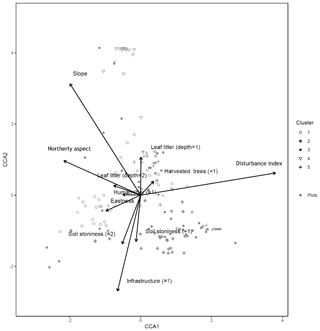
Figure B1Canonical correspondence analysis of 152 plots across six sacred forests for canopy trees. Plots are labeled according to the five clusters produced by the cluster analysis (1: pine (Pinus nigra); 2: mixed oaks (dominated by Quercus coccifera and Q. frainetto); 3: sclerophyllous species (Acer monspessulanum, Q. coccifera, and Juniperus oxycedrus); 4: beech (Fagus sylvatica); 5: mixed broadleaves (Q. pubescens and Carpinus orientalis). Arrows indicate explanatory variables with their arrowheads indicating direction of increase.
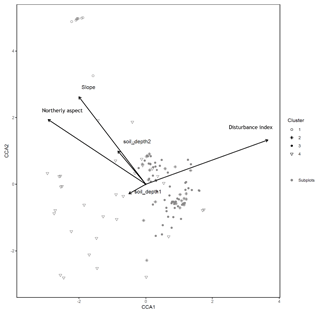
Figure B2Canonical correspondence analysis of 140 subplots across six sacred forests for understory saplings and shrubs. Subplots are labeled according to the four clusters produced by the cluster analysis (1: Fagus sylvatica; 2: Carpinus orientalis/Acer monspessulanum; 3: no significant species; 4: Carpinus betulus/Ostrya carpinifolia). Arrows indicate explanatory variables with their arrowheads indicating direction of increase.
Table C1Regression models between the three NMDS axis scores and environmental variables for canopy trees (plot layer). Only variables significant at the p<0.05 level are shown. The numbers in parentheses represent the different levels of the ordinal categorical variables. Coefficients are unstandardized.

* Explanatory variables are defined in Table 3 in Sect. 2.
Table D1Regression models between the three NMDS axis scores for understory saplings and shrubs (subplot layer) and plot environmental variables. Only variables significant at the p<0.05 level are shown. The numbers in parentheses represent the different levels of the ordinal categorical variables. Coefficients are unstandardized.
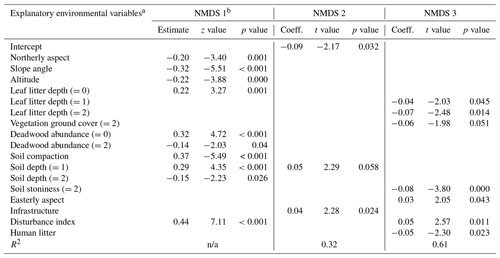
a Explanatory variables are defined in Appendix A. b Testing of the regression assumptions showed a nonlinear distribution of model residuals; therefore the Kendall rank correlation coefficient was used (estimate, z test, and p value). n/a – not applicable
In this appendix all the remaining graphical representations of the NMDS analysis at plot and subplot levels are provided.
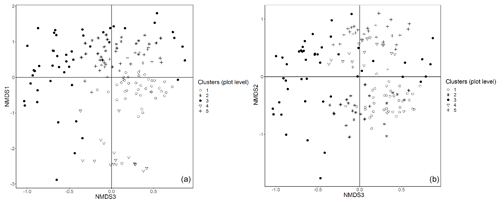
Figure E1Plot data – NMDS ordination (axes 1 and 3, a; axes 2 and 3, b) of 154 plots across six sacred forests for canopy trees. Plots are labeled according to the five clusters produced by the cluster analysis (1: pine (Pinus nigra); 2: mixed oaks (dominated by Quercus coccifera and Q. frainetto); 3: sclerophyllous species (Acer monspessulanum, Q. coccifera, and Juniperus oxycedrus); 4: beech (Fagus sylvatica); 5: mixed broadleaves (Q. pubescens and Carpinus orientalis).
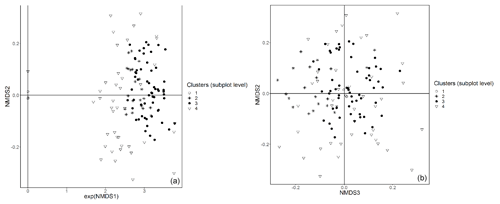
Figure E2Subplot data – NMDS ordination (axes 1 and 2, a; axes 2 and 3, b) of 147 subplots across six sacred forests for understory saplings and shrubs. Subplots are labeled according to the four clusters produced by the cluster analysis (1: Fagus sylvatica; 2: Carpinus orientalis/Acer monspessulanum; 3: no significant species; 4: Carpinus betulus/Ostrya carpinifolia). The first axis of the NMDS ordination was transformed as exp(NMDS) to improve readability.
Table F1A Kruskal–Wallis nonparametric test on selected environmental variables for the five clusters of canopy trees (plot layer) defined by the NMDS analysis of canopy trees in Fig. 3. Letters indicate groups that do not significantly differ within rows (p< 0.05). χ2 is chi-square; d.f. is degrees of freedom (between-group degrees of freedom and within-group degrees of freedom).
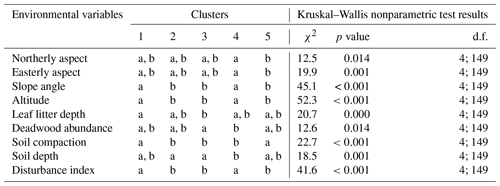
Table G1Kruskal–Wallis nonparametric test on selected environmental variables for the four clusters of understory saplings and shrubs (subplot layer) defined by the NMDS analysis of understory in Fig. 4. Letters indicate groups that do not significantly differ within rows (p<0.05). χ2 is chi-square; d.f. is degrees of freedom (between-group degrees of freedom and within-group degrees of freedom).
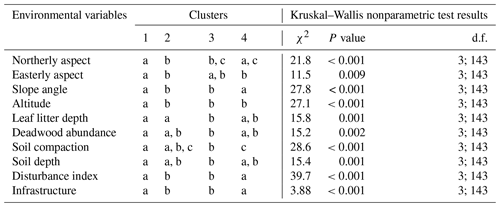
Table H1Final reconfiguration of canopy tree (main plot) and tree seedling and shrub (subplot) clusters. The numbers in bold refer to the number of sample units (plots and subplots) corresponding to each combination of clusters. The numbers of unclassified sample units and the total numbers are shown in regular font. The letters A, B, C, and D show the final configuration of four woody plant groups: (A) HIGH-SAP; (B) HIGH-SHR; (C) LOW-SAP; (D) LOW-SHR.
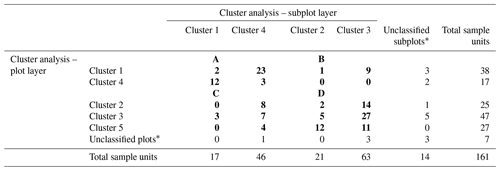
* The 18 unclassified sample units include 4 plots with no trees, 11 plots with no understory saplings or shrubs, and 3 with neither trees nor understory.
Table I1Average values of selected environmental and forest structure variables for the four woody plant groups. Letters indicate groups that do not significantly differ within rows (p<0.05; Kruskal–Wallis nonparametric test). χ2 is chi-square; d.f. is degrees of freedom (between-group degrees of freedom and within-group degrees of freedom).
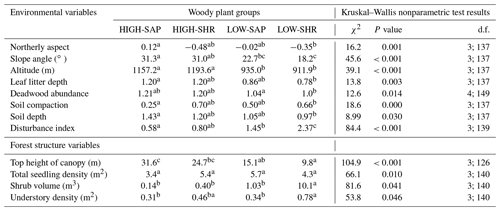
Table K1Species recorded in the sample plots: Latin scientific name, abbreviation used in the study, and average plot basal area (m2) (average subplot number of understory trees) for each of the studied sacred forests. The average basal area is presented in plain text, while the average number of understory trees is shown in bold. If a species has both values, it means that it was found at both plot and subplot levels. Four species were sampled only at sub-subplot level. These are Arbutus unedo, Calicotome villosa, and Ulmus minor in the Mazi sacred forest and Juglans regia in the Greveniti sacred forest.

a Including (Quercus cerris, Quercus frainetto, Quercus petraea, and Quercus. pubescens). b Data available at species level only for plot data.
All analyses have been run using the R computing environment (R Core Team, 2017).
Species rank abundance distributions (RADs)
R packages employed for the analysis and the graph visualization:
library("ggplot2")
library("Rcpp")
library("DataCombine")
Input dataset:
sites (dataset of species abundance at plot-level data for the six sacred
forests)
UNDsites (dataset of species abundance at subplot-level data for the six sacred
forests)
Relevant R scripts:
# calculate relative abundances (loop across sites)
for (i in 1:7) {
sumss< -colSums (sites, na.rm = FALSE, dims = 1)
sites < -rbind(sites,sumss)
UNDsumss< -colSums (UNDsites, na.rm = FALSE, dims = 1)
UNDsites < -rbind(UNDsites,UNDsumss)
colnames(UNDsites)[16] < - "for"
sites< -sites[i,]
sites< -sites[, colSums(sites != 0) >0] #eliminate zero values
sites< -sort(sites, decreasing=TRUE)
sites< -data.frame(t(sites)) #reshape it
sites["speciesn"] < - seq(1,nrow(sites), by=1)
colnames(sites)[1] < - "spptot"
sumofcolumn< -sum(sites$spptot) # now make percentage, total sum
sites$sppperc< -sites$spptot/sumofcolumn
sites$spp < - rownames(sites)
# now add understorey
UNDsites< -UNDsites[i,]
UNDsites< -UNDsites[, colSums(UNDsites != 0) >0] #eliminate zero values
UNDsites< -sort(UNDsites, decreasing=TRUE)
UNDsites< -data.frame(t(UNDsites)) #reshape it
UNDsites["Uspeciesn"] < - seq(1,nrow(UNDsites), by=1)
colnames(UNDsites)[1] < - "Uspptot"
sumofcolumn< -sum(UNDsites$Uspptot) # now make percentage, total sum
UNDsites$Usppperc< -UNDsites$Uspptot/sumofcolumn
UNDsites$spp < - rownames(UNDsites)
# Merge
all< -merge(sites,UNDsites, by="spp", all=TRUE)
# removing all observations with no canopy trees
# Remove missing values from column
all < - DropNA(all, Var = "sppperc", message = FALSE)
# and then make understorey data from NA to zero
#replace NA with zero
all[is.na(all)] < - 0
#order them by plot abundance
all< -all[order(all$speciesn),]
all$spp < - factor(all$spp, levels = all$spp[order(all$speciesn)])
#calculation of rmse between plot and understorey. store it to all
cann< -all$sppperc
uund< -all$Usppperc
str(uund)
bbb< -(cann-uund)**2
ccc< -sapply(bbb,mean)
ddd< -sqrt(ccc)
all$RMSE < - ddd # RMSE added
rbind(ddd, df[i, ])
}
NMDS based on a Bray–Curtis measure of dissimilarity
R packages employed for the analysis and the graph visualization:
library("vegan")
library("ggplot2")
Input dataset:
Sites_ba (dataset of species basal area at plot-level data for the six sacred
forests)
UNDsites (dataset of species abundance at subplot-level data for the six sacred
forests)
Relevant R scripts:
NMDSS< -metaMDS(Sites_ba, distance= "bray", k=3) # The number of reduced dimensions
NMDSS_UND< -metaMDS(UNDsites, distance= "bray", k=3) # The number of reduced dimensions
Cluster analysis based on Bray–Curtis measure of dissimilarity
R packages employed for the analysis and the graph visualization:
library("vegan")
library("factoextra")
library("ggplot2")
Input dataset:
Sites_ba (dataset of species basal area at plot-level data for the six sacred
forests)
UNDsites (dataset of species abundance at subplot-level data for the six sacred
forests)
Relevant R scripts:
braymatr< -vegdist(Sites_ba, method="bray",diag=TRUE)
braymatrund< -vegdist(UNDsites, method="bray",diag=TRUE)
irisCluster < -eclust(braymatr, "kmeans", k = 5,nstart = 25, graph = FALSE)
irisClusterUND < -eclust(braymatrund, "kmeans", k = 4,nstart = 25, graph = FALSE)
#silhuette
irisCluster$silinfo
irisClusterUND$silinfo
Kruskal–Wallis nonparametric test to identify patterns across clusters
R packages employed for the analysis and the graph visualization:
library("PMCMR")
Input dataset:
Clust_plt_env (dataset of species basal area at plot-level data for the six sacred
forests and relative clusters and environmental and management variables)
Clust_und_env (dataset of species abundance at subplot-level data for the six sacred
forests and relative clusters and environmental and management variables)
Relevant R scripts:
kruskal.test(each variable∼clusters)
posthoc.kruskal.nemenyi.test(x= each variable, g= clusters, dist="Chisquare")
Regressions between NMDS axes and environmental and management variables
R packages employed for the analysis and the graph visualization:
library("nlme")
library("ape")
library("gstat")
library("sp")
library("MuMIn")
Input dataset:
Env_NMDS (dataset of species basal area at plot-level data for the six sacred
forests, relative NMDS axes, and environmental and
management variables)
Env_NMDS_und (dataset of species abundance at subplot-level data for the six sacred
forests, relative NMDS axes, and environmental and management variables)
Relevant R scripts:
#moran test for checking on spatial correlation
env_NMDS< -na.omit(env_NMDS)
spatial.dists < - as.matrix(dist(cbind(env_NMDS$coord1, env_NMDS$coord2)))
head(spatial.dists, n=10)
# take inverse of the matrix values and replace the diagonal entries with zero:
spatial.dists.inv < - 1/spatial.dists
diag(spatial.dists.inv) < - 0
#We can now calculate Moran's I using the command Moran.I.
Moran.I(env_NMDS$NMDS1,scaled = TRUE, spatial.dists.inv)
Moran.I(env_NMDS$NMDS2,scaled = TRUE, spatial.dists.inv)
Moran.I(env_NMDS$NMDS3,scaled = TRUE, spatial.dists.inv)
# presence of spatial correlation. test significant. check variogram
# same routine done for understorey data
## Transform the dataframe into a SpatialPointDataFrame
## The objective is to obtain a spatial object
coordinates(env_NMDS)coord1+coord2
## Computation of the variogram
Vario_RDT=variogram(NMDS1∼1, data=env_NMDS, cutoff=100000,width=10000)
## Plot the experimental variogram
plot(Vario_RDT)
####now perform the regressions with this new structure
# only the final regression model of all axis is provided after that variables were removed using the AIC criterion
lme12_c < - lme(NMDS1∼Northness+ Slope+manag2+infrastructure, correlation = corLin(form coord1 + coord2), random 1|site.x,data=env_NMDS, na.action=na.omit)
r.squaredGLMM(lme12_c)
lme10_2_c < - lme(NMDS2∼ Northness+soil_depth+Altitude+cut_trees, corLin(form coord1 + coor lme9_3_c < - lme(NMDS3 ∼Northness+compact_soil+Eastness+ Slope+cut_trees+infrastructure, corLin(form coord1 + coord2), random 1|site.x,data=env_NMDS, na.action=na.omit) d2), random 1|site.x,data=env_NMDS, na.action=na.omit)
lme11_2_c < - lme(NMDS2 ∼ soil_depth+ Slope+infrastructure, corExp(form coord1 + coord2), random 1|site,data=env_NMDS_und, na.action=na.omit)
lme9_3_c < - lme(NMDS3 ∼ leaf_litter+ground_cover+stoniness+ Eastness+manag2+litter, corLin(form coord1 + coord2), random 1|site,data= env_NMDS_und, na.action=na.omit)
Canonical correspondence analysis
R packages employed for the analysis and the graph visualization:
library("CCA")
library("vegan")
library("gstat")
library("sp")
library("MuMIn")
Input dataset:
spp (dataset of species basal area at plot-level data for the six sacred
forests)
spp_und (dataset of species abundance at subplot-level data for the six sacred
forests)
spatial (dataset of coordinate at plot level)
envv (dataset of environmental and management variables at plot-level data for
the six sacred forests)
Relevant R scripts:
spplog < - decostand(spp, "log")
## Partial CCA,
partialccamodel < - formula(paste("spplog ∼", paste(nams[1: (length(envspatial)-(length(spatial)) )], collapse Condition(", paste(nams[(length(envspatial)- (length(spatial)-1) ):length(envspatial)], collapse
simplemodel< -cca(partialccamodel, envspatial)
finalmodelpartial< - ordistep(simplemodel, scope=formula(partialccamodel), direction = "backward")
# check vif
vif.cca(finalmodelpartial)
# Testing the significance of the CCA model:
anova.cca(finalmodelpartial)
# Testing the significance of terms (environmental variables):
anova.cca(finalmodelpartial, by="terms")
# Testing the significance of CCA axes (at least the first two or three should present a significant p value):
anova.cca(finalmodelpartial, by="axis")
Ordered logit model
R packages employed for the analysis and the graph visualization:
library("MASS")
library("MuMIn")
Input dataset:
Env_NMDS_logit (dataset of environmental and management variables with the final woody
group classifications for the six sacred forests)
Relevant R scripts:
# only the final logit model is provided after that variables were removed using the AIC criterion
mod2 < - clmm(clust_combination ∼ Northness+soil_depth+ Slope+ manag2+ infrastructure+coord2 +(1|site.x), data=env_NMDS222, Hess=T, nAGQ=17)
AIC(mod2)
## odds ratios
exp(coef(mod2))
ci < - confint(mod2) # default method gives profiled CIs
## OR and CI
exp(cbind(OR = coef(mod2), ci))
# pseudo r square
r.squaredGLMM(mod2)
The data that support the findings of this study are available from the corresponding author, Valentino Marini Govigli, upon reasonable request.
The authors declare that they have no conflict of interest.
JRH, JMH, JLGW, and VMG conceived and designed the study; VMG, JLGW, JRH, and JMH designed the methodology; JRH, JLGW, KS, and JMH acquired the funding; VMG, JLGW, KS, and RT conducted fieldwork; VMG analyzed the data; VMG wrote the original draft; JRH, JLGW, KS, RT, and JMH reviewed and edited the paper.
We would like to thank all the researchers involved in THALIS-SAGE for their indispensable guidance and teamwork, PALASE for providing accommodation facilities, and Northern Pindos National Park for providing maps and other relevant information. Many thanks especially to Nathalie Pion and Robert Cullen for their excellent research assistantship, to Bart Muys and Lavinia Piemontese for data analysis suggestions, and to Despoina Vokou for her final remarks on the paper. We also thank Roland Brandl and Michael Rudner for their valuable suggestions.
This research has been co-financed by the European Union (European Social Fund) and Greek national funds through the Operational Programme “Education and Lifelong Learning” of the National Strategic 25 Reference Framework – Research Funding Program: THALIS – Investing in knowledge society through the European Social Fund (grant number 379405).
This paper was edited by Jutta Stadler and reviewed by Roland Brandl and Michael Rudner.
Aerts, R., Van Overtveld, K., Haile, M., Hermy, M., Deckers, J., and Muys, B.: Species composition and diversity of small Afromontane forest fragments in northern Ethiopia, Plant Ecol., 187, 127–142, https://doi.org/10.1007/s11258-006-9137-0, 2006.
Akaike, H.: A new look at the statistical model identification, IEEE T. Automat. Contr., 19, 716–723, https://doi.org/10.1109/TAC.1974.1100705, 1974.
Amanatidou, D.: Analysis and Evaluation of a Traditional Cultural Landscape as a basis for its Conservation Management A case study in Vikos-Aoos National Park – Greece, dissertation, University of Freiburg, Freiburg, Germany, 2005.
Avtzis, D. N., Stara, K., Sgardeli, V., Betsis, A., Diamandis, S., Healey, J. R., Kapsalis, E., Kati, V., Korakis, G., Marini Govigli, V., Monokrousos, N., Muggia, L., Nitsiakos, V., Papadatou, E., Papaioannou, H., Rohrer, A., Tsiakiris, R., Van Houtan, K. S., Vokou, D., Wong, J. L. G., and Halley, J. M.: Quantifying the conservation value of Sacred Natural Sites, Biol. Conserv., 222, 95–103, https://doi.org/10.1016/j.biocon.2018.03.035, 2018.
Bergmeier, E.: Plant communities and habitat differentiation in the Mediterranean coniferous woodlands of Mt. Parnon (Greece), Folia Geobot., 37, 309–331, 2002.
Bergmeier, E. and Dimopoulos, P.: Identifying plant communities of thermophilous deciduous forest in Greece: Species composition, distribution, ecology and syntaxonomy, Plant Biosyst., 142, 228–254, https://doi.org/10.1080/11263500802150357, 2008.
Bhagwat, S. A. and Rutte, C.: Sacred groves: potential for biodiversity management, Front. Ecol. Environ., 4, 519–524, https://doi.org/10.1890/1540-9295(2006)4[519:SGPFBM]2.0.CO;2, 2006.
Blondel, J., Aronson, J., Bodiou, J. Y., and Boeuf, G.: The Mediterranean Region Biological Diversity in Space and Time, 2nd Edn., Oxford University Press, New York, ISBN-10: 0199557993, 2010.
Cullen, R.: Forest dynamics in a Fagus sylvatica dominated forest in North West Greece, MSc thesis, Bangor University, United Kingdom, 2015.
Daye, D. D. and Healey, J. R.: Impacts of land-use change on sacred forests at the landscape scale, Glob. Ecol. Conserv., 3, 349–358, https://doi.org/10.1016/j.gecco.2014.12.009, 2015.
De Cáceres, M., Legendre, P., Wiser, S. K., and Brotons, L.: Using species combinations in indicator value analyses, Methods Ecol. Evol., 3, 973–982, https://doi.org/10.1111/j.2041-210X.2012.00246.x, 2012.
Dudley, N., Higgins-Zogib, L., and Mansourian, S.: The links between protected areas, faiths, and sacred natural sites, Conserv. Biol., 23, 568–577, https://doi.org/10.1111/j.1523-1739.2009.01201.x, 2009.
Dufrene, M. and Legendre, P.: Species assemblages and Indicator Species: the need for a flexible asymmetrical approach, Ecol. Monogr., 67, 345–366, https://doi.org/10.1890/0012-9615(1997)067[0345:SAAIST]2.0.CO;2, 1997.
EEA: available at: http://natura2000.eea.europa.eu/, last access: 14 June 2016.
Fox, J. and Monette, G.: Generalized Collinearity Diagnostics, J. Am. Stat. Assoc., 87, 178–183, https://doi.org/10.1080/01621459.1992.10475190, 1992.
Frosch, B., Jäckle, H., Mhamdi, A., Achhal El Kadmiri, A., Rudner, M., and Deilet, U.: Sacred sites in north-western Morocco – naturalness of their vegetation and conservation value for vulnerable plant species, Feddes Repert., 127, 83–103, https://doi.org/10.1002/fedr.201600026, 2016.
GADM database of Global Administrative Areas, version 2.0, available at: http://www.gadm.org, last access: 17 January 2017.
Gao, H., Ouyang, Z., Chen, S., and van Koppen, C. S. A.: Role of culturally protected forests in biodiversity conservation in Southeast China, Biodivers. Conserv., 22, 531–544, https://doi.org/10.1007/s10531-012-0427-7, 2013.
Garcia, C. A., Pascal, J. P., and Kushalappa, C. G.: Les forêts sacrées du Kodagu en Inde:ecologia y religion [The sacred forests of Kodagu in India, ecology and religion], Bois. For. Trop., 288, 5–13, 2006.
Hu, Z. and Lo, C. P. Modeling urban growth in Atlanta using logistic regression, Computers, Environment and Urban Systems, 31, 667–688, 2007.
Intangible Cultural Heritage of Greece: available at: http://wip.culture.gr/wp-content/uploads/2016/11/Sacred_forests.pdf, last access: 10 December 2019.
Jäckle, H., Rudner, M., and Deil, U.: Density, spatial pattern and relief features of sacred sites in Northern Morocco, Landsc. Online, 32, 1–16, https://doi.org/10.3097/LO.201332, 2013.
Korakis, G., Kapsalis, E., Tsiakiris, R., Betsis, A., Stara, K., Halley, J. M., Papaioannou, X., and Kati, B.: On the floristic diversity of sacred forests in north Pindos, in: Proceedings of the 8th Panhellenic Rangeland Congress, edited by: Kyriazopoulos, A., Karatasiou, M., Sklavou, P., and Chouvardas, D., Thessaloniki, Greece, 1–3 October 2014, 117–122, 2014.
Kutiel, P.: Slope aspect effect on soil and vegetation in a Mediterranean ecosystem, Israel J. Bot., 41, 243–250, 1992.
Magurran, A. E.: Measuring biological diversity, Blackwell, Oxford, 2004.
Mallarach, J. M.: Chapter 1, Introductory overview of the spiritual values in the Protected Areas of Europe, in: Spiritual values of protected areas of Europe, BfN-Skripten 322, Bonn, Germany, 21–31, 2012.
Mishra, B. P., Tripathi, O. P., and Pandey, H. N.: Effects of anthropogenic disturbance on plant diversity and community structure of a sacred grove in Meghalaya, northeast India, Biodivers. Conserv., 13, 421–436, https://doi.org/10.1023/B:BIOC.0000006509.31571.a0, 2004.
Northern Pindos National Park: available at: http://pindosnationalpark.gr/en/the-protected-area/, last access: 30 September 2017.
Oviedo, G. and Jeanrenaud, S.: Protecting sacred natural sites of indigenous and traditional peoples, in: Protected Areas and Spirituality, edited by: Mallarach, J. M. and Papayannis, T., Publicacions de l'Abadia de Montserrat, Gland, Switzerland, 77–100, 2007.
Papanastasis, V. P.: Land abandonment and old field dynamics in Greece, in: Old Fields: Dynamics and restoration of abandoned farmland, edited by: Hobbs R. J., Island Press, Washington, USA, 225–285, 2007.
Papigo weather station: available at: http://penteli.meteo.gr/stations/papigo/, last access: 17 January 2020.
Paradis, E.: Moran's Autocorrelation Coefficient in Comparative Methods, available at: https://cran.r-project.org/web/packages/ape/vignettes/MoranI.pdf, last access: 2 May 2020.
Pion, N.: Effect of grazing management practices on the structure of sacred groves in Epirus, Greece, MSc thesis, Bangor University, United Kingdom, 2014.
Pohlert, T.: The Pairwise Multiple Comparison of Mean Ranks Package (PMCMR), R package, available at: https://cran.r-project.org/web/packages/PMCMR/vignettes/PMCMR.pdf, last access: 2 February 2020, 2014.
Pulido, F. and Díaz, M.: Regeneration of a Mediterranean oak, Ecoscience, 12, 92–102, https://doi.org/10.2980/i1195-6860-12-1-92.1, 2005.
Rackham, O.: Sacred Natural Sites: Sacred Forests in Epirus, unpublished manuscript, 2015.
R Core Team: R: A language and environment for statistical computing, R Foundation for Statistical Computing, Version 3.4.1., available at: https://www.r-project.org/ (last access: 12 May 2020), 2017.
Rodriguez-Moreno, V. M. and Bullock, S. H.: Vegetation response 60 to hydrologic and geomorphic factors in an arid region of the Baja California Peninsula, Environ. Monit. Assess., 186, 1009– 1021, 2014.
Schaminée, J. and Hennekens, S.: Review of EUNIS forest habitat classification, Report EEA/NSV/13/005, 2013.
Soliva, R., Rønningen, K., Bella, I., Bezak, P., Cooper, T., Flø, B. E., Marty, P., and Potter, C.: Envisioning upland futures: Stakeholder responses to scenarios for Europe's mountain landscapes, J. Rural Stud., 24, 56–71, https://doi.org/10.1016/j.jrurstud.2007.04.001, 2008.
Stara, K., Tsiakiris, R., and Wong, J. L. G.: The Trees of the Sacred Natural Sites of Zagori, NW Greece, Landscape Res., 40, 1–21, https://doi.org/10.1080/01426397.2014.911266, 2015.
Stara, K., Tsiakiris, R., Nitsiakos, V., and Halley, J. M.: Religion and the Management of the Commons. The Sacred Forests of Epirus, in: Biocultural Diversity in Europe, edited by: Agnoletti, M. and Emanueli, F., Springer International Publishing, Cham, Switzerland, 283–301, 2016.
Sternberg, M. and Shoshany, M.: Influence of slope aspect on Mediterranean woody formations: Comparison of a semiarid and an arid site in Israel, Ecol. Res., 16, 335–345, 2001.
Tsiakiris, R., Stara, K., Pantis, I., and Sgardelis, S.: Microhabitat selection by three common bird species of montane farmlands in northern Greece, J. Environ. Manage., 44, 874–887, https://doi.org/10.1007/s00267-009-9359-8, 2009.
Tsiakiris, R., Betsis, A., Stara, K., Nitsiakos, V., Roubas, V., and Halley, J. M.: Defining sacred forests in Konitsa and Zagori: A method of randomly selecting research and control sites for biodiversity study and further statistical analysis, Report of 1st and 4th Working Groups, Project THALIS-SAGE “Conservation through religion. The sacred groves of Epirus”, 2013.
Tsiakiris, R., Stara, K., Marini Govigli, V., and Wong, J.: Walking in sacred forests with Oliver Rackham: a conversation about relict landscapes in Epirus NW Greece, Countryside History: Collected essays in honour of the late Professor Oliver Rackham, edited by: Rotherham, D. and Moody, J., Pelagic Publishing, in review, 2020.
Upadhaya, K., Barik, S., Pandey, H., and Tripathi, O.: Response of woody species to anthropogenic disturbances in sacred forests of Northeast India, International Journal of Ecology and Environmental Sciences, 34, 1–13, 2008.
Verschuuren, B., Wild, R., McNeely, J., and Oviedo, G.: Chapter 1, Introduction: Sacred Natural Sites, the Foundations of Conservation, in: Sacred Natural Sites: Conserving Nature Culture, IUCN, Washington, USA, 1–15, 2010.
Volkwein, A., Schellenberg, K., Labiouse, V., Agliardi, F., Berger, F., Bourrier, F., Dorren, L. K. A., Gerber, W., and Jaboyedoff, M.: Rockfall characterisation and structural protection – a review, Nat. Hazards Earth Syst. Sci., 11, 2617–2651, https://doi.org/10.5194/nhess-11-2617-2011, 2011.
Wild, R. and McLeod, C.: Sacred Natural Sites: Guidelines for Protected Area Managers, IUCN, Gland, Switzerland, 5–15, 2008.
Wong, J., Baker, N., Boden, R., and Kleinn, C.: Non-Wood Forest Products, Resource Assessment Guidelines, Volume 2: Reference material, unpublished manuscript, 2007.
Zilliox, C. and Gosselin, F.: Tree species diversity and abundance as indicators of understory diversity in French mountain forests: Variations of the relationship in geographical and ecological space, Forest Ecol. Manag., 321, 105–116, https://doi.org/10.1016/j.foreco.2013.07.049, 2014.
SNS: areas “set aside” for spiritual or religious purposes (Oviedo and Jeanrenaud, 2007; Verschuurenn et al., 2010).
In this paper we make use of the term forest prohibition regime to refer to the forest management practices (tree cutting, deadwood removal, grazing) which were allowed or not in the different sacred forests, according to community rules and cultural taboos.
As an alternative analysis, we performed a canonical correspondence analysis (CCA) on the tree similarity matrix and related environmental variables (Appendix B). We found that the results yielded by this analysis are comparable to the NMDS.
- Abstract
- Introduction
- Material and methods
- Results
- Discussion
- Appendix A
- Appendix B: Canonical correspondence analysis
- Appendix C
- Appendix D
- Appendix E: NMDS ordination: all axes combinations
- Appendix F
- Appendix G
- Appendix H
- Appendix I
- Appendix J
- Appendix K
- Appendix L: Main R packages and code scripts used for the analyses
- Data availability
- Competing interests
- Author contributions
- Acknowledgements
- Financial support
- Review statement
- References


