the Creative Commons Attribution 4.0 License.
the Creative Commons Attribution 4.0 License.
 | 02 Aug 2024
Environmental DNA in different media reveals distribution characteristics and assembly mechanisms of fish assemblages in a complex river–lake system
Yun Shao
Shuping Wang
Pengyuan Wang
Shuhui Men
Miaomiao Qian
Aopu Li
Meiping Feng
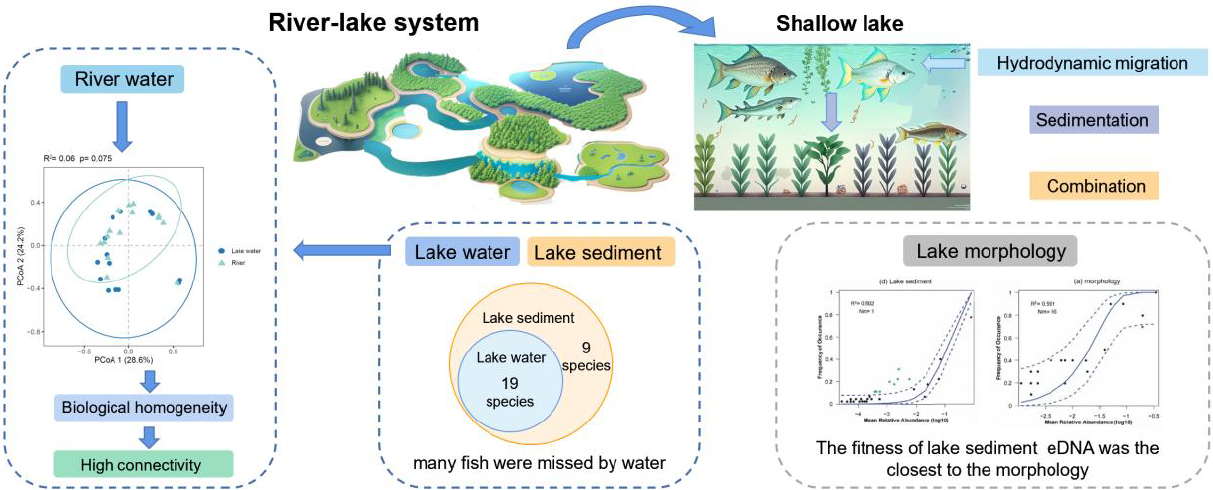
Capture-based methods are commonly used for biomonitoring fish assemblages in freshwater. The recent advancement in environmental DNA (eDNA) metabarcoding provides a sensitive, cost-effective, and non-intrusive alternative to traditional methods. Nevertheless, the effectiveness of this approach in river–lake systems has yet to be assessed, and there is ongoing debate regarding the selection of sampling media. In this study, we investigated fish assemblages based on traditional approaches and the eDNA metabarcoding method by analyzing water and sediment from 30 locations along the Baiyang Lake and its inflow rivers (China). The results showed that 21 species were identified based on traditional methods, and a total of 29 species were detected using eDNA, with 22 species found in river water eDNA, 25 species in lake water eDNA, and 27 species in surface sediment samples. Nine benthic fish species were detected exclusively in sediment. The community composition of rivers and lakes revealed by water eDNA is similar, reflecting the biotic homogenization in this river–lake system. A neutral community model (NCM) analysis based on lake water and river water eDNA showed that fish assemblages were not dominated by random processes (5.3 % and 2.7 % concordance with the neutral model, respectively), while analysis of surface sediment eDNA showed more support for random processes (50.2 %). Temperature was the main environmental factor correlated with water eDNA, while NH3–N and TP were the main factors correlating with sediment eDNA.
- Article
(4899 KB) - Full-text XML
-
Supplement
(462 KB) - BibTeX
- EndNote


Freshwater fish represent one-fourth of the world's vertebrates and provide irreplaceable goods and services (Manel et al., 2020; Su et al., 2021). As an important element of aquatic biodiversity, fish display integrated responses to multiple pressures and are ideal objects for a comprehensive assessment of the ecological health of rivers and lakes (Poikane et al., 2017; Ritterbusch et al., 2022; Yu et al., 2021). Understanding the geographical distribution patterns and assembly mechanisms of fish assemblages is essential for the conservation and management of fish diversity (Jackson et al., 2001). Theories based on niche and neutral processes describe the assembly mechanisms of fish assemblages. According to the niche theory, the structure and diversity of a biological community are primarily controlled by biotic interactions, interspecific trade-offs, and abiotic conditions (Chesson, 2000; Chase and Myers, 2011). In contrast, the neutral process theory assumes that biomes exhibit random equilibrium in the loss and gain of the class group and emphasizes random processes (birth, death, migration, immigration, speciation, and limited dispersal) that shape the community structure (Hubbell, 2001). While niche theory has been a foundational principle in ecology, providing a framework for understanding species distributions and interactions, it is essential to recognize the diversity of theoretical perspectives that contribute to our understanding of ecological systems. Neutral theories have been shown to reliably reproduce certain patterns of species distribution and β diversity (Mitchell et al., 2019), offering valuable insights into community assembly processes that are not solely dependent on niche differences. Empirical studies have demonstrated that neutral theory is not mutually exclusive with classic niche theory but complementary, as it defines the special case when species are ecologically equivalent to one another, and the stabilizing forces required for their coexistence may be immeasurably small (Shinen and Navarrete, 2014; Siepielski and McPeek, 2010). Therefore, a significant amount of research is dedicated to reconciling the importance of niche and neutral processes in species coexistence, like the relative materiality of habitat associations and seed dispersal across various tree growth stages (Comita et al., 2007), the development of a continuum model with the niche and neutral models as the two extremes to predict the relative importance of niche and neutral processes in controlling community dynamics (Gravel et al., 2006), and the operational framework to determine the influence for biotic and abiotic factors through the functional traits (de Bello et al., 2012).
Previous studies in fish assemblages have focused on deterministic responses to environmental gradients like temperature (Magnuson et al., 1979), nutrient salt (Öğlü et al., 2020), pH (Harvey, 1975), and ecological species interactions such as predation (Roff et al., 2019) and competition (Wikramanayake, 1990). A study on the drivers of freshwater fish diversity and clustering patterns in China quantified the effects of both biogeographic and anthropogenic activities, showing that biogeographic drivers accounted for 21.8 % of fish assemblage patterns, compared to 15.6 % contributed by human drivers, including economic level and fishery resources (Guo et al., 2019). Research on the human impacts on global freshwater fish biodiversity shows that temperate rivers, whose biodiversity changes were primarily due to river fragmentation and the introduction of non-native species, are impacted the greatest (Su et al., 2021). However, other studies have shown that there is no clear pattern between fish diversity and environmental drivers and that stochastic processes are responsible for fish assemblage structure in most shallow lakes (Jia et al., 2022; Lu et al., 2023). Fish assemblage assembly mechanisms vary significantly across different water types and spatial scales. Rivers and lakes exhibit significant differences in geomorphology and hydrology, which shape the different biogeochemical cycling, species assemblages, interspecific interactions, and aquatic ecosystem species composition between them (Haakonsson et al., 2017; Jones et al., 2017). In response to this, lakes and rivers have distinct methods for the assessment of biodiversity and different management regulations. However, limited studies have assessed the impact of hydrology, water quality factors, and species dispersal on fish distribution patterns in continuous river–lake systems, hindering the development of effective management plans.
Traditional fish surveys typically utilize methods such as bottom trawling, electric fishing, ground cage, and others (Jiang et al., 2023; Wang et al., 2021; Marques et al., 2021; Valdivia-Carrillo et al., 2021; Hänfling et al., 2016). However, these methods can be time-consuming and expensive and could damage the fish diversity (Hiddink et al., 2011; Thomas et al., 2019; Sogn-Grundvåg et al., 2022; Banerjee et al., 2022a). Therefore, there is a demand for an efficient, comparatively inexpensive, and non-invasive alternative method for qualitative and quantitative fish investigations. Environmental DNA (eDNA) metabarcoding, which detects the presence of organisms via intracellular or extra-organismal DNA in the environment and partially damaged or fragmented specimens, has emerged as a promising tool for species detection and utilizes high-throughput sequencing after PCR amplification of conserved genomic regions (barcodes) from environmental samples (Taberlet et al., 2012; Yan et al., 2023; Chen et al., 2023; Qian et al., 2023). Compared to traditional methods, the eDNA method offers distinct advantages when sampling in complex habitats such as river water heads and deep waters (Saenz-Agudelo et al., 2024) and can distinguish cryptic species sensitively (Banerjee et al., 2022b). Water and sediment are commonly used environmental media for eDNA studies of aquatic organisms. Sediments are generally considered to have better preservation ability (Turner et al., 2015; Kuwae et al., 2020), but some studies have shown comparable preservation times between sediments and water (Wei et al., 2018), with more species being detected in water samples (Buxton et al., 2018; Sales et al., 2021). Consequently, the detection efficiency of these two environmental media is still controversial.
The purpose of this study was to characterize the fish assemblages by eDNA in different media and to shed light on the potential assembling mechanisms of fish assemblages in a complex river–lake system. We compare fish assemblages identified by traditional fishing methods and eDNA to examine the influence of sample medium (water or sediment) and water body type (river or lake) on eDNA detection and explore how they further influence our determination of the assembly mechanisms of fish assemblages.
2.1 Site description and sample collection
The Baiyang Lake basin (Fig. 1) is located in the North China Plain (38°44'–38°59' N, 115°45'–116°07' E), with an area of 366 km2 and an average water depth of approximately 2–5 m. It consists of several small lakes that are connected to eight inflow rivers: the Baigouyin River, Ping River, Pu River, Cao River, Fu River, Tang River, Xiaoyi River, and Zhulong River, forming a typical river–lake connection system. Unfortunately, the construction of dams and reservoirs upstream of the Baiyang Lake basin has led to a decrease in the flow of most inflow rivers, with some even drying up at times. Consequently, Baiyang Lake's water level has decreased, resulting in a deteriorating ecological situation (Chen et al., 2020).

Figure 1Map of sampling sites of the Baiyang Lake and its inflow rivers.
In this study, a total of 30 sampling sites were selected in April 2019, comprising 15 sites (R1–R15) in the 7 inflow rivers and 15 sites (L1–L15) in the lakes (Fig. 1). At each site, a sample of 1 L of water was collected to determine the physical and chemical characteristics. For eDNA analysis, 5 L of water samples were filtered using a LEADFLUID (BT103S) speed-variable peristaltic pump through a diameter of 0.22 µm polycarbonate membrane (Millipore, USA). At each site, three duplicate samples were collected for analysis.
Purified water was filtered as a negative control at each site. After each filtration, the filtration apparatus was carefully rinsed with deionized water to prevent cross-contamination (Li et al., 2019; Zhang et al., 2022). The filter membranes were folded using sterile tweezers, placed into 5 mL sterile freeze tubes, and stored in liquid nitrogen until DNA extraction. The sediment samples were collected only in lakes, and 25 g of surface sediment was collected at each site. The sediment was then placed in a sampling tube and frozen in liquid nitrogen, and the DNA extraction was completed within 1 week.
2.2 Traditional fish surveys
Five lake sites, spaced more than 300 m apart, were selected for sample collection using a combination of the electric fish method and the hanging net method. A double-shouldered 32-tube ultrasonic electric fishing instrument was used for the sample locations with a water depth less than 1.5 m and the wading region along the lakeshore (Sullivan et al., 2015). Gill nets were utilized to catch fish for roughly an hour in samples where the water depth was more than 1.5 m. To achieve a more thorough sampling, the gill nets employed have three different mesh sizes: 6 cm × 6 cm, 12 cm × 12 cm, and 20 cm × 20 cm. Each site's catch of fish was tallied in terms of both species and individuals. Fish were classified into the species level on site, with unidentified species brought back to the lab for further identification.
2.3 Environmental factor detection
Several water parameters, temperature (T), electrical conductivity (SpCond), dissolved oxygen (DO), pH, turbidity (Turb), oxidation reduction potential (ORP), and chlorophyll a (Chl a), were measured on site using the multi-parameter water quality detector Hydrolab HL4 (HACH, USA). Additionally, CODCr and TP were measured in the laboratory. For sediment, heavy metals (Cr6+, Zn, Ni, Cr, Cu, Pb, Cd, As, and Hg) and nutrients (NH3–N, TN, and TP) were measured in the laboratory.
2.4 Environmental DNA processing
The DNeasy PowerWater Sterivex Kit and DNeasy PowerMax Soil Kit (Qiagen, Germany) were used to extract eDNA from the filter and sediment samples, respectively. The experimental procedures were carried out in accordance with the instructions. The concentration and quality of extracted eDNA were measured using a UV spectrophotometer (NanoDrop, Thermo Scientific Inc., USA). All DNA extracts were stored at −20° until paired-end library preparation. Negative controls were coextracted alongside the samples and were subjected to the same protocol as the samples. The DNA concentration was determined using the Qubit dsDNA HS Assay Kit and detected in a 1.0 % agarose gel. No bands were observed for the negative controls.
The 12S primers were used to target the teleost fishes: MiFish-U-F (5'-GTCGGTAAAACTCGTGCCAGC-3') and MiFish-U-R (5'-CATAGTGGGGTATCTAATCCCAGTTTG-3') (Miya et al., 2015), with the 12 bp barcode added to the 5' end. We used a 25 µL PCR reaction solution containing 12.5 µL of CloneAmp HiFi PCR Premix (Takara, Japan), 0.5 µL of each MiFish primer (5 µM primer F/R), 1 µL of eDNA template, and up to 25 µL of sterile distilled water. To minimize the loss of PCR, a sample was performed with eight technical repetitions using eight tubes of 0.2 mL. Following an initial 3 min denaturation at 94°, the thermal cycle profile was as follows: a 30 s denaturation at 94°, a 20 s annealing at 45°, and a 50 s extension at 72°. After the cycles, a 10 min final extension was performed at 72°. Then, eight tubes of PCR results were combined into one 1.5 mL tube, and the combined products were filtered with a GeneRead Size Selection Kit (Qiagen) to get rid of dimers and monomers. Sequencing was performed via 180 bp paired-end sequencing by the Illumina HiSeq 2500 sequencer (Illumina, San Diego, CA, USA). Base calling analysis transforms the resulting raw image data files into raw sequenced reads.
2.5 Bioinformatics analysis
The raw sequencing data were cleaned by eliminating tags and reads shorter than 100 bp using MEGA (v7.0). Subsequently, paired-end reads were merged based on overlaps using FLASH (v1.2.11) (Magoč and Salzberg, 2011). Then, the reads were clustered into operational taxonomic units (OTUs) using USEARCH (version 7.0.1090) (Rognes et al., 2016) with a 97 % threshold, and chimeras were filtered out using UCHIME (v4.2.40) (Rognes et al., 2016). Each tag was mapped to its corresponding representative OTU sequence using USEARCH. OTUs with a count of < 10 or a percentage of < 0.1 % were filtered out for each PCR, and then the OTU abundance table was generated. The taxonomic assignment of OTU sequences was performed using BLAST against the NCBI database and MitoFish database. The OTUs with alignment lengths less than 90 % and similarity less than 80 % were filtered out, and the boundaries of five taxonomic levels of species, genus, family, order, and class were assigned according to the thresholds of 98 %, 95 %, 90 %, and 85 % similarity. OTUs corresponding to marine and/or non-resident species were attributed to DNA contamination in the sewage and excluded from further analyses. All of the OTUs that were ultimately retained had known morphological records within the study area. OTU data at the species level were used for the following analyses.
2.6 Ecological and statistical analyses
All statistical analyses were carried out in R (v4.2.2, R Core Team, 2022), and graphs were plotted using GGPLOT2 v2.2.1. The OTU abundance table was transformed using the Hellinger method, which consists of turning abundances into proportional values out of the sample total count and performing the square root transformation. The environmental data were conversed logarithmically, centered, and scaled to offset the effects of different dimensions. Detrended correspondence analysis (DCA) was performed to determine whether to use redundancy analysis (RDA) or canonical correspondence analysis (CCA).
A combined bar chart was used to show the variation in the number of species detected in eDNA from water (L1-w∼L15-w) and sediment (L1-s∼L15-s) samples across each lake site. Differences between fish assemblage structure inferred from eDNA in river water (R1∼R15), lake water (L1-w∼L15-w), and lake sediment (L1-s∼L15-s) were visualized using nonmetric multidimensional scaling (NMDS) with 999 permutations. The community difference was calculated based on the Jaccard dissimilarity, and NMDS stress was utilized to assess the representation of ordination. Permutational multivariate analysis of variance (PERMANOVA) was used to evaluate the differences in the two media (water and sediment) and two water types (river and lake). NMDS and PERMANOVA were calculated using “vegan” package v2.5.6's “metaMDS” and “adonis” functions, respectively.
A neutral community model (NCM) (Sloan et al., 2006) was employed to assess the impact of stochastic processes. The NCM predicts the relationship between occurrence frequency and relative species abundance in metacommunities based on random drift and dispersion (Lu et al., 2023) and assumes equal fitness among species. The parameter Nm is an estimate of dispersal between communities, where N is the size of the meta-community, and m is the migration rate; the parameter R2 measures the fitness of NCM (nonlinear least-squares fitting), and a higher R2 implies that stochastic processes have contributed a greater portion to the community assembly (Isabwe et al., 2022).
Additionally, RDA and variation partitioning analysis (VPA) were performed to evaluate the influence of water environmental factors on fish assemblage structure.
3.1 Fish community composition monitored by eDNA and traditional methods
A total of 7295 OTUs were detected in the eDNA survey, and 112 and 114 OTUs were annotated to the species level in the NT and MitoFish databases, respectively. A total of 32 species that had not been recorded in the historical surveys and the traditional survey were excluded from the analysis; it has been noted that eDNA does not always indicate the presence of species due to the utilization of indirect markers (Oka et al., 2021). To prevent potential cross-contamination or limitation from an incomplete reference database, the 32 non-native species were excluded for subsequent analysis. A total of 29 species belonging to 11 families and 4 orders were detected by eDNA, 21 species belonging to 3 families and 2 orders were captured by traditional methods, 3 species were only obtained by traditional methods, and 12 species only occurred in eDNA data (Table S1 in the Supplement). The species composition of the river water, lake water, and lake sediment was roughly similar, and at the order level, four orders were presented among the three groups: Cypriniformes, Perciformes, Siluriformes, and Beloniformes, with decreasing proportions. A total of 19 species of 8 families were detected in river samples, 23 species of 12 families were detected in lake water, and 27 species of 13 families were detected in lake sediments (Fig. 2). There were some differences in the main species at different sites. Cyprinus carpio is the dominant species in most sites, especially in L8 and L15. But at some sites, Pseudorasbora parva (R13), Hemiculter leucisculus (R4 and R14), Channa argus (R3), and Hypophthalmichthys nobilis (L6-w) are the main species. Species composition revealed by traditional methods differed greatly from that by eDNA, mainly containing Carassius auratus at all sites.

Figure 2Relative abundance (%) of species in Baiyang Lake and its inflow rivers. Species that rank below the top 10 in average abundance are displayed as other species.
A total of 19 species were detected in lake water samples, all of which were also detected in the sediment, while 9 species were detected only in the sediment. Among the nine species, Acheilognathus macropterus and Zacco platypus prefer to live in the middle and upper water layer, and Rhynchocypris lagowskii prefer the middle and lower water layers; the remaining six species were benthic fish (Table S1). Additionally, more species were detected in sediment than water at almost half of the 15 lake sampling sites (Fig. S2). At the 15 lake sampling sites, more species were detected in sediments at almost half of the sites (Fig. S2). At 5 traditional survey sites, 11 species were exclusively identified using traditional methods, 8 species were common in both media and methods, and 3 and 5 species were detected solely in water and sediment eDNA (Fig. 3).

Figure 3Comparison of species obtained by eDNA methods and traditional methods in water and sediment in five lake sites.
3.2 Fish α and β diversity
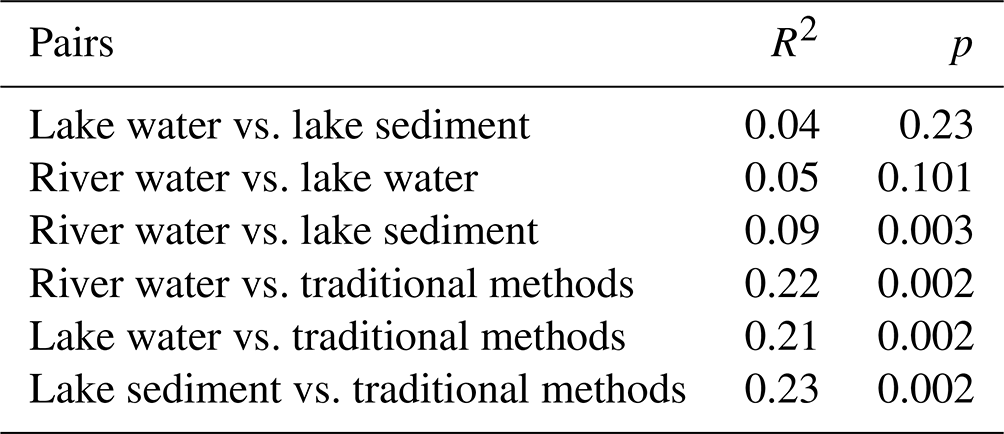
For three eDNA groups, lake sediment had the highest β diversity, followed by lake water, with river water being the lowest. Five sites in traditional methods had a low variation in fish assemblages. Although lake sediment detected nine unique species relative to lake water, there was no significant difference in β diversity (R2=0.04, p=0.23) between the two media. River water and lake water were also not significantly different (R2=0.05, p=0.101), but all eDNA groups were significantly different from traditional data (Fig. 4, Table 1).
Five traditional survey sites had a higher α diversity, and subsequent rankings were lake sediment, river, and lake water. All groups showed no significant difference in α diversity, except for the lake water group, which exhibited a significant variance compared to traditional methods (Fig. 5).
Table 1The analysis of similarities (ANOSIM) pairwise test results of the river water eDNA, lake water eDNA, lake sediment eDNA, and traditional methods.
3.3 Relative importance of stochastic and deterministic processes in community assembly
A significant disparity was observed in the R2 between lake water and sediment in the neutral community model, indicating a substantial difference in their fit with the model (Fig. 6a, b). Lake sediment eDNA data have a high fitting degree with the NCM (R2=0.502), while lake water data do not fit well (R2=0.053). The combined results of the water and sediment data did not fit the model () (Fig. 6c). The riverine eDNA also did not fit the neutral model well (R2=0.027) but demonstrated a strong migratory ability of riverine eDNA (Nm = 16) (Fig. 7d). The lake water eDNA exhibited low migration (Nm = 9), and the degree of community migration of sediment eDNA was the lowest (Nm = 1).
3.4 Environmental drivers of the community structure
After the DCA test, RDA and CCA were used to visualize the influence of water and sediment environment factors on fish distribution. The results showed that for water, temperature was the sole factor significantly influencing fish assemblage structure (Fig. 7a, Table S3), and for sediment, TP and NH3–N acted together on the eDNA distribution in sediment, while heavy-metal elements influenced the community in a similar way (Fig. 7b, Table S3). VPA was further utilized to quantify the contribution of the factors significant to variation in fish assemblage. The findings indicate that for water, temperature influenced 7 % of variations in fish assemblage composition, and the remaining environmental variables influenced 1 %. A total of 92 % of the changes in community migration were unresponsive to the explanation of the water environmental variables. For lake sediment, TP and NH3–N influenced 20 % of variations, and the remaining environmental variables influenced 4 %, while 79 % of the change was not explained (Fig. S3).

Figure 4NMDS analysis of the river water eDNA, lake water eDNA, lake sediment eDNA, and traditional methods.
4.1 Complementarity of eDNA and inference of sources of error
eDNA metabarcoding detected 16 species belonging to 6 families and 3 orders that were also caught by traditional methods, along with an additional 13 species from 7 families and 3 orders (Table S1). Studies have demonstrated that eDNA metabarcoding can detect a great number of fish species compared to traditional methods like bottom trawling, underwater visual censuses, and backpacking electric fishing (McColl-Gausden et al., 2021; Valdivia-Carrillo et al., 2021; Zou et al., 2020). However, three species captured by traditional methods were not detected by eDNA in the whole basin, and more than half of the species in traditional methods were not detected at five fishing sites.
One possible reason for the low overlap could be the limitation of primers – the 12S barcode may not be able to distinguish some closely related species (Valdivia-Carrillo et al., 2021; Jerde et al., 2019). While MiFish-U demonstrates higher discriminatory power for species, genera, and families, it may underperform in recovering species richness. Additionally, primer amplification bias contributes significantly to the taxonomic bias in eDNA detection (Polanco et al., 2021). Furthermore, amplification efficiency varies among species, and certain species preferences differ in various fish assemblages due to primer bias (Shu et al., 2021). The lack of comparison in local databases is another contributing factor. The incomplete reference database significantly restricts the taxonomic identification of species to the available taxa, leading to the identification of species with DNA sequence deletions at higher taxonomic levels (Brown et al., 2015).
Although there is only partial taxonomic overlap among the resulting datasets, multiple datasets provide complementary views of an integrative system. To maximize the detection capabilities of eDNA methods, it is imperative to enhance the taxonomic coverage of reference databases, determine the threshold at which specific primers can fully reflect actual species in local studies through comparisons with traditional methods (Brown et al., 2015), and use alternative barcodes for the same taxa to improve taxonomic accuracy.
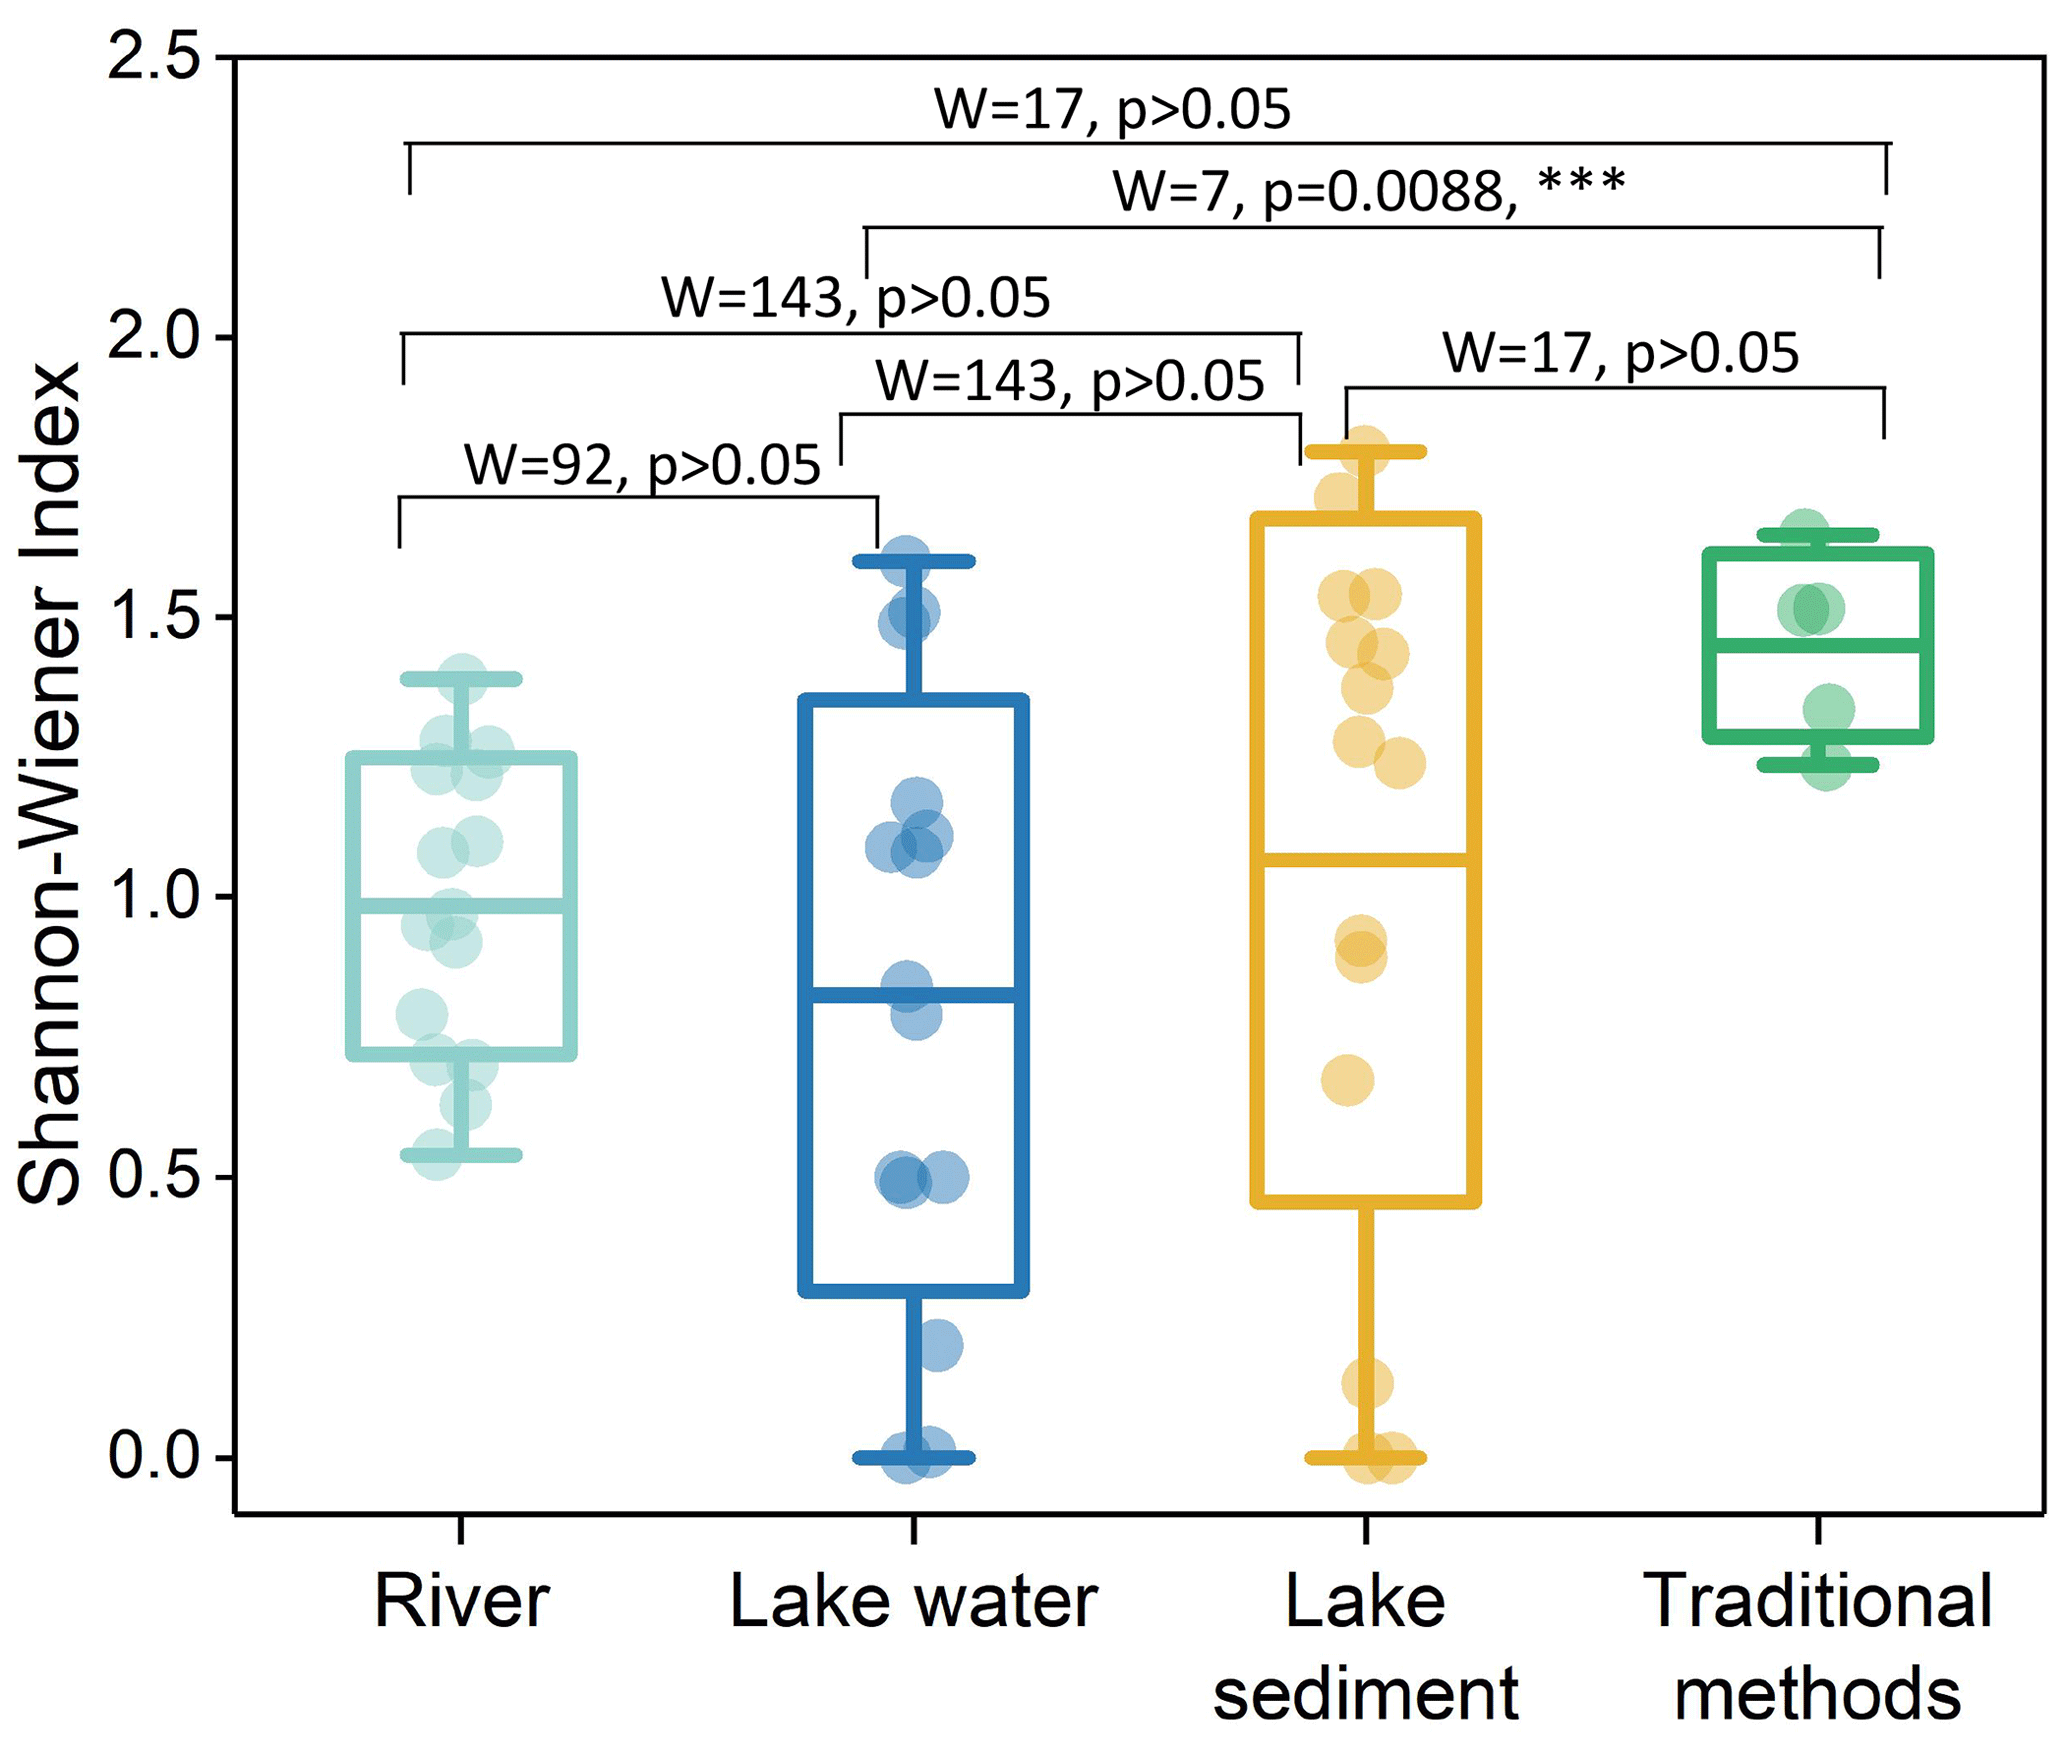
Figure 5Comparison of α diversity in lake and river water. The blue and green dots represent individual data points of lake and river water samples, respectively, and the horizontal line in the middle represents the median. The results of the Wilcoxon rank sum test are shown at the top.
4.2 Effects of media on eDNA investigation of fish assemblages
Each lake site has a varying number of species that can be detected in the two media, and neither of the media exhibits any clear advantages across all sites, highlighting the limitations of relying on a single medium for eDNA fish surveys. Surface sediments have long been thought to have a stronger eDNA preservation capacity than the aqueous phase; for example, the eDNA of Cyprinus carpio can be concentrated 8–1800 times more in sediment than in water and can be preserved in sediments for up to 132 d (Turner et al., 2015). However, the eDNA of Grandidierella japonica has a comparable half-life in both surface sediments and water, lasting from a few days to a few weeks (Wei et al., 2018). Additionally, the eDNA of the great crested newt showed a higher site occupancy in the water phase (Buxton et al., 2018). It seems that the existence time of eDNA varies by species. But as a whole, sediment contains more species information. Among the 15 lake sites, 9 species can only be found in sediment, 6 of which are benthic fish. The number of species that were only detected in sediment was also slightly higher than in water at the five fishing sites. The findings may be specifically relevant to the relatively small spatial scales and lentic ecosystems, but a study in large rivers has shown that the detection rate of fish in different media is almost unaffected by habitat preference (Shaw et al., 2016), which may be attributed to the resuspension and horizontal migration of sediments under strong hydrodynamic conditions (Turner et al., 2015; Wotton and Malmqvist, 2001). In summary, although species, habitat preference, and hydrodynamic dynamics will all influence the survey results of both media, these errors seem to be negligible (Sales et al., 2021).
4.3 Fish assemblage structure reflects the connectivity of the river–lake system
Rivers and lakes differ in various aspects, such as hydrology, habitat, and water quality, leading to differences in assemblage between them (Vitule et al., 2012). However, when the river–lake system has a long connection time, the water volume of the linked river is relatively stable, the water state will be more similar, and the composition of the aquatic community will tend to be consistent (Lesack and Marsh, 2010). The loss of the river–lake connectivity can lead to uneven extinctions of fish, especially rare orders and families, further reducing the diversity of fish assemblages (Li et al., 2024). Contrarily, isolated or fragmented ecosystems often lead to regional differentiation due to increased habitat heterogeneity and environmental gradients, and β diversity will increase (Jiang et al., 2021; Zhang et al., 2019). The high similarity of river–lake communities in this study suggests that there is good river–lake connectivity between Baiyang Lake and inflow rivers. Although Baiyang Lake has been cut off due to drying up many times since 1960, the government has replenished the ecological water more than 50 times since 1980 (Li et al., 2021). Our research reflects the effectiveness of ecological water replenishment measures to some extent.

Figure 6Fits of the neutral community model (NCM) with the community assembly. Fit of the neutral community model of community assembly based on data from (a) lake water, (b) lake sediment, (c) lake water, and (d) river water. The solid blue lines represent the best fit of the model, the dashed blue lines represent the 95 % confidence interval around the model prediction, species that occur within the predicted range are shown in black, and species that occur more or less than predicted are shown in blue or red. R2 represents the fit degree of the model, and Nm represents the product of community size and migration times.
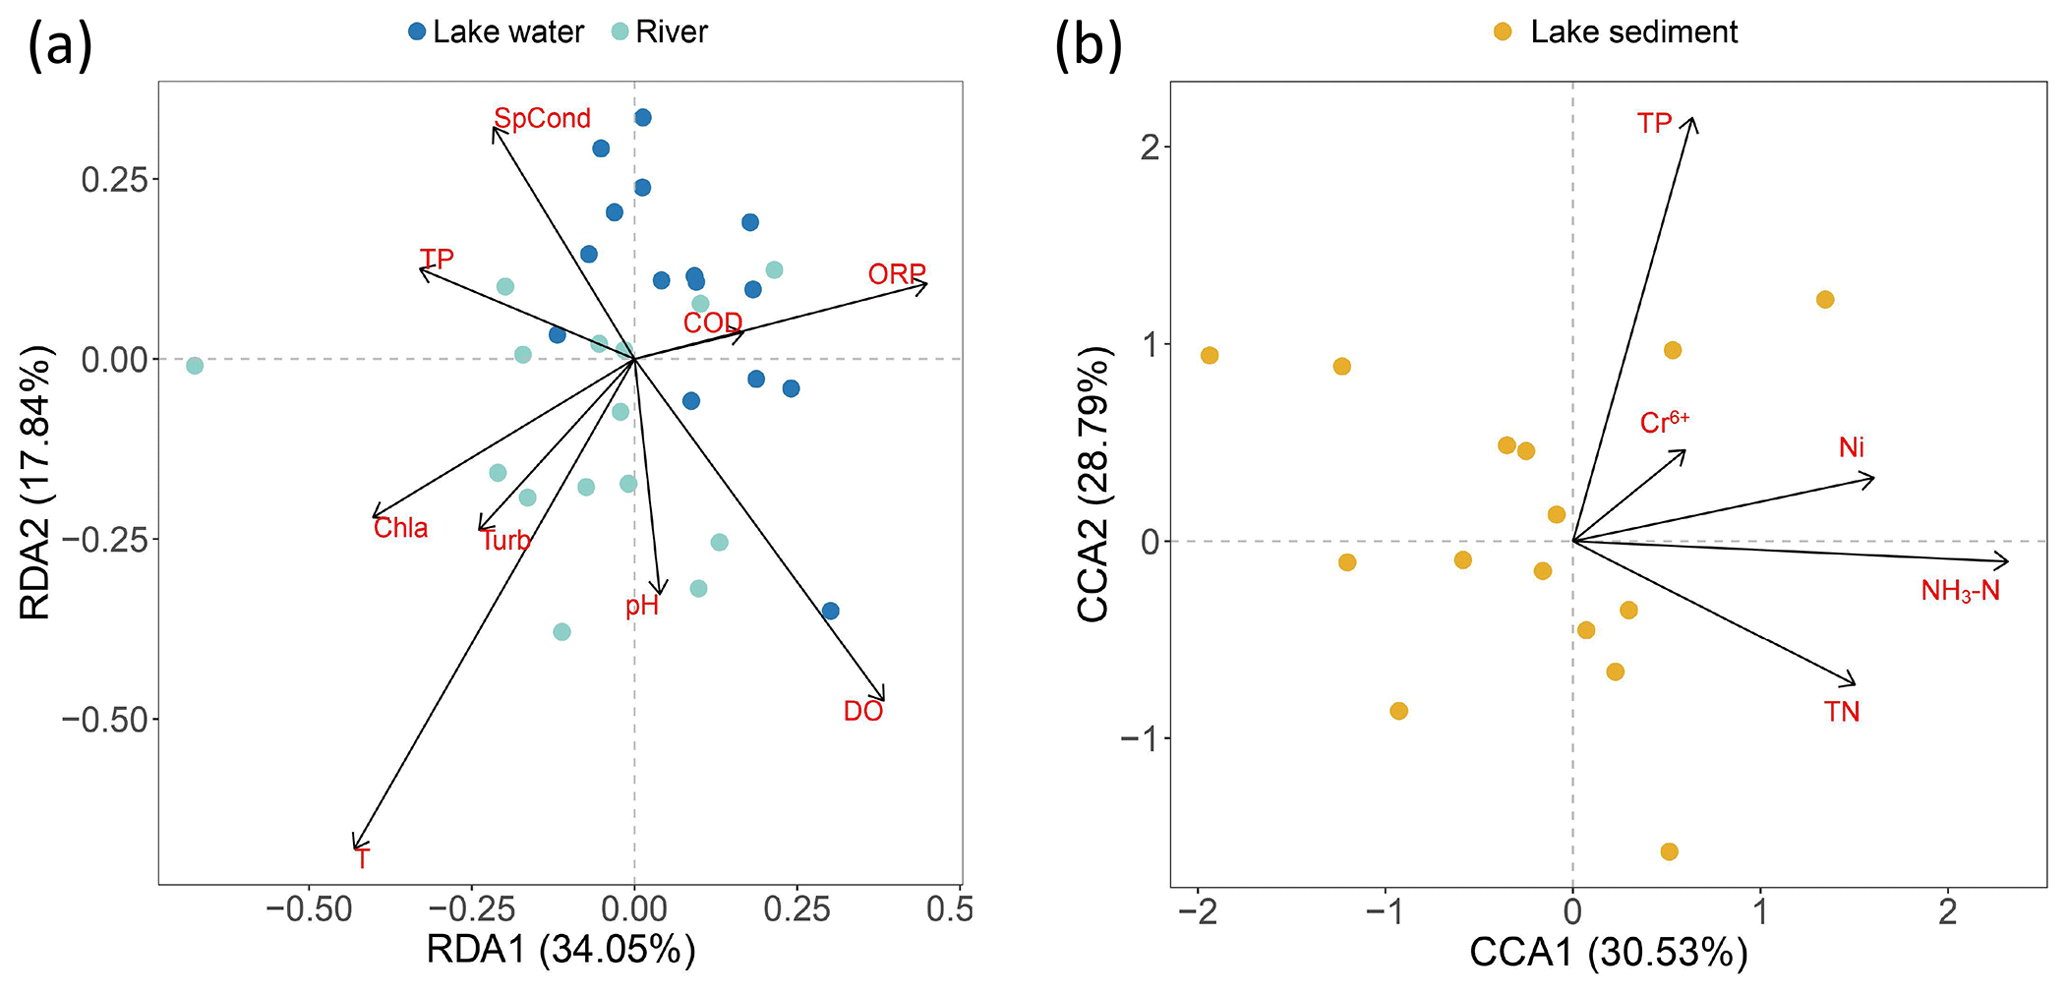
Figure 7Redundancy analysis (RDA) among the species and environmental factors in (a) river and lake water and (b) lake sediment.
4.4 Community assembly patterns reflected by eDNA in different media
The neutral community model makes predictions based on the different capacities for the dispersion of species within a community. The points above the curve represent species that are found more frequently than expected, indicating that they have stronger migration ability and can disperse to more locations, and the points below the curve represent species that are found less than expected, which indicates that they have low dispersion capacity (Chen et al., 2019). In this study, species data obtained by the two media performed very differently in their fits with the neutral community model. The fitting degree of the sediment samples performed a strong, dominant role in the neutral process; however, the data obtained from the water samples showed that the deterministic factors had a greater impact on the community (Fig. 6). This difference may be caused by the characteristics of the two media: eDNA can form sediment rapidly in shallow lakes, and the combination of eDNA with minerals and insoluble organic particles in sediments provides a more stable preservation environment, making the results reflected by surface sediments more steady (Kuwae et al., 2020; Shaw et al., 2016; Turner et al., 2015). In addition, eDNA in water may be greatly affected by hydrological factors such as velocity and flow rate and environmental factors such as temperature and pH (Stewart, 2019; Wang et al., 2021), which increased the uncertainty in water eDNA. However, the combination of lake water and sediment eDNA did not fit the NCM, which is different from the results when each medium is considered alone, suggesting that simply combining data from both media is not a straightforward approach for analyzing the mechanisms of lake community assembly.
The RDA analysis of water indicates that temperature had a significant effect on fish assemblages. Numerous studies indicate water temperature could influence the metabolism, growth, physiology, and immune function of fish and increase the excretion of genetic material (Engelsma et al., 2003; Selong et al., 2001; Takahara et al., 2012). Additionally, fish mobility may increase with water temperature, and genetic signals may also be more homogenized accordingly (Stewart, 2019). The VPA analysis reveals environmental factors just have a minor impact on the fish assemblages (Figs. 7 and S3, Table S3). Regarding the dispersion degree represented by Nm, sediment samples exhibit lower values compared to traditional methods. This confirms the durability of eDNA in sediment locations. However, this stability may lead to an underestimation of mobility when using sediment eDNA for community assembly correlation analysis. The migration degree of fish reflected by river eDNA is higher than that of lake fish reflected by traditional surveys, which could be attributed to the migration of eDNA driven by strong hydrodynamic forces in rivers (Díaz et al., 2020). However, since NCM has always been applied to predict with a massive amount of data, an insufficient amount of fish data may cause the indeterminacy of the result. Additionally, the technical defects of eDNA, like amplify bias and cross-contamination, mean that eDNA abundance is not always a good proxy for species abundance, and the fish assemblage assembly mechanisms still need more research to be verified.
In this study, traditional investigation and eDNA detection of fish in surface sediments and water in a complex river–lake system were combined to reveal the structure, pattern, and assembly mechanism of fish assemblages in the river–lake system, and the results in two environmental media were compared. The results show that (i) fish assemblages in complex river–lake systems can be highly homogeneous. (ii) There is no significant difference in the fish assemblage composition reflected by water and sediment eDNA; however, eDNA investigations using only water samples may miss important benthic fish, so it is recommended to combine both media in investigations focusing on the specific species. (iii) When depending on the neutral community model to analyze community assembly mechanisms, lake sediment eDNA reflected that the fish assemblages are primarily influenced by stochastic processes (50.2 %), while the river and lake water eDNA indicated fish assemblages are predominantly shaped by deterministic processes. (iv) Upon exploring deterministic factors, water environmental factors accounted for only 8 % of the variance, suggesting that hydrological factors like velocity, discharge, and water level may exert a strong influence on water eDNA. In contrast, sediment environmental factors explained 21 % of the variance, with TP and NH3–N identified as the primary factors influencing the sediment eDNA. Although the NCM successfully predicted the fish assemblage distribution, it is difficult to infer the large proportion of unexplained variance revealed by VPA. To fully understand the fish community assembly mechanisms, it is suggested that future research considers the sampling-scale effects (spatial extent and timescale) and, more importantly, explanatory deterministic factors (e.g., hydrographic factors and species interactions).
The data that support the findings of this study are openly available at https://doi.org/10.5281/zenodo.12635220 (Yun, 2024).
The data presented in the study are deposited in the National Center for Biotechnology Information Sequence Read Archive repository, accession number PRJNA1130159.
The supplement related to this article is available online at: https://doi.org/10.5194/we-24-59-2024-supplement.
YS led the writing with significant discussions and contributions from all authors. SW designed the concept and led the sampling. PW and SM collected samples, and MQ curated data. AL plotted the sample point figure. ZY was responsible for supervision, project administration, and funding acquisition, and MF was in charge of writing (reviewing and editing).
The contact author has declared that none of the authors has any competing interests.
Publisher’s note: Copernicus Publications remains neutral with regard to jurisdictional claims made in the text, published maps, institutional affiliations, or any other geographical representation in this paper. While Copernicus Publications makes every effort to include appropriate place names, the final responsibility lies with the authors.
We thank the associate editor and the reviewers for their useful feedback that improved this paper.
This research has been supported by the Southern Marine Science and Engineering Guangdong Laboratory (Zhuhai) (grant no. SML2023SP238) and the Key Technologies Research and Development Program of China (grant nos. 2022YFC2601301 and 2021YFC3201005).
This paper was edited by Sergio Navarrete and reviewed by two anonymous referees.
Banerjee, P., Stewart, K., Dey, G., Antognazza, C., Sharma, R., Maity, J., Saha, S., Doi, H., de Vere, N., Chan, M., Lin, P.-Y., Chao, H.-C., and Chen, chien-yen: Environmental DNA analysis as an emerging non-destructive method for plant biodiversity monitoring: a review, AoB PLANTS, 14, plac031, https://doi.org/10.1093/aobpla/plac031, 2022a.
Banerjee, P., Stewart, K. A., Dey, G., Sharma, R. K., Maity, J. P., Chan, M. W. Y., Chang, K. P., Chen, T.-H., Hsu, C.-T., and Chen, C.-Y.: When conventional methods fall short: identification of invasive cryptic Golden Apple Snails (Pomacea canaliculata; P. maculata) using environmental DNA, Hydrobiologia, 849, 4241–4257, https://doi.org/10.1007/s10750-022-04979-6, 2022b.
Brown, E. A., Chain, F. J. J., Crease, T. J., MacIsaac, H. J., and Cristescu, M. E.: Divergence thresholds and divergent biodiversity estimates: can metabarcoding reliably describe zooplankton communities?, Ecol. Evol., 5, 2234–2251, https://doi.org/10.1002/ece3.1485, 2015.
Buxton, A. S., Groombridge, J. J., and Griffiths, R. A.: Seasonal variation in environmental DNA detection in sediment and water samples, PLOS ONE, 13, e0191737, https://doi.org/10.1371/journal.pone.0191737, 2018.
Chase, J. M. and Myers, J. A.: Disentangling the importance of ecological niches from stochastic processes across scales, Phil. Trans. R. Soc. B, 366, 2351–2363, https://doi.org/10.1098/rstb.2011.0063, 2011.
Chen, H., Li, Y., Sun, W., Song, L., Zuo, R., and Teng, Y.: Characterization and source identification of antibiotic resistance genes in the sediments of an interconnected river-lake system, Environ. Int., 137, 105538, https://doi.org/10.1016/j.envint.2020.105538, 2020.
Chen, J., Wang, S., Yan, Z., Zhao, X., Feng, M., Wang, J., and Zhou, Q.: eDNA of zooplankton reveals the ecological community thresholds for key environmental factors in the Baiyangdian Lake aquatic ecosystem, Environ. Sci. Europe, 35, 56, https://doi.org/10.1186/s12302-023-00761-0, 2023.
Chen, W., Kexin, R., Isabwe, A., Chen, H., and Liu, M.: Stochastic processes shape microeukaryotic community assembly in a subtropical river across wet and dry seasons, Microbiome, 7, 138, https://doi.org/10.1186/s40168-019-0749-8, 2019.
Chesson, P.: Mechanisms of Maintenance of Species Diversity, Annu. Rev. Ecol., Evolut. Syst., 31, 343–366, https://doi.org/10.1146/annurev.ecolsys.31.1.343, 2000.
Comita, L. S., Condit, R., and Hubbell, S. P.: Developmental changes in habitat associations of tropical trees, J. Ecol., 95, 482–492, https://doi.org/10.1111/j.1365-2745.2007.01229.x, 2007.
de Bello, F., Price, J. N., Münkemüller, T., Liira, J., Zobel, M., Thuiller, W., Gerhold, P., Götzenberger, L., Lavergne, S., Lepš, J., Zobel, K., and Pärtel, M.: Functional species pool framework to test for biotic effects on community assembly, Ecology, 93, 2263–2273, https://doi.org/10.1890/11-1394.1, 2012.
Díaz, C., Wege, F.-F., Tang, C. Q., Crampton-Platt, A., Rüdel, H., Eilebrecht, E., and Koschorreck, J.: Aquatic suspended particulate matter as source of eDNA for fish metabarcoding, Sci. Rep., 10, 14352, https://doi.org/10.1038/s41598-020-71238-w, 2020.
Engelsma, M. Y., Hougee, S., Nap, D., Hofenk, M., Rombout, J. H. W. M., van Muiswinkel, W. B., and Lidy Verburg-van Kemenade, B. M.: Multiple acute temperature stress affects leucocyte populations and antibody responses in common carp, Cyprinus carpio L., Fish Shellfish Immunol., 15, 397–410, https://doi.org/10.1016/S1050-4648(03)00006-8, 2003.
Gravel, D., Canham, C. D., Beaudet, M., and Messier, C.: Reconciling niche and neutrality: the continuum hypothesis, Ecol. Lett., 9, 399–409, https://doi.org/10.1111/j.1461-0248.2006.00884.x, 2006.
Guo, C., Chen, Y., Gozlan, R. E., Li, Z., Mehner, T., Lek, S., and Paukert, C. P.: Biogeographic freshwater fish pattern legacy revealed despite rapid socio-economic changes in China, Fish Fish, 20, 857–869, https://doi.org/10.1111/faf.12380, 2019.
Haakonsson, S., Rodríguez-Gallego, L., Somma, A., and Bonilla, S.: Temperature and precipitation shape the distribution of harmful cyanobacteria in subtropical lotic and lentic ecosystems, Sci. Total Environ., 609, 1132–1139, https://doi.org/10.1016/j.scitotenv.2017.07.067, 2017.
Hänfling, B., Lawson Handley, L., Read, D. S., Hahn, C., Li, J., Nichols, P., Blackman, R. C., Oliver, A., and Winfield, I. J.: Environmental DNA metabarcoding of lake fish communities reflects long-term data from established survey methods, Molecular Ecol., 25, 3101–3119, https://doi.org/10.1111/mec.13660, 2016.
Harvey, H. H.: Fish populations in a large group of acid-stressed lakes, Verh.-Int. Ver. Theor. Angew. Limnol. (Germany, Federal Republic of), 19, 1975.
Hiddink, J. G., Johnson, A. F., Kingham, R., and Hinz, H.: Could our fisheries be more productive? Indirect negative effects of bottom trawl fisheries on fish condition, J. Appl. Ecol., 48, 1441–1449, https://doi.org/10.1111/j.1365-2664.2011.02036.x, 2011.
Hubbell, S. P.: The Unified Neutral Theory of Biodiversity and Biogeography (MPB-32), Princeton University Press, Princeton, https://doi.org/10.1515/9781400837526, 2001.
Isabwe, A., Yao, H., Zhang, S., Jiang, Y., Breed, M. F., and Sun, X.: Spatial assortment of soil organisms supports the size-plasticity hypothesis, ISME COMMUN., 2, 102, https://doi.org/10.1038/s43705-022-00185-6, 2022
Jackson, D. A., Peres-Neto, P. R., and Olden, J. D.: What controls who is where in freshwater fish communities – the roles of biotic, abiotic, and spatial factors, Can. J. Fish. Aquat. Sci., 58, 157–170, https://doi.org/10.1139/f00-239, 2001.
Jerde, C. L., Wilson, E. A., and Dressler, T. L.: Measuring global fish species richness with eDNA metabarcoding, Molecular Ecol. Resour., 19, 19–22, https://doi.org/10.1111/1755-0998.12929, 2019.
Jia, Y., Jiang, Y., Liu, Y., Sui, X., Feng, X., Zhu, R., Li, K., and Chen, Y.: Unravelling fish community assembly in shallow lakes: Insights from functional and phylogenetic diversity, Rev. Fish Biol. Fisheries, 32, 623–644, https://doi.org/10.1007/s11160-021-09688-2, 2022.
Jiang, P., Zhang, S., Xu, S., Xiong, P., Cao, Y., Chen, Z., and Li, M.: Comparison of environmental DNA metabarcoding and bottom trawling for detecting seasonal fish communities and habitat preference in a highly disturbed estuary, Ecol. Indicators, 146, 109754, https://doi.org/10.1016/j.ecolind.2022.109754, 2023.
Jiang, X., Zheng, P., Cao, L., and Pan, B.: Effects of long-term floodplain disconnection on multiple facets of lake fish biodiversity: Decline of alpha diversity leads to a regional differentiation through time, Sci. Total Environ., 763, 144177, https://doi.org/10.1016/j.scitotenv.2020.144177, 2021.
Jones, A. E., Hodges, B. R., McClelland, J. W., Hardison, A. K., and Moffett, K. B.: Residence-time-based classification of surface water systems, Water Resour. Res., 53, 5567–5584, https://doi.org/10.1002/2016WR019928, 2017.
Kuwae, M., Tamai, H., Doi, H., Sakata, M. K., Minamoto, T., and Suzuki, Y.: Sedimentary DNA tracks decadal-centennial changes in fish abundance, Commun. Biol., 3, 558, https://doi.org/10.1038/s42003-020-01282-9, 2020.
Lesack, L. F. W. and Marsh, P.: River-to-lake connectivities, water renewal, and aquatic habitat diversity in the Mackenzie River Delta: RIVER-TO-LAKE WATER CONNECTIVITIES, Water Resour. Res., 46, https://doi.org/10.1029/2010WR009607, 2010.
Li, A., Fan, J., Guo, F., Carpenter-Bundhoo, L., Huang, G., Shi, Y., Ao, Y., and Wang, J.: Assessing the impact of river connectivity on fish biodiversity in the Yangtze River Basin using a multi-index evaluation framework, Environ. Res., 242, 117729, https://doi.org/10.1016/j.envres.2023.117729, 2024.
Li, D., He, P., Liu, C., Wang, J., Zhang, Y., Ren, Y., and Wang, D.: Evaluation of eutrophication level changes in Baiyangdian Lake based on multiple biological groups, Ying yong sheng tai xue bao, The J. Appl. Ecol., 32, 4488–4498, https://doi.org/10.13287/j.1001-9332.202112.027, 2021.
Li, J., Hatton-Ellis, T. W., Lawson Handley, L., Kimbell, H. S., Benucci, M., Peirson, G., and Hänfling, B.: Ground-truthing of a fish-based environmental DNA metabarcoding method for assessing the quality of lakes, J. Appl. Ecol., 56, 1232–1244, https://doi.org/10.1111/1365-2664.13352, 2019.
Lu, Q., Zhang, S.-Y., Du, J., Liu, Q., Dong, C., Zhao, J., Wang, Y., and Yao, M.: Multi-group biodiversity distributions and drivers of metacommunity organization along a glacial–fluvial–limnic pathway on the Tibetan plateau, Environ. Res., 220, 115236, https://doi.org/10.1016/j.envres.2023.115236, 2023.
Magnuson, J., Crowder, L., and MEDVICK, P.: Temperature as an Ecological Resource, Integr. Comp. Biol., 19, 331–343, https://doi.org/10.1093/icb/19.1.331, 1979.
Magoč, T. and Salzberg, S. L.: FLASH: fast length adjustment of short reads to improve genome assemblies, Bioinformatics, 27, 2957–2963, https://doi.org/10.1093/bioinformatics/btr507, 2011.
Manel, S., Guerin, P.-E., Mouillot, D., Blanchet, S., Velez, L., Albouy, C., and Pellissier, L.: Global determinants of freshwater and marine fish genetic diversity, Nat. Commun., 11, 692, https://doi.org/10.1038/s41467-020-14409-7, 2020.
Marques, V., Castagné, P., Polanco, A., Borrero-Pérez, G. H., Hocdé, R., Guérin, P., Juhel, J., Velez, L., Loiseau, N., Letessier, T. B., Bessudo, S., Valentini, A., Dejean, T., Mouillot, D., Pellissier, L., and Villéger, S.: Use of environmental DNA in assessment of fish functional and phylogenetic diversity, Conserv. Biol., 35, 1944–1956, https://doi.org/10.1111/cobi.13802, 2021.
McColl-Gausden, E. F., Weeks, A. R., Coleman, R. A., Robinson, K. L., Song, S., Raadik, T. A., and Tingley, R.: Multispecies models reveal that eDNA metabarcoding is more sensitive than backpack electrofishing for conducting fish surveys in freshwater streams, Molecular Ecol., 30, 3111–3126, https://doi.org/10.1111/mec.15644, 2021.
Mitchell, E. G., Harris, S., Kenchington, C. G., Vixseboxse, P., Roberts, L., Clark, C., Dennis, A., Liu, A. G., and Wilby, P. R.: The importance of neutral over niche processes in structuring Ediacaran early animal communities, Ecol. Lett., 22, 2028–2038, https://doi.org/10.1111/ele.13383, 2019.
Miya, M., Sato, Y., Fukunaga, T., Sado, T., Poulsen, J. Y., Sato, K., Minamoto, T., Yamamoto, S., Yamanaka, H., Araki, H., Kondoh, M., and Iwasaki, W.: MiFish, a set of universal PCR primers for metabarcoding environmental DNA from fishes: detection of more than 230 subtropical marine species, R. Soc. Open sci., 2, 150088, https://doi.org/10.1098/rsos.150088, 2015.
Öğlü, B., Bhele, U., Järvalt, A., Tuvikene, L., Timm, H., Seller, S., Haberman, J., Agasild, H., Nõges, P., Silm, M., Bernotas, P., Nõges, T., and Cremona, F.: Is fish biomass controlled by abiotic or biotic factors? Results of long-term monitoring in a large eutrophic lake, J. Great Lakes Res., 46, 881–890, https://doi.org/10.1016/j.jglr.2019.08.004, 2020.
Oka, S., Doi, H., Miyamoto, K., Hanahara, N., Sado, T., and Miya, M.: Environmental DNA metabarcoding for biodiversity monitoring of a highly diverse tropical fish community in a coral reef lagoon: Estimation of species richness and detection of habitat segregation, Environ. DNA, 3, 55–69, https://doi.org/10.1002/edn3.132, 2021.
Poikane, S., Ritterbusch, D., Argillier, C., Białokoz, W., Blabolil, P., Breine, J., Jaarsma, N. G., Krause, T., Kubečka, J., Lauridsen, T. L., Nõges, P., Peirson, G., and Virbickas, T.: Response of fish communities to multiple pressures: Development of a total anthropogenic pressure intensity index, Sci. Total Environ., 586, 502–511, https://doi.org/10.1016/j.scitotenv.2017.01.211, 2017.
Polanco F., A., Richards, E., Flück, B., Valentini, A., Altermatt, F., Brosse, S., Walser, J.-C., Eme, D., Marques, V., Manel, S., Albouy, C., Dejean, T., and Pellissier, L.: Comparing the performance of 12S mitochondrial primers for fish environmental DNA across ecosystems, Environ. DNA, 3, 1113–1127, https://doi.org/10.1002/edn3.232, 2021.
Qian, M.-M., Wang, Z.-Y., Zhou, Q., Wang, J., Shao, Y., Qiao, Q., Fan, J.-T., and Yan, Z.-G.: Environmental DNA unveiling the fish community structure and diversity features in the Yangtze River basin, Environ. Res., 239, 117198, https://doi.org/10.1016/j.envres.2023.117198, 2023.
Ritterbusch, D., Blabolil, P., Breine, J., Erős, T., Mehner, T., Olin, M., Peirson, G., Volta, P., and Poikane, S.: European fish-based assessment reveals high diversity of systems for determining ecological status of lakes, Sci. Total Environ., 802, 149620, https://doi.org/10.1016/j.scitotenv.2021.149620, 2022.
Roff, G., Bejarano, S., Priest, M., Marshell, A., Chollett, I., Steneck, R. S., Doropoulos, C., Golbuu, Y., and Mumby, P. J.: Seascapes as drivers of herbivore assemblages in coral reef ecosystems, Ecol. Monogr., 89, e01336, https://doi.org/10.1002/ecm.1336, 2019.
Rognes, T., Flouri, T., Nichols, B., Quince, C., and Mahé, F.: VSEARCH: a versatile open source tool for metagenomics, PeerJ, 4, e2584, https://doi.org/10.7717/peerj.2584, 2016.
Saenz-Agudelo, P., Ramirez, P., Beldade, R., Campoy, A. N., Garmendia, V., Search, F. V., Fernández, M., Wieters, E. A., Navarrete, S. A., Landaeta, M. F., and Pérez-Matus, A.: Environmental DNA reveals temporal variation in mesophotic reefs of the Humboldt upwelling ecosystems of central Chile: Toward a baseline for biodiversity monitoring of unexplored marine habitats, Ecol. Evolut., 14, e10999, https://doi.org/10.1002/ece3.10999, 2024.
Sales, N. G., Wangensteen, O. S., Carvalho, D. C., Deiner, K., Præbel, K., Coscia, I., McDevitt, A. D., and Mariani, S.: Space-time dynamics in monitoring neotropical fish communities using eDNA metabarcoding, Sci. Total Environ., 754, 142096, https://doi.org/10.1016/j.scitotenv.2020.142096, 2021.
Selong, J. H., McMahon, T. E., Zale, A. V., and Barrows, F. T.: Effect of Temperature on Growth and Survival of Bull Trout, with Application of an Improved Method for Determining Thermal Tolerance in Fishes, Trans. Am. Fisher. Soc., 130, 1026–1037, https://doi.org/10.1577/1548-8659(2001)130<1026:EOTOGA>2.0.CO;2, 2001.
Shaw, J. L. A., Clarke, L. J., Wedderburn, S. D., Barnes, T. C., Weyrich, L. S., and Cooper, A.: Comparison of environmental DNA metabarcoding and conventional fish survey methods in a river system, Biol. Conserv., 197, 131–138, https://doi.org/10.1016/j.biocon.2016.03.010, 2016.
Shinen, J. L. and Navarrete, S. A.: Lottery Coexistence on Rocky Shores: Weak Niche Differentiation or Equal Competitors Engaged in Neutral Dynamics?, The Am. Natural., 183, 342–362, https://doi.org/10.1086/674898, 2014.
Shu, L., Ludwig, A., and Peng, Z.: Environmental DNA metabarcoding primers for freshwater fish detection and quantification: In silico and in tanks, Ecol. Evolut., 11, 8281–8294, https://doi.org/10.1002/ece3.7658, 2021.
Siepielski, A. M. and McPeek, M. A.: On the evidence for species coexistence: a critique of the coexistence program, Ecology, 91, 3153–3164, https://doi.org/10.1890/10-0154.1, 2010.
Sloan, W. T., Lunn, M., Woodcock, S., Head, I. M., Nee, S., and Curtis, T. P.: Quantifying the roles of immigration and chance in shaping prokaryote community structure, Environ. Microbiol., 8, 732–740, https://doi.org/10.1111/j.1462-2920.2005.00956.x, 2006.
Sogn-Grundvåg, G., Zhang, D., Henriksen, E., Joensen, S., Bendiksen, B.-I., and Hermansen, Ø.: Fishing tactics and fish quality: The case of the coastal fishery for Atlantic cod in Norway, Fisheries Res., 246, 106167, https://doi.org/10.1016/j.fishres.2021.106167, 2022.
Stewart, K. A.: Understanding the effects of biotic and abiotic factors on sources of aquatic environmental DNA, Biodivers. Conserv., 28, 983–1001, https://doi.org/10.1007/s10531-019-01709-8, 2019.
Su, G., Logez, M., Xu, J., Tao, S., Villéger, S., and Brosse, S.: Human impacts on global freshwater fish biodiversity, Science, 371, 835–838, https://doi.org/10.1126/science.abd3369, 2021.
Sullivan, C. J., Coulter, D. P., Feiner, Z. S., Donabauer, S. B., and Höök, T. O.: Influences of gear type and analytical methodology on fish assemblage characterisations in temperate lakes, Fisheries Manage. Eco., 22, 388–399, https://doi.org/10.1111/fme.12138, 2015.
Taberlet, P., Coissac, E., Hajibabaei, M., and Rieseberg, L. H.: Environmental DNA: ENVIRONMENTAL DNA, Molecular Ecol., 21, 1789–1793, https://doi.org/10.1111/j.1365-294X.2012.05542.x, 2012.
Takahara, T., Minamoto, T., Yamanaka, H., Doi, H., and Kawabata, Z.: Estimation of Fish Biomass Using Environmental DNA, PLOS ONE, 7, e35868, https://doi.org/10.1371/journal.pone.0035868, 2012.
Thomas, P., Gulland, F., Reeves, R., Kreb, D., Ding, W., Smith, B., Malik, M., Ryan, G., and Phay, S.: A review of electrofishing as a potential threat to freshwater cetaceans, Endanger. Species Res., 39, 207–220, https://doi.org/10.3354/esr00962, 2019.
Turner, C. R., Uy, K. L., and Everhart, R. C.: Fish environmental DNA is more concentrated in aquatic sediments than surface water, Biol. Conserv., 183, 93–102, https://doi.org/10.1016/j.biocon.2014.11.017, 2015.
Valdivia-Carrillo, T., Rocha-Olivares, A., Reyes-Bonilla, H., Domínguez-Contreras, J. F., and Munguia-Vega, A.: Integrating eDNA metabarcoding and simultaneous underwater visual surveys to describe complex fish communities in a marine biodiversity hotspot, Mol. Ecol. Resour., 21, 1558–1574, https://doi.org/10.1111/1755-0998.13375, 2021.
Vitule, J. R. S., Skóra, F., and Abilhoa, V.: Homogenization of freshwater fish faunas after the elimination of a natural barrier by a dam in Neotropics: Biotic homogenization in Neotropics, Divers. Distrib., 18, 111–120, https://doi.org/10.1111/j.1472-4642.2011.00821.x, 2012.
Wang, S., Yan, Z., Hänfling, B., Zheng, X., Wang, P., Fan, J., and Li, J.: Methodology of fish eDNA and its applications in ecology and environment, Sci. Total Environ., 755, 142622, https://doi.org/10.1016/j.scitotenv.2020.142622, 2021.
Wei, N., Nakajima, F., and Tobino, T.: A Microcosm Study of Surface Sediment Environmental DNA: Decay Observation, Abundance Estimation, and Fragment Length Comparison, Environ. Sci. Technol., 52, 12428–12435, https://doi.org/10.1021/acs.est.8b04956, 2018.
Wikramanayake, E. D.: Ecomorphology and Biogeography of a Tropical Stream Fish Assemblage: Evolution of Assemblage Structure, Ecology, 71, 1756–1764, https://doi.org/10.2307/1937583, 1990.
Wotton, R. S. and Malmqvist, B.: Feces in Aquatic Ecosystems, BioScience, 51, 537, https://doi.org/10.1641/0006-3568(2001)051[0537:FIAE]2.0.CO;2, 2001.
Yan, Z.-G., Zhu, X.-M., Zhang, S.-W., Jiang, H., Wang, S.-P., Wei, C., Wang, J., Shao, Y., Liu, C., and Wang, H.: Environmental DNA sequencing reveals the regional difference in diversity and community assembly mechanisms of eukaryotic plankton in coastal waters, Front. Microbiol., 14, 1132925, https://doi.org/10.3389/fmicb.2023.1132925, 2023.
Yu, J., Zhen, W., Kong, L., He, H., Zhang, Y., Yang, X., Chen, F., Zhang, M., Liu, Z., and Jeppesen, E.: Changes in Pelagic Fish Community Composition, Abundance, and Biomass along a Productivity Gradient in Subtropical Lakes, Water, 13, 858, https://doi.org/10.3390/w13060858, 2021.
Yun, S.: Biodiversity analysis in R, Zenodo [code], https://doi.org/10.5281/zenodo.12635220, 2024.
Zhang, C., Ding, C., Ding, L., Chen, L., Hu, J., Tao, J., and Jiang, X.: Large-scale cascaded dam constructions drive taxonomic and phylogenetic differentiation of fish fauna in the Lancang River, China, Rev. Fish Biol. Fisheries, 29, 895–916, https://doi.org/10.1007/s11160-019-09580-0, 2019.
Zhang, S., Zheng, Y., Zhan, A., Dong, C., Zhao, J., and Yao, M.: Environmental DNA captures native and non-native fish community variations across the lentic and lotic systems of a megacity, Sci. Adv., 8, eabk0097, https://doi.org/10.1126/sciadv.abk0097, 2022.
Zou, K., Chen, J., Ruan, H., Li, Z., Guo, W., Li, M., and Liu, L.: eDNA metabarcoding as a promising conservation tool for monitoring fish diversity in a coastal wetland of the Pearl River Estuary compared to bottom trawling, Sci. Total Environ., 702, 134704, https://doi.org/10.1016/j.scitotenv.2019.134704, 2020.