the Creative Commons Attribution 4.0 License.
the Creative Commons Attribution 4.0 License.
 | 21 Mar 2025
Different pollinator sampling methods measure distinct pollinator communities in a mass-flowering crop, which respond differently to the composition of the surrounding landscape
Maxime Eeraerts
Ivan Meeus
Pollinator insects are essential for the pollination of many crops and wild plants. Recent declines in insect population pose significant challenges for maintaining pollination services. Habitat loss and landscape homogenization are among the primary drivers of these declines. In order to monitor and assess populations of pollinating insects, precise and accurate methods are required. A common method to collect pollinators is pan traps, but this method suffers from a bias due to surrounding flower frequency, yet this remains untested at the large spatial scale such as the landscape. Understanding how different pollinator sampling methods reflect the impact of landscape composition on pollinator communities is critical for designing robust monitoring schemes that can lead to effective conservation strategies. This study investigates how two common pollinator sampling methods – insect nets and pan traps – measure the abundance, diversity, and composition of pollinator communities in sweet-cherry orchards (Prunus avium) in Belgium. The study also examines how pollinator data obtained by these methods relate to the surrounding landscape, specifically the amount of seminatural habitat and intensive fruit cultivation. We conclude that both methods provided similar sampling efficiencies, yet they captured different subsets of the pollinator community. Insect nets caught a higher abundance and species richness of bumblebees, while pan traps caught higher solitary bee abundance, and hoverfly abundance and richness were unaffected. The pollinator data also exhibited different responses to landscape composition as a function of the sampling method. These findings suggest that different sampling methods yield complementary insights into pollinator communities and their interactions with the landscape. Therefore, integrating both methods in future monitoring schemes is recommended to obtain comprehensive data on pollinator diversity and abundance, aiding in the assessment of pollinator population trends and the development of evidence-based conservation strategies.
- Article
(1113 KB) - Full-text XML
-
Supplement
(366 KB) - BibTeX
- EndNote


Animal-pollinated crops, essential for diverse and nutritionally balanced diets, rely on managed bees and wild insects for pollination (Gazzea et al., 2023; Eeraerts et al., 2023a; Osterman et al., 2024). However, recent declines in pollinating species, driven primarily by habitat loss and landscape homogenization, have caused concern about the need to safeguard future pollination services (Carvalheiro et al., 2013; Goulson et al., 2015; Outhwaite et al., 2022). Conserving seminatural habitats (SNHs) is crucial for preserving pollinator populations and ensuring future pollination services (Eeraerts, 2023; Tscharntke et al., 2024). Indeed, SNHs offer essential floral resources and nesting sites, supporting the abundance and diversity of pollinators (Timberlake et al., 2019; Eeraerts and Isaacs, 2023). In contrast, intensive agriculture and landscape homogenization negatively affect these populations, leading to reduced pollination in affected areas (Eeraerts et al., 2017; Grab et al., 2019).
There is an urgent need for systematic, long-term monitoring of pollinating insects to provide robust evidence on their status, identify the causes of their decline, and develop evidence-based conservation measures (Breeze et al., 2021; Potts et al., 2021). This has recently reached fruition in both systematic and long-term pollinator monitoring programs at both national and international scales (IPBES, 2016; Breeze et al., 2021; Departement Omgeving, 2022; Potts et al., 2024). Effective monitoring designs with appropriate sampling methods are crucial, with common methods including sampling by means of netting and sampling using pan traps (Westphal et al., 2008; O'Connor et al., 2019; Portman et al., 2020; Prendergast et al., 2020). For instance, in observational studies on pollination in apple cultivation (the most studied crop; Allen-Perkins et al., 2022), 60.0 % use netting, 33.3 % use pan traps, and 30.0 % use direct observation (Maxime Eeraerts, unpublished data). Netting allows the matching of the pollinators with their floral hosts, and specimens are caught in good condition, but it is labor-intensive and requires a minimum level of expertise (Westphal et al., 2008; O'Connor et al., 2019; Portman et al., 2020; Prendergast et al., 2020). Pan trapping, on the other hand, requires no specific expertise and allows sampling over longer time periods, but results cannot be easily linked to floral abundance, and specimens can degrade over time (Westphal et al., 2008; O'Connor et al., 2019; Portman et al., 2020; Prendergast et al., 2020). A drawback of both methods is their bias: insect nets undersample smaller or faster-flying pollinators, while pan trapping undersamples social bees and pollinators with a greater body size. However, both insect nets and pan trapping can provide accurate species-level identification, as specimens are collected and identified in the lab. Generally, studies comparing insect netting and pan traps conclude that both methods result in compositionally distinct pollinator communities (Westphal et al., 2008; O'Connor et al., 2019; Prendergast et al., 2020; Mudri-Stojnić et al., 2023; Lezzeri et al., 2024). However, the extent to which such methods can effectively detect changes in species population composition and abundance remains unclear, particularly when assessing pollinator responses to changes in landscape composition and/or configuration at the landscape scale.
As mentioned above, collecting pollinators using pan traps suffers from a bias due to the surrounding flower frequency (Portman et al., 2020; Westerberg et al., 2021; Prendergast et al., 2020). Theory predicts that greater food resource diversity and abundance attract more pollinators, leading to higher specimen catches. This pattern often holds when insect nets are used, yet mixed results are obtained for pan traps, whereby fewer pollinators are caught when the pan traps are surrounded by more resources (O'Connor et al., 2019; Portman et al., 2020). Comparing this bias of pan traps between a small (25 m2) and a large spatial scale (2–6 ha), Westerberg et al. (2021) conclude that the bias was higher when considering the large spatial scale compared to the small one. While this bias of pan traps due to flower frequency has often been studied at the small spatial scale, this aspect remains understudied at larger spatial scales such as the landscape scale. Given the importance of the surrounding landscape on pollinator communities, it is important – from both a monitoring and a conservation perspective – to understand if the pollinator data obtained by both methods respond similarly in relation to the surrounding landscape context.
This study examines how pollinator sampling methods measure pollinator community measures such as abundance, diversity, and composition of the pollinator communities in orchards of sweet cherry (Prunus avium) and whether the method results interact with the surrounding landscape. To streamline monitoring protocols, we compare two methods – insect nets and pan traps – each performed for 1 d per study site (see O'Connor et al., 2019). The objective of this study was to investigate the following research questions (RQs).
-
RQ1 – to what extent do different pollinator sampling methods result in different pollinator species richness, abundances, and community compositions?
-
RQ2 – do pollinator richness and abundances sampled with different methods respond differently to the proportion of seminatural habitat and the extent of intensive fruit cultivation in the surrounding landscape?
Addressing both research questions offers the additional advantage of not only comparing the two sampling techniques in terms of their effectiveness in identifying the pollinator community but also evaluating their suitability for hypothesis testing. As we conducted our study in a fruit orchard, a mass-flowering crop, local flower resource supply is high at all study sites. This approach enables us to isolate the effects of landscape-level resource variation on the pollinator communities sampled by both methods, eliminating the potential confounding influence of local resource variation on sampling bias.
2.1 Site selection and landscape setup
This study was carried out in 2016 in 10 sweet-cherry orchards in Flanders, Belgium (see Eeraerts et al., 2019, for detailed methods; Fig. 1). We quantified seminatural habitat (SNH) and intensive fruit cultivation (IFC) in the surrounding 1000 m of landscape of each study orchard (QGIS Development Team, 2012). Based on aerial photographs and land cover maps, we allocated both these land use types in a 1000 m buffer zone around the orchards (De Saegher and Scheers, 2016; see Eeraerts et al., 2019, for detailed landscape design information). Land cover types that were considered SNH were hedgerows, tree rows, hollow roads, shrub vegetation, natural grassland, and forests with clear shrub and/or herb vegetation. The land use that was considered IFC was all intensive apple, cherry, and pear orchards. The gradients of SNH and IFC within a buffer zone of 1000 m ranged from 3.9 % to 29.4 % and from 7.8 % to 22.0 %, respectively. Other land use in these agriculture-dominated landscapes was very heterogeneous (see Eeraerts et al., 2019). The percentages of SNH and IFC within a buffer zone of 250 m around the orchard for each study orchard were also calculated. Whereas the 1000 m range corresponds to the foraging range of bumblebees, the solitary bees that forage on cherry blossoms only fly 50 to 200 m from their nest to collect nectar and pollen once they have started to build a nest, and 250 m was chosen to represent this range (Kendall et al., 2022; Eeraerts, 2023). The gradients of SNH and IFC within a buffer zone of 250 m ranged from 0.4 % to 41.4 % and from 5.8 % to 48.6 %, respectively. Gradients of SNH and IFC were independent of each other at both the 1000 m and the 250 m scale (Kendall rank correlation of and p=0.53 for 1000 m and and p=0.86 for 250 m). The distance between the study orchards ranged from 2.1 to 61 km.
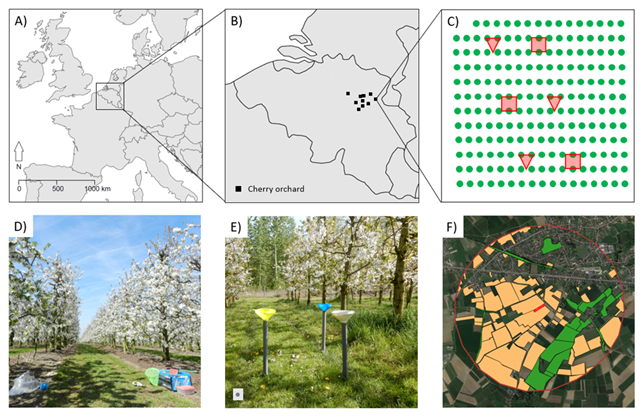
Figure 1Overview figure of the study design with (a) the location of the study area in Europe, (b) an overview of the location of the different sweet-cherry orchards in Belgium (a and b maps were made with the R package ggplot2 (Wickham, 2016) and the R package maps (Becker and Wilks, 2024)), (c) the orchard layout with the locations of the observation plots (red squares) and pan traps (red triangles), (d) an example of an observation plot, (e) an example of a pan trap set, and (f) an overview of the landscape characterization with intensive fruit cultivation (yellow) and seminatural habitat (green) within a buffer zone of 1000 m around the orchard (red) (map from f made with QGIS, and the background layer is © Google Maps).
2.2 Pollinator sampling using insect nets
Pollinator surveys by means of catching flower-visiting insects with insect nets were conducted during full bloom of sweet-cherry trees in 10 orchards in April and May 2016. In every orchard, three observation plots of 4 m × 5 m were constructed between two rows of a cultivar that was in full bloom on that day. In every observation plot, pollinators were caught on the adjacent trees on both sides of the plot. During a pollinator survey, all flower-visiting pollinators (honeybees, solitary bees, bumblebees, and hoverflies) on sweet-cherry blossoms were caught for 25 min at every observation plot. In every orchard, three pollinator surveys were conducted on a single day between 10:30 and 17:00 LT, local time (3 plots per survey × 25 min per plot = 75 min per pollinator survey and 3 surveys per day × 75 min per survey = 225 min of pollinator sampling per orchard in total). Every orchard was sampled for 1 d. To ensure adequate pollinator activity, surveys were conducted only when weather conditions were suitable for pollinator sampling (no or calm wind, no rain, and temperatures above 13 °C; Eeraerts et al., 2019; Eeraerts, 2022). Pollinators that could be identified in the field were kept in a conical tube and released after the survey (i.e., counting a certain specimen multiple times was avoided). Pollinator species that could not be identified in the field were taken to the laboratory for identification to the species level.
2.3 Pollinator sampling using pan traps
Pollinator surveys by means of pan traps were conducted during full bloom of sweet-cherry trees in the same 10 orchards in April and May 2016. Adjacent to each of the three observation plots for insect nets (approximately 10 m away from the observation plot to avoid disturbance), we also set out a set of pan traps within the orchard. Each set of pan traps consisted of a blue, a yellow, and a white trap (Ø 20 cm, Motip® Fluor Blue, Motip® Fluor Yellow, and Motip® High-Gloss White). The three traps were mounted on PVC poles that were fixed in the ground so that the traps were located at 1.2 m in height. The pan traps were filled with water and a drop of biodegradable detergent to break the surface tension. The pan traps were in place for 1 d, the same day as pollinator sampling using insect nets, and were set up before sampling with insect nets (before 10:00 LT) and retrieved afterwards (after 17:30 LT). When retrieving the pan traps, the pollinator specimens (i.e., honeybees, solitary bees, bumble bees, and hoverflies) were collected in a vial with 70 % ethanol and labeled according to the trap. All specimens were taken to the laboratory for subsequent identification. All specimens collected were identified in the lab by Maxime Eeraerts, with a stereo microscope (Falk et al., 2017; Bot and Van den Meutter, 2019).
2.4 Statistical analyses
Data of the different surveys (different rounds of net catching in the different observation plots and the different sets of pan traps) were pooled to obtain a pollinator dataset according to the sampling method in each orchard. A total of 548 honeybees were caught, 29 and 519 with pan traps and insect nets, respectively, and honeybees were excluded from the analyses, as their presence is mainly determined by beekeepers (Eeraerts et al., 2023b). Sampling efficiency was determined with a sample-based species accumulation curve and a first-order jackknife species richness estimation (functions specpool and specaccum, R package vegan; Oksanen et al., 2025).
For RQ1, we considered the following response variables: (a) total pollinator species richness, (b) bumblebee species richness, (c) solitary bee species richness, (d) hoverfly species richness, (e) total pollinator abundance, (f) bumblebee abundance, (g) solitary bee abundance, and (h) hoverfly abundance. To test the effect of the sampling method on the various response variables, a generalized linear mixed-effects model was used, modeling all response variables with a Conway–Maxwell–Poisson distribution (GLMM, function glmmTMB, R package glmmTMB; Brooks et al., 2017). The sampling method (i.e., pan traps vs. insect nets) was included as a fixed variable, and the location ID was included as a random variable. Additionally, differences in pollinator community composition between sampling methods were tested. Here, a Bray–Curtis dissimilarity matrix was created, and permutation-based multivariate analysis of variance (PERMANOVA) was used to test the influence of the sampling method on the composition of the pollinator community (function adonis, R package vegan). Nonmetric multidimensional scaling (NMDS), with two a priori chosen dimensions and a maximum of 1000 permutations, was used to visualize the pollinator composition between methods (function metaMDS, R package vegan).
For RQ2, we considered total pollinator species richness and total wild pollinator abundance as response variables. GLMMs were used to infer whether the sampling method interacted with SNH and IFC as fixed variables (i.e., the full model is ; location ID was included as a random variable). We tested the full model for each response variable for both landscape scales, 250 and 1000 m, and reported the full model corresponding to the most informative scale (ΔAICC>2).
Model fits of the GLMMs were evaluated by means of residual diagnostics and goodness-of-fit tests from the DHARMa R package (Hartig, 2019). All analyses were performed with R version 4.3.2 (R Development Core Team, 2022).
In total, 202 wild pollinator specimens were caught, of which 95 specimens were caught with pan traps and 107 specimens with insect nets. This amounted to a total of 30 pollinator species, of which 19 species were caught with pan traps and 22 species with insect nets (see Table S1 for the species list). The 19 species observed in pan traps and the 22 species caught by nets make up 67.6 % of the expected 28.11 ± 8.2 species for pan traps and 66.2 % of the expected 33.3 ± 9.7 species for nets (first-order jackknife estimation, Fig. S1). A total of 7 and 10 pollinator species were only caught by means of pan trapping or insect nets, respectively.
Table 1Generalized linear mixed-effects models assessing the effect of sampling method on total pollinator species richness, bumblebee species richness, solitary bee species richness, hoverfly species richness, total wild pollinator abundance, bumblebee abundance, solitary bee abundance, and hoverfly abundance. The following model statistics are given: estimates (the estimate for nets compared to pan traps as the baseline), the standard error (SE), z values, and p values.
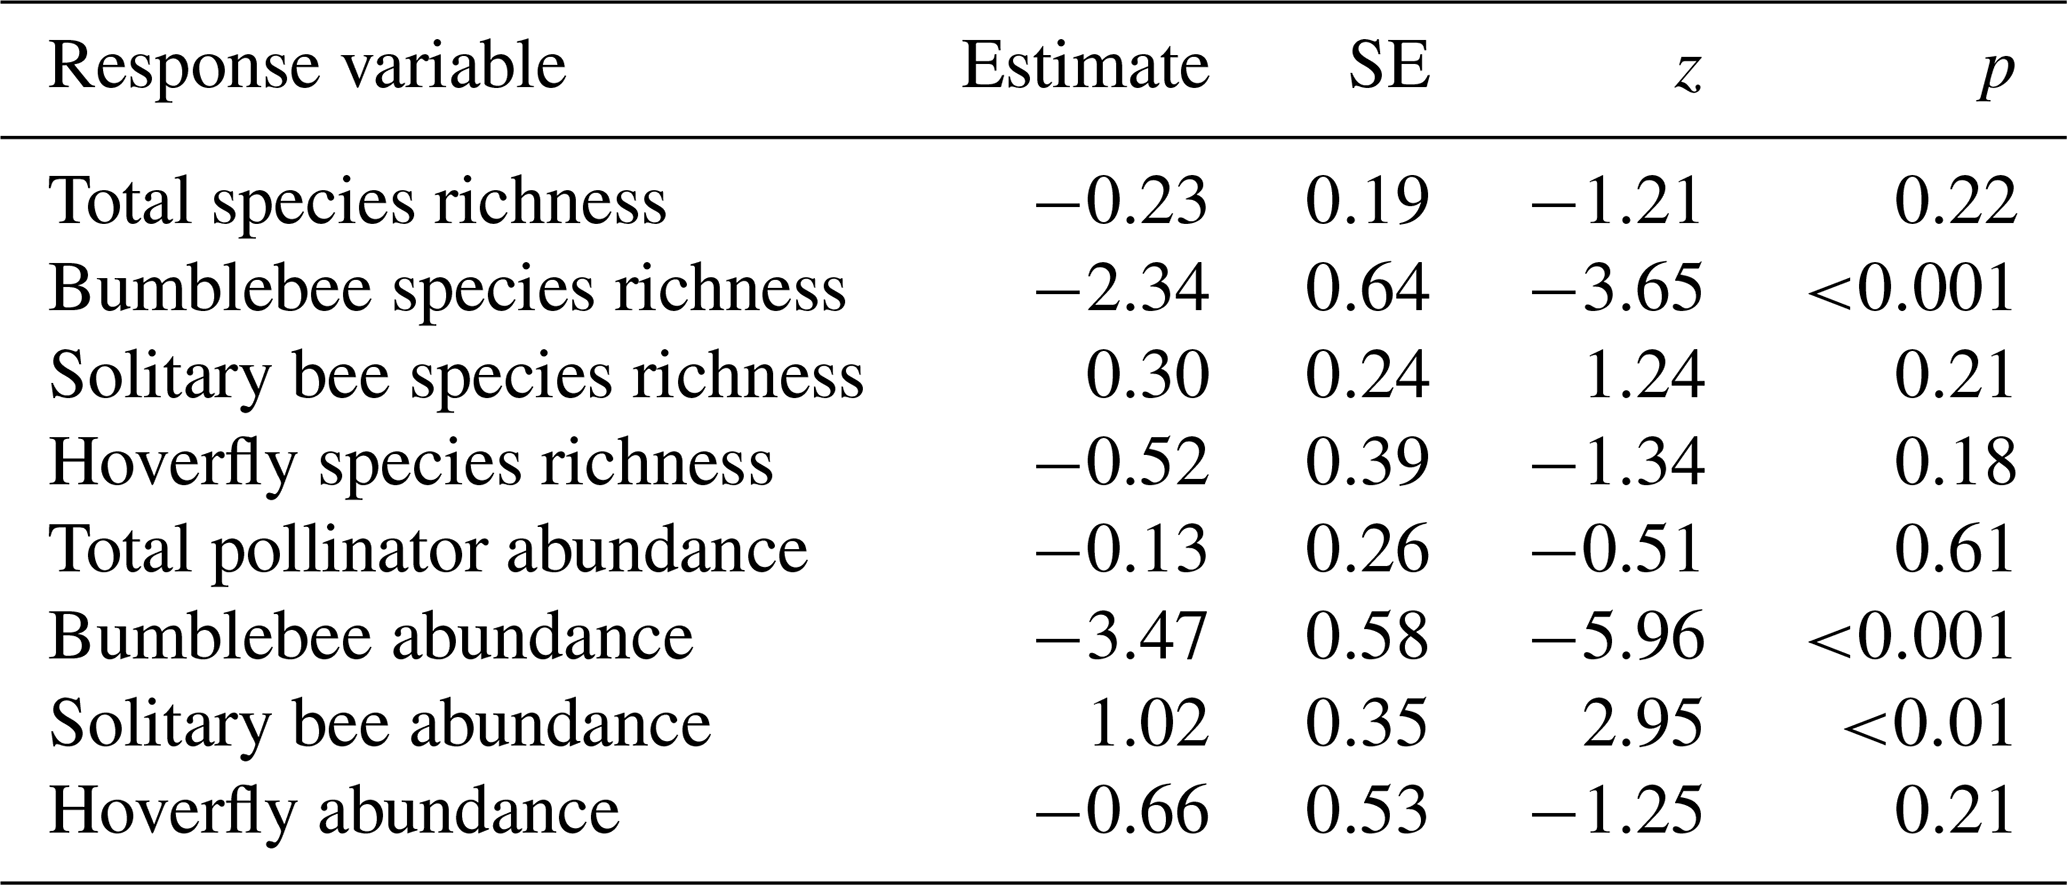
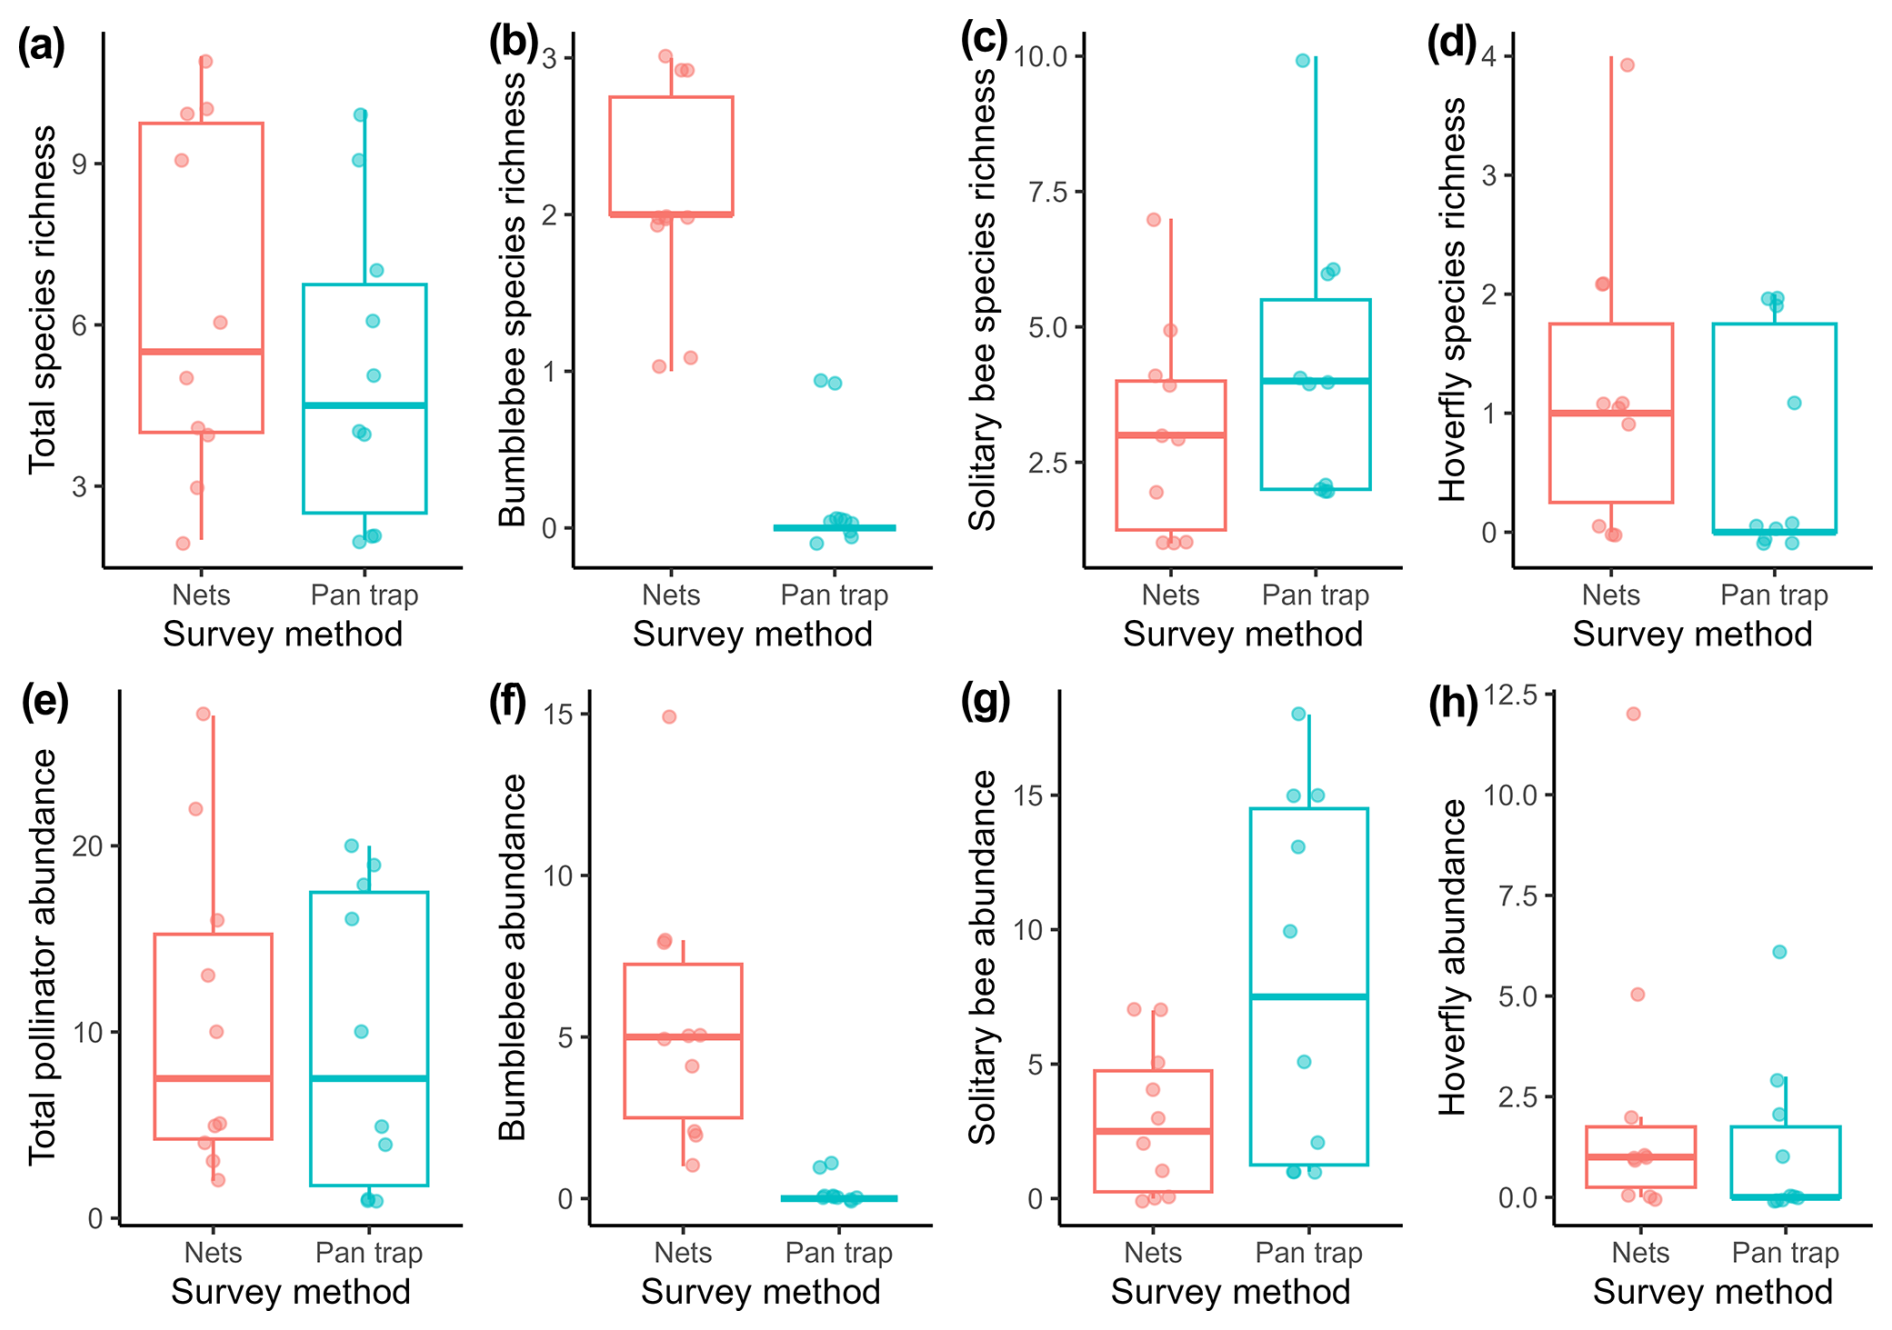
Figure 2Boxplots with raw data points illustrating species richness and abundance of pollinating insects in relation to the pollinator sampling method, insect nets (red) or pan traps (blue-green) (a total species richness, b bumblebee species richness, c solitary bee species richness, d hoverfly species richness, e total pollinator abundance, f bumblebee abundance, g solitary bee abundance, h hoverfly abundance).
Sampling method had no effect on total pollinator, solitary bee, and hoverfly species richness (Table 1; Fig. 2a, c, d). Bumblebee species richness was 10 times as high for insects nets compared to pan traps (Table 1; Fig. 2b). Total pollinator and hoverfly abundance was not significantly different between the two sampling methods (Table 1; Fig. 2e, h), whereas the bumblebee abundance detected was 27 times higher for insect nets, while solitary bee abundance was 2.8 times higher in pan traps (Table 1; Fig. 2f, g). PERMANOVA indicated that the sampling method significantly influenced the pollinator community composition (F=4.77, p<0.001; Fig. 3).
The most informative landscape scale for total pollinator species richness and wild pollinator abundance was the 1000 m landscape scale (Table S2). For species richness, we conclude that there was a significant interaction between the sampling method and both SNH and IFC (Table 2, Fig. 4a, b). For wild pollinator abundance, we found a consistent positive effect of SNH, while the sampling method showed an interaction with IFC (Table 2, Fig. 4c, d).
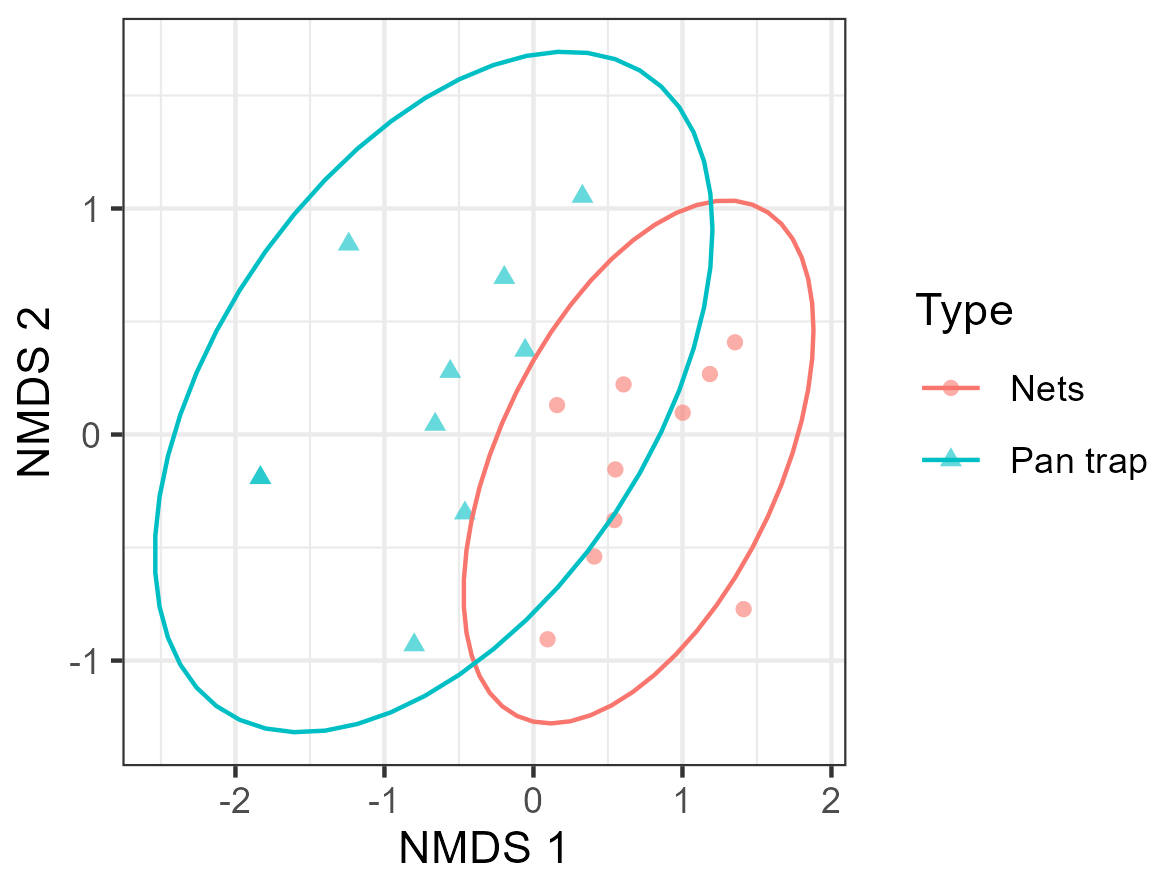
Figure 3NMDS plot based on the Bray–Custis dissimilarity data to compare the composition of the pollinator community between two pollinator sampling methods: insect nets and pan traps. Each point represents the pollinator community of a certain orchard per sampling method: the ellipses indicate the 95 % confidence interval, and the NMDS plot represents the data with a stress of 0.11.
Table 2General linear mixed-effects models assessing the effect of sampling method and its interaction with both seminatural habitat (SNH) and intensive fruit cultivation (IFC) on total pollinator species richness and total wild pollinators. Only the full model of the best-explaining landscape scale is reported; ΔAICc, model estimates, the standard error (SE), z statistics, and p values are given. ΔAICc is the difference between the AICc of the model with the lowest AICc and the AICc of the models on the 250 m and 1000 m landscape scales.
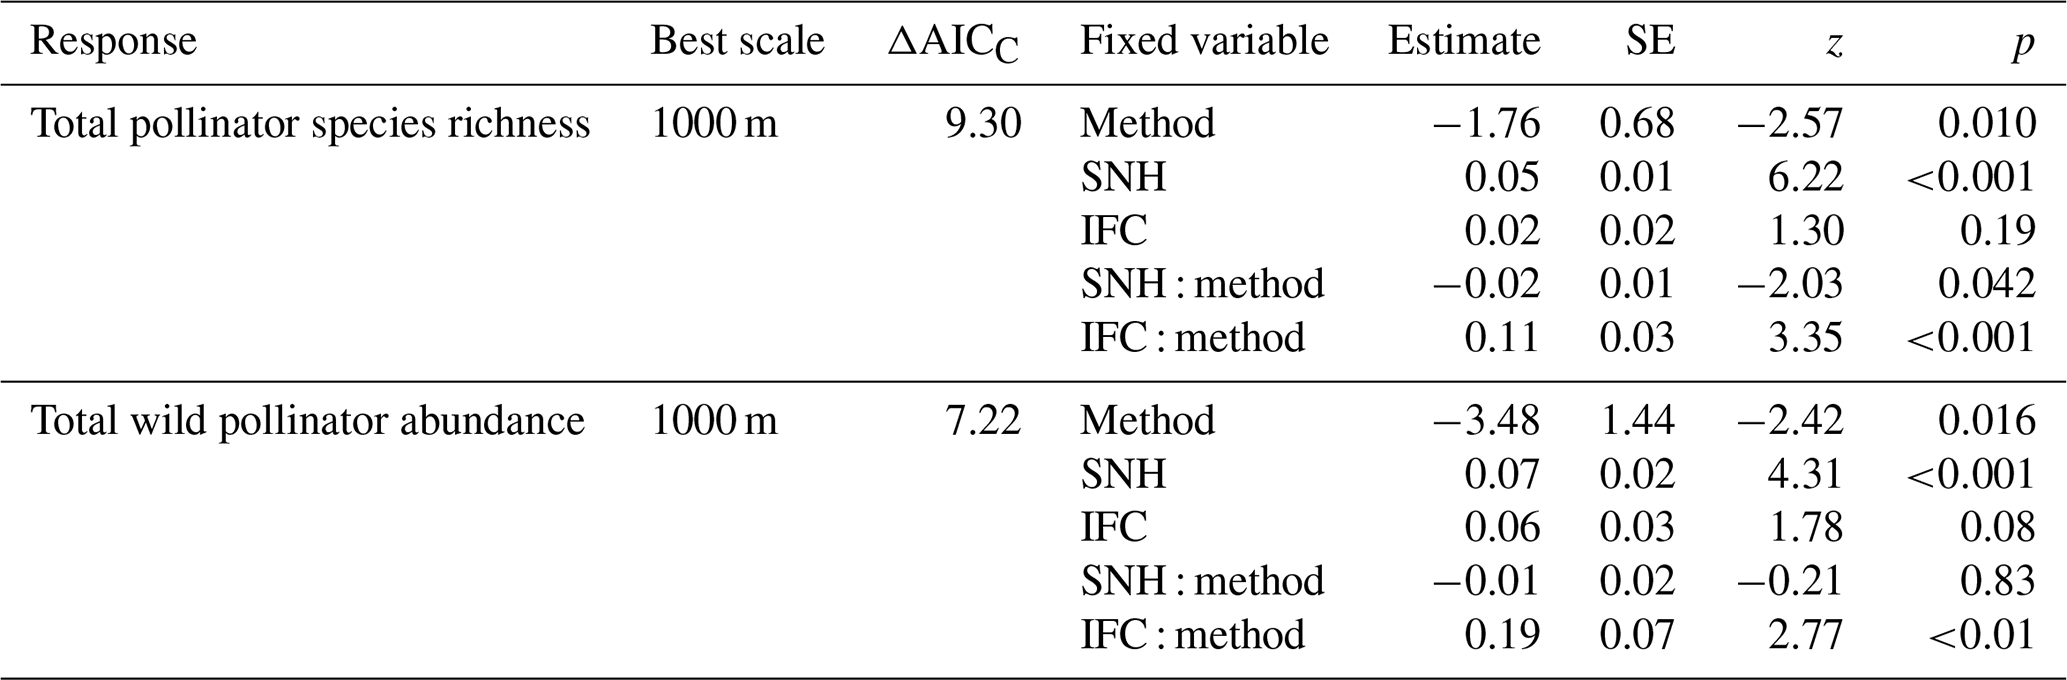
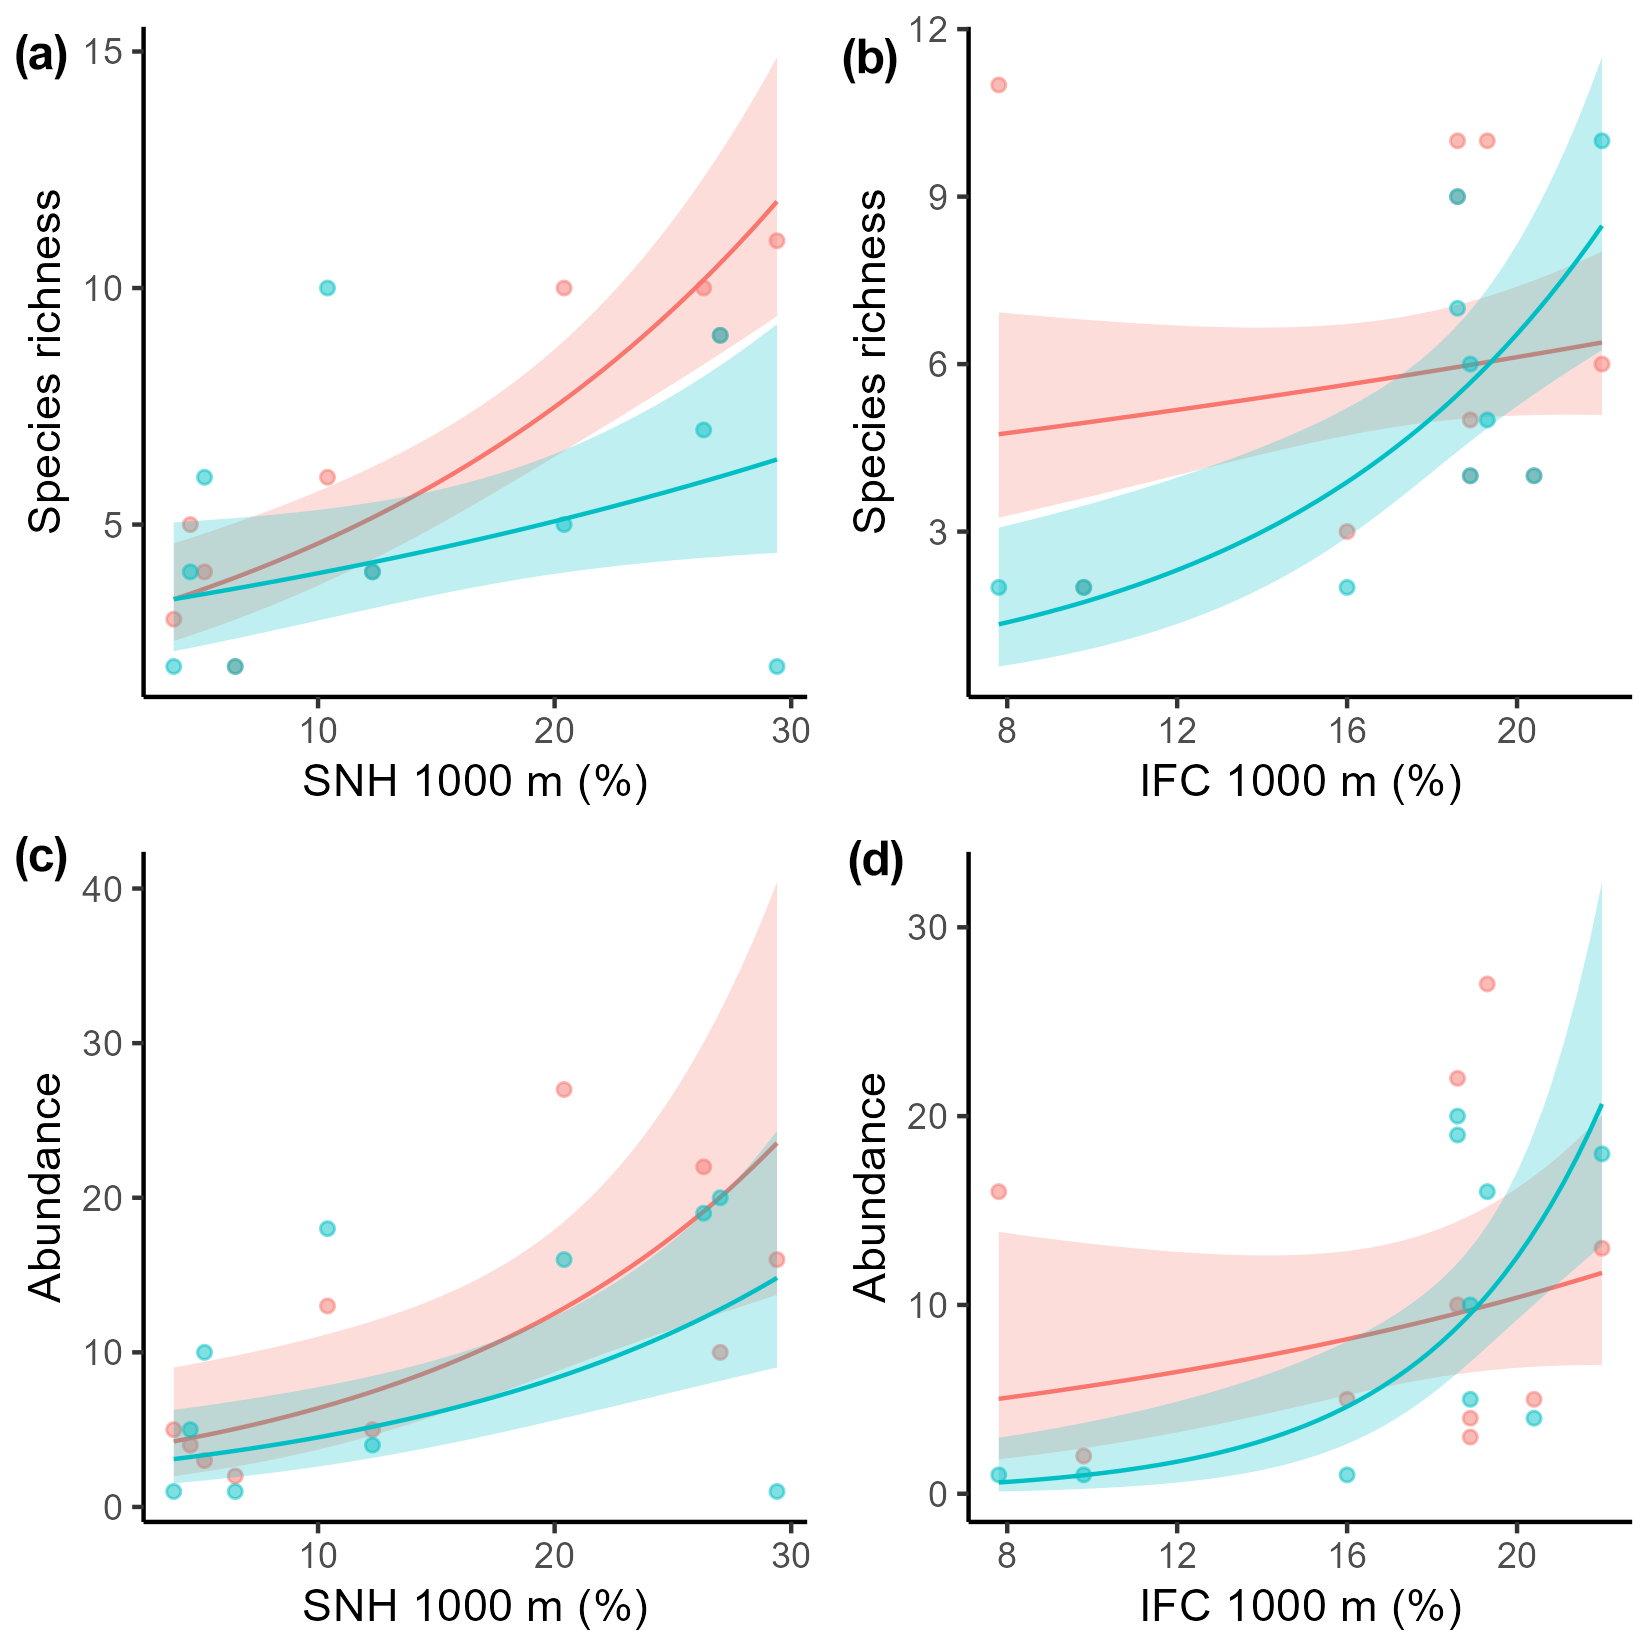
Figure 4Relation between total wild pollinator species richness and the amount of seminatural habitat (SNH, a) within 1000 m and the amount of intensive fruit cultivation (IFC, b) within 1000 m for both insect net (red) and pan trap data (blue-green). Relation between total wild pollinator abundance and the amount of SNH within 1000 m (c) and the amount of IFC within 1000 m (d) for both insect nets (red) and pan traps (blue-green). Dots indicate the raw data, solid lines indicate significant relationships, and the shaded area indicates the 95 % confidence intervals.
Both sampling methods obtained similar sampling efficiencies (66 %–67 %) and total pollinator species richness and abundance, but in general they captured different pollinator communities. Insect nets were better for catching bumblebees, and pan traps caught more solitary bees, while both methods performed equally well for hoverflies. Additionally, the pollinator data from each method correlated differently with the landscape composition.
We concluded that total species richness and total abundance were similar and that both methods provided similar sampling efficiencies, yet they captured different subsets of the pollinator community. Detecting distinct pollinator communities with these two sampling methods is in line with previous research that used different sampling methods in both various types of seminatural habitat and agricultural crops (Westphal et al., 2008; O'Connor et al., 2019; Mudri-Stojnić et al., 2023; Lezzeri et al., 2024). As both sampling methods were carried out during the same day at the same location for more or less the same amount of time, the different community compositions that we found cannot only be attributed to different sampling efficiencies or sampling efforts (O'Connor et al., 2019). Higher numbers of bumblebee specimens and species caught with netting align with the general finding that sampling methods like insect nets and direct observations are better at detecting large bees like bumble bees (Prendergast et al., 2020; Lezzeri et al., 2024). The solitary bee richness detected, on the other hand, was higher for pan traps. Pan traps are indeed often found to detect a high number of certain solitary bees like halictid bees (Portman et al., 2020). The detection of distinct pollinator communities by both methods has clear implications for monitoring. In large-scale bee monitoring in Serbia, Mudri-Stojnić et al. (2023) detected 25 species, with 18 detected by means of insect nets, 13 by pan traps, and 6 species caught with both methods. To date, large-scale and long-term pollinator monitoring has been conducted successfully with both methods (Wood et al., 2018; Powney et al., 2019; Galpern et al., 2021; Gillespie et al., 2022; Bishop et al., 2024). However, our results and those of other studies suggest that more robust and complete population data can be obtained when pan traps and insect nets are combined.
A key finding is that the pollinator data from different sampling methods respond differently to landscape composition, a factor that, to our knowledge, has not been considered in previous studies. Both methods showed a positive relationship of species richness and wild pollinator abundance with increasing SNH; this result is consistent with previous studies (Kennedy et al., 2013; Eeraerts, 2023). The richness and abundance data of pan trapping showed a positive relation with increasing IFC, which is somewhat surprising. Most studies have found that wild pollinator richness and abundance decrease with increasing cover of intensive agriculture or increasing mass-flowering crops (Holzschuh et al., 2016; Eeraerts et al., 2017, 2023b; Grab et al., 2019). But some pan trapping studies indeed detect positive correlations with wild pollinator richness and abundance in areas with increasing intensive agriculture (Gerits et al., 2023; Hulsmans et al., 2023). It has been suggested that pan traps attract more pollinators when flowers are scarce (Portman et al., 2020), whereas in landscapes with abundant flowers, bees are less likely to mistake pan traps for flowers. Perhaps in our setup, in which local-scale resources were the same for all sites in mass-flowering fruit orchards and with a landscape-scale gradient of mass-flowering fruit tree crops, pollinators were attracted to the pan traps, as they mimic a diverse patch of flowers (traps with three different colors), which contrast with the white blossoms of fruit tree crops. This could possibly explain why the pan traps attract and catch more pollinator specimens in landscapes with more fruit tree crops, as these are more homogeneous landscapes, and the pan traps might trick the bees into believing that they are an attractive patch of flowers. On the other hand, the variation in the species communities measured by these two methods could also drive the different responses to the landscape composition. However, unraveling the mechanisms behind this finding warrants future research.
More detailed studies on the specific response of certain pollinator groups like hoverflies, dominant crop pollinators vs. non-dominant crop pollinators, or even specific species would be useful to further unravel the interaction between sampling method and landscape context (or other resource gradient parameters). We did not include honeybee abundance in the analyses, as their presence is influenced by beekeepers (Benjamin and Winfree, 2014; Eeraerts et al., 2023b). Previous landscape studies have concluded that there are variable correlations between honeybee visitation and the quantity of mass-flowering crops (Petersen and Nault, 2014; Eeraerts et al., 2017, 2023b) and the amount of SNH (Holzschuh et al., 2012; Klein et al., 2012; Gibbs et al., 2016; Alomar et al., 2018; Eeraerts et al., 2019, 2023b; Mallinger et al., 2021). Hence, understanding how honeybees interact with variations in the landscape composition requires that we take the locations of the honeybee hives into account (see Gaines-Day and Gratton, 2016; Eeraerts et al., 2023b). As we do not have the information regarding hives within a 1 km or 2 km buffer zone around each sampling site, we cannot make a robust interference about this pattern for honeybees. However, this is an important topic for future studies, as it is essential for sustainable crop pollination management and for safeguarding bee health as well.
Halting pollinator declines requires reliable and cost-effective sampling methods that accurately reflect the diversity of the pollinator community (Breeze et al., 2021). From a methodological perspective, our study has implications for national and international pollinator monitoring programs and in turn for biodiversity conservation (IPBES, 2016). Pollinator sampling by means of both insect nets and pan traps have a systematic bias. As these different sampling methods detect different pollinator communities, each capturing unique species, we suggest that both methods should be used in large-scale, standardized pollinator monitoring schemes. But caution is needed when using pan trap data to explain landscape relationships. We advise using pan trapping to guide sampling using insect nets, as it can inform the samplers of species that they are missing and thereby reduce sampling bias.
The code of this study is available in the Supplement.
The data of this study are available in the Supplement (Table S3).
The supplement related to this article is available online at https://doi.org/10.5194/we-25-47-2025-supplement.
ME – writing (original draft), writing (review and editing), visualization, validation, project administration, methodology, investigation, funding acquisition, formal analysis, data curation, conceptualization, and supervision. IM – writing (review and editing), methodology, and conceptualization.
The contact author has declared that neither of the authors has any competing interests.
Publisher’s note: Copernicus Publications remains neutral with regard to jurisdictional claims made in the text, published maps, institutional affiliations, or any other geographical representation in this paper. While Copernicus Publications makes every effort to include appropriate place names, the final responsibility lies with the authors.
The authors would like to thank the farmers for their participation and for access to their land during the study. We also are grateful to Willem Proesmans for technical advice on how to deploy pan traps.
This research has been supported by the Fonds Wetenschappelijk Onderzoek (grant no. 1210723N).
This paper was edited by Matthias Foellmer and reviewed by three anonymous referees.
Allen-Perkins, A., Magrach, A., Dainese, M., Garibaldi, L. A., Kleijn, D., Rader, R., Reilly, J. R., Winfree, R., Lundin, O., McGrady, C. M., Brittain, C., Biddinger, D. J., Artz, D. R., Elle, E., Hoffman, G., Ellis, J. D., Daniels, J., Gibbs, J., Campbell, J. W., Brokaw, J., Wilson, J. K., Mason, K., Ward, K. L., Gundersen, K. B., Bobiwash, K., Gut, L., Rowe, L. M., Boyle, N. K., Williams, N. M., Joshi, N. K., Rothwell, N., Gillespie, R. L., Isaacs, R., Fleischer, S. J., Peterson, S. S., Rao, S., Pitts-Singer, T. L., Fijen, T., Boreux, V., Rundlöf, M., Viana, B. F., Klein, A.-M., Smith, H. G., Bommarco, R., Carvalheiro, L. G., Ricketts, T. H., Ghazoul, J., Krishnan, S., Benjamin, F. E., Loureiro, J., Castro, S., Raine, N. E., de Groot, G. A., Horgan, F. G., Hipólito, J., Smagghe, G., Meeus, I., Eeraerts, M., Potts, S. G., Kremen, C., García, D., Miñarro, M., Crowder, D. W., Pisanty, G., Mandelik, Y., Vereecken, N. J., Leclercq, N., Weekers, T., Lindstrom, S. A. M., Stanley, D. A., Zaragoza-Trello, C., Nicholson, C. C., Scheper, J., Rad, C., Marks, E. A. N., Mota, L., Danforth, B., Park, M., Bezerra, A. D. M., Freitas, B. M., Mallinger, R. E., Oliveira da Silva, F., Willcox, B., Ramos, D. L., D. da Silva e Silva, F., Lázaro, A., Alomar, D., González-Estévez, M. A., Taki, H., Cariveau, D. P., Garratt, M. P. D., Nabaes Jodar, D. N., Stewart, R. I. A., Ariza, D., Pisman, M., Lichtenberg, E. M., Schüepp, C., Herzog, F., Entling, M. H., Dupont, Y. L., Michener, C. D., Daily, G. C., Ehrlich, P. R., Burns, K. L. W., Vilà, M., Robson, A., Howlett, B., Blechschmidt, L., Jauker, F., Schwarzbach, F., Nesper, M., Diekötter, T., Wolters, V., Castro, H., Gaspar, H., Nault, B. A., Badenhausser, I., Petersen, J. D., Tscharntke, T., Bretagnolle, V., Willis Chan, D. S., Chacoff, N., Andersson, G. K. S., Jha, S., Colville J. F., Veldtman, R., Coutinho, J., Bianchi, F. J. J. A., Sutter, L., Albrecht, M., Jeanneret, P., Zou, Y., Averill, A. L., Saez, A., Sciligo, A. R., Vergara, C. H., Bloom, E. H., Oeller, E., Badano, E. I., Loeb, G. M., Grab, H., Ekroos, J., Gagic, V., Cunningham, S. A., Åström, J., Cavigliasso, P., Trillo, A., Classen, A., Mauchline, A. L., Montero-Castaño, A., Wilby, A., Woodcock, B. A., Sidhu, C. S., Steffan-Dewenter, I., Vogiatzakis, I. N., Herrera, J. M., Otieno, M., Gikungu, M. W., Cusser, S. J., Nauss, T., Nilsson, L., Knapp, J., Ortega-Marcos, J. J., González, J. A., Osborne, J. L., Blanche, R., Shaw, R. F., Hevia, V., Stout, J., Arthur, A. D., Blochtein, B., Szentgyorgyi, H., Li, J., Mayfield, M. M., Woyciechowski, M., Nunes-Silva, P., Halinski de Oliveira, R., Henry, S., Simmons, B. I., Dalsgaard, B., Hansen, K., Sritongchuay, T., O'Reilly, A. D., Chamorro García, F. J., Nates Parra, G., Magalhães Pigozo, C., and Bartomeus, I.: CropPol: A dynamic, open and global database on crop pollination, Ecology, 103, e3614, https://doi.org/10.1002/ecy.3614, 2022.
Alomar, D., González-Estévez, M. A., Traveset, A., and Lázaro, A.: The intertwined effects of natural vegetation, local flower community, and pollinator diversity on the production of almond trees, Agric. Ecosyst. Environ., 264, 34–43, https://doi.org/10.1016/j.agee.2018.05.004, 2018.
Becker, R. A. and Wilks, A. R.: Maps: Draw Geographical Maps, https://cran.r-project.org/web/packages/maps/index.html (last access: 26 January 2025), 2024.
Benjamin, F. E. and Winfree, R.: Lack of pollinators limits fruit production in commercial blueberry (Vaccinium corymbosum), Environ. Entomol., 43, 1574–1583, https://doi.org/10.1603/en13314, 2014.
Bishop, G. A., Fijen, T. P. M., Raemakers, I., van Kats, R. J. M., and Kleijn, D.: Bees go up, flowers go down: Increased resource limitation from late spring to summer in agricultural landscapes, J. Appl. Ecol., 61, 431–441, https://doi.org/10.1111/1365-2664.14576, 2024.
Bot, S. and Van den Meutter, F.: Veldgids zweefvliegen, KNNV uitgeverij, the Netherlands, ISBN 9789050117562, 2019.
Breeze, T. D., Bailey, A. P., Balcombe, K. G., Brereton, T., Comont, R., Edwards, M., eGarratt, M., Harvey, M., Hawes, C., Isaac, N., Jithal, M., Jones, C., Kunin, W., Lee, P., Morris, R., Musgroce, A., O'Connor, R., Peyton, J., Potts, S., Roberts, S., Roy, D., Roy, E., Vanbergen, A., and Carvell, C.: Pollinator monitoring more than pays for itself, J. Appl. Ecol., 58, 44–57, https://doi.org/10.1111/1365-2664.13755, 2021.
Brooks, M. E., Kristensen, K., Benthem, K. J. van, Magnusson, A., Berg, C. W., Nielsen, A., Skaug, H., Machler, M., and Bolker; B.: glmmTMB balances speed and flexibility among packages for zero-inflated generalized linear mixed modeling, The R Journal, 9, 378–400, https://doi.org/10.32614/RJ-2017-066, 2017.
Carvalheiro, L. G., Kunin, W. E., Keil, P., Aguirre-Gutie, Rrez, J., Ellis, W. N., Fox, R., Groom, Q., Hennekens, S., Van Landuyt, W., Maes, D., Van de Meutter, F., Michez, D., Rasmont, P., Ode, B., Potts, S. G., Reemer, M., Roberts, S., Schaminee, J., WallisDeVries, M., and Biesmeijer, J. C.: Species richness declines and biotic homogenisation have slowed down for NW-European pollinators and plants, Ecol. Lett., 16, 870–878, https://doi.org/10.1111/ele.12121, 2013.
Departement Omgeving: Vlaams Actieplan Wilde Bestuivers. Departement Omgeving, Brussels, Belgium, https://omgeving.vlaanderen.be/nl/vlaams-actieplan-wilde-bestuivers (last access: 14 January 2025), 2022.
De Saeger, S. and Scheers, K.: The Biological Valuation Map of the Flemish Research Institute for Nature and Forest (INBO), https://www.vlaanderen.be/inbo/de-biologische-waarderingskaart/bwk-beschikbaarheid/ (last access: 16 March 2025), 2016.
Eeraerts, M.: Increasing wild bee richness and abundance on sequentially flowering cultivars of a pollinator-dependent crop, Agric. Ecosyst. Environm., 325, 107745, https://doi.org/10.1016/j.agee.2021.107745, 2022.
Eeraerts, M.: A minimum of 15 % semi-natural habitat facilitates adequate wild pollinator visitation to a pollinator-dependent crop, Biol. Conserv., 278, 109887, https://doi.org/10.1016/j.biocon.2022.109887, 2023.
Eeraerts, M. and Isaacs, R.: Various semi-natural habitat types provide complementary nesting resources for wild bees, J. Poll. Ecol., 32, 101–107, https://doi.org/10.26786/1920-7603(2023)726, 2023.
Eeraerts, M., Meeus, I., Van Den Berge, S., and Smagghe, G.: Landscapes with high intensive fruit cultivation reduce wild pollinator services to sweet cherry, Agric. Ecosyst. Environ., 239, 342–348, https://doi.org/10.1016/j.agee.2017.01.031, 2017.
Eeraerts, M., Smagghe, G., and Meeus, I.: Pollinator diversity, floral resources and semi-natural habitat, instead of honey bees and intensive agriculture, enhance pollination service to sweet cherry, Agric. Ecosyst. Environ., 284, 106586, https://doi.org/10.1016/j.agee.2019.106586, 2019.
Eeraerts, M., DeVetter, L. W., Batáry, P., Ternest, J. J., Mallinger, R., Arrington, M., Benjamon, F. E., Blaauw, B., Campbell, J., Cavigliasso, P., Daniels, J. C., de Groot, A., Ellis, J. D., Gibbs, J., Goldstein, L., Hoffman, G., Kleijn, D., Melathopoulos, A., Miller, S. Z., Montero-Castaño, Narajo, S. M., Nicholson, C. C., Perkins, J., Rao, S., Raine, N., Reilly, J., Ricketts, T., Rogers, E., and Isaacs, R.: Synthesis of highbush blueberry pollination research reveals region-specific differences in the contributions of honeybees and wild bees, J. Appl. Ecol., 60, 2528–2539, https://doi.org/10.1111/1365-2664.14516, 2023a.
Eeraerts, M., Rogers, E., Gillespie, B., Best, L., Smith, O. M., and DeVetter, L. W.: Landscape-level honey bee hive density, instead of field-level hive density, enhances honey bee visitation in blueberry, Landsc. Ecol., 38, 583–595, https://doi.org/10.1007/s10980-022-01562-1, 2023b.
Falk, S., Lewington, R., and Keijl, G.: Bijen: Veldgids voor Nederland en Vlaanderen, Kosmos Uitgevers, Utrecht/Antwerpen, ISBN 9789043932202, 2017.
Gaines-Day, H. R. and Gratton, C.: Crop yield is correlated with honey bee hive density but not in high-woodland landscapes, Agric. Ecosyst. Environ., 218, 53–57, https://doi.org/10.1016/j.agee.2015.11.001, 2016.
Galpern, P., Best, L. R., Devries, J. H., and Johnson, S. A.: Wild bee responses to cropland landscape complexity are temporally-variable and taxon-specific: Evidence from a highly replicated pseudo-experiment, Agric. Ecosyst. Environ., 322, 107652, https://doi.org/10.1016/j.agee.2021.107652, 2021.
Gazzea, E., Batáry, P., and Marini, L.: Global meta-analysis shows reduced quality of food crops under inadequate animal pollination, Nat. Commun., 14, 4463, https://doi.org/10.1038/s41467-023-40231-y, 2023.
Gerits, F., Reubens, B., Messely, L., Smedt, P. De, Landuyt, D., Loos, A., and Verheyen, K.: Disentangling the interrelated abiotic and biotic pathways linking landscape composition and crop production, J. Appl. Ecol., 59, 2742–2755, https://doi.org/10.1111/1365-2664.14269, 2023.
Gibbs, J., Elle, E., Bobiwash, K., Haapalainen, T., and Isaacs, R.: Contrasting pollinators and pollination in native and non-native regions of highbush blueberry production, PLoS ONE, 11, e0158937, https://doi.org/10.1371/journal.pone.0158937, 2016.
Gillespie, M. A. K., Baude, M., Biesmeijer, J., Boatman, N., Budge, G. E., Crowe, A., Davies, N., Evans, R., Memmott, J., Morton, R., Moss, E., Murphy, E, Pietravalle, S., Potts, S., Roberts, S., Rowland, C., Senapathi, D., Smart, S., Wood, S., and Kunin, W. E.: Landscape-scale drivers of pollinator communities may depend on land-use configuration, Philos. T. R. Soc. B, 377, https://doi.org/10.1098/rstb.2021.0172, 2022.
Goulson, D., Nicholls, E., Botías, C., and Rotheray, E. L.: Bee declines driven by combined stress from parasites, pesticides, and lack of flowers, Science, 347, 1255957, https://doi.org/10.1126/science.1255957, 2015.
Grab, H., Branstetter, M., Amon, N., Urban-Mead, K., Park, M., Gibbs, J., Blitzer, E., Poveda, K., Loeb, G., and Danforth, B.:. Agriculturally dominated landscapes reduce bee phylogenetic diversity and pollination services, Science, 363, 282–284, https://doi.org/10.1126/science.aat6016, 2019.
Hartig, F.: DHARMa: Residual diagnostics for hierarchical (multi-level/mixed) regression models, R package version 0.2.6, https://cran.r-project.org/web/packages/DHARMa/vignettes/DHARMa.html, last access: 30 December 2019.
Holzschuh, A., Dudenhöffer, J. H., and Tscharntke, T.: Landscapes with wild bee habitats enhance pollination, fruit set and yield of sweet cherry, Biol. Conserv., 153, 101–107, https://doi.org/10.1016/j.biocon.2012.04.032, 2012.
Holzschuh, A., Dainese, M., González-Varo, J. P., Mudri-Stojnić, S., Riedinger, V., Rundlöf, M., Scheper, J., Wickens, J. B., Wickens, V. J., Bommarco, R., Kleijn, D., Potts, S. G., Roberts, S. P. M., Smith, H. G., Vilà, M., Vujić, A., and Steffan-Dewenter, I.: Mass-flowering crops dilute pollinator abundance in agricultural landscapes across Europe, Ecol. Lett., 19, 1228–1236, https://doi.org/10.1111/ele.12657, 2016.
Hulsmans, E., Daelemans, R., Cuypers, V., Straeten, E. Van Der, Vanderlinden, M., Blanck, T. De, Vertommen, W., Boeraeve, M., Proesmans, W., and Honney, O.: Cascading effects of management and landscape on insect pollinators, pollination services and yield in apple orchards, Agric. Ecosyst. Environ., 352, 108509, https://doi.org/10.1016/j.agee.2023.108509, 2023.
IPBES: The assessment report of the Intergovernmental Science-Policy Platform on Biodiversity and Ecosystem Services on pollinators, pollination and food production, edited by: Potts, S. G., Imperatriz-Fonseca, V. L., and Ngo, H. T., Secretariat of the Intergovernmental Science-Policy Platform on Biodiversity and Ecosystem Services, Bonn, Germany, 552 pp., https://doi.org/10.5281/zenodo.3402856, 2016.
Kendall, L. K., Mola, J. M., Portman, Z. M., Cariveau, D. P., Smith, H. G., and Bartomeus, I.: The potential and realized foraging movements of bees are differentially determined by body size and sociality, Ecology, 103, e3809, https://doi.org/10.1002/ecy.3809, 2022.
Kennedy, C. M., Lonsdorf, E., Neel, M. C., Williams, N. M., Ricketts, T. H., Winfree, R., Bommarco, R., Brittain, C., Burley, A. L., Cariveau, D., Carvalheiro, L. G., Chacoff, N. P., Cunningham, S. A., Danforth, B. N., Dudenhöffer, J., Elle, E., Gaines, H. R., Garibaldi, L. A., Gratton, C., Holzschuh, A., Isaacs, R., Javorek, S. K., Jha, S., Klein, A. M., Krewenka, K., Mandelik, Y., Mayfield, M. M., Morandin, L., Neame, L. A., Otieno, M., Park, M., Potts, S. G., Rundlöf, M., Saez, A., Steffan-Dewenter, I., Taki, H., Viana, B. F., Westphal, C., Wilson, J. K., Greenleaf, S. S., and Kremen, C.: A global quantitative synthesis of local and landscape effects on wild bee pollinators in agroecosystems, Ecol. Lett., 16, 584–599, https://doi.org/10.1111/ele.12082, 2013.
Klein, A. M., Brittain, C., Hendrix, S. D., Thorp, R., Williams, N., and Kremen, C.: Wild pollination services to California almond rely on semi-natural habitat, J. Appl. Ecol., 49, 723–732, https://doi.org/10.1111/j.1365-2664.2012.02144.x, 2012.
Lezzeri, M., Lozano, V., Brundu, G., Floris, I., Pusceddu, M., Quaranta, M., and Satta, A.: Standardized transect walks outperform pan traps in assessing wild bee community in a Mediterranean protected area (Asinara National Park, Italy), Biodiv. Conserv., 33, 1–16, https://doi.org/10.1007/s10531-024-02850-9, 2024.
Mallinger, R., Ternest, J. J., and Naranjo, S. M.: Blueberry Yields Increase with Bee Visitation Rates, but Bee Visitation Rates are not Consistently Predicted by Colony Stocking Densities, J. Econ. Entom., 114, 1441–1451, https://doi.org/10.1093/jee/toab111, 2021.
Mudri-Stojnić, S., Andrić, A., Józan, Z., Likov, L., Tot, T., Grković, A., and Vujic, A..: New records for the wild bee fauna (Hymenoptera, Anthophila) of Serbia, J. Hymenopt. Res., 96, 761–781, https://doi.org/10.3897/jhr.96.107595, 2023.
O'Connor, R. S., Kunin, W. E., Garratt, M. P. D., Potts, S. G., Roy, H. E., Andrews, C., Jones, C. M., Peyton, J., Savage, J., Harvey, M., Morris, R. A., Roberts, S., Wright, I., Vanbergen, A., and Carvell, C.: Monitoring insect pollinators and flower visitation: The effectiveness and feasibility of different survey methods, Meth. Ecol. Evol., 10, 2129–2140, https://doi.org/10.1111/2041-210X.13292, 2019.
Oksanen, J., Simpson, G., Blanchet, F., Kindt, R., Legendre, P., Minchin, P., O'Hara, R., Solymos, P., Stevens, M,, Szoecs, E., Wagner, H., Barbour, M., Bedward, M., Bolker, B., Borcard, D., Borman, T., Carvalho, G., Chirico, M., De Caceres, M., Durand, S., Evangelista, H., FitzJohn, R., Friendly, M., Furneaux, B., Hannigan, G., Hill, M., Lahti, L., McGlinn, D., Ouellette, M., Ribeiro Cunha, E., Smith, T., Stier, A., Ter Braak, C., and Weedon, J.:. vegan: Community Ecology Package. R package version 2.7-0, https://cran.r-project.org/web/packages/vegan/index.html (last access: 16 March 2025), 2025.
Osterman, J., Mateos-Fierro, Z., Siopa, C., Castro, H., Castro, S., and Eeraerts, M.: The impact of pollination requirements, pollinators, landscape and management practices on pollination in sweet and sour cherry: a systematic review, Agric. Ecosyst. Environ., 374, 109163, https://doi.org/10.1016/j.agee.2024.109163, 2024.
Outhwaite, C. L., McCann, P., and Newbold, T.: Agriculture and climate change are reshaping insect biodiversity worldwide, Nature, 605, 97–102, https://doi.org/10.1038/s41586-022-04644-x, 2022.
Petersen, J. D. and Nault, B. A.: Landscape diversity moderates the effects of bee visitation frequency to flowers on crop production, J. Appl. Ecol., 51, 1347–1356, https://doi.org/10.1111/1365-2664.12287, 2014.
Portman, Z. M., Bruninga-Socolar, B., and Cariveau, D. P.: The State of Bee Monitoring in the United States: A Call to Refocus Away from Bowl Traps and towards More Effective Methods, Ann. Entomol. Soc. Am., 113, 337–342, https://doi.org/10.1093/aesa/saaa010, 2020.
Potts, S., Dauber, J., Hochkirch, A., Oteman, B., Roy, D., Ahnre, K., Biesmeijer, K., Breeze, T., Carvell, C., Ferreira, C., Fitzpatrick, Ú., Isaac, N., Kuussaari, M., Ljubomirov, T., Maes, J., Ngo, H., Pardo, A., Polce, C., Quaranta, M., Settele, J., Sorg, M., Stefanescu, C., and Vujic, A.: Proposal for an EU Pollinator Monitoring Scheme, EUR 30416 EN, Publications Office of the European Union, Luxembourg, ISBN 978-92-76-23859-1, https://doi.org/10.2760/881843, 2021.
Potts, S. G., Bartomeus, I., Biesmeijer, K., Breeze, T., Casino, A., Dauber, J., Dieker, P., Hochkirch, A., Hoye, T., Isaac, N., Kleijn, D., Lairke, L., Mandelik, Y., Montagna, M., Montero-Castano, A., Ockinger, E., Oteman, B., Pardo Valle, A., Polve, C., Povellato, A., Quaranta, M., Roy, D., Schweiger, O., Settele, J., Stahls-Makela, G., Tamborra, M., Troost, G., Van Der Wal, R., Vujic, A., and Zhang, J.: Refined proposal for an EU pollinator monitoring scheme, Publications Office of the European Union, Luxembourg, https://doi.org/10.2760/2005545, 2024.
Powney, G. D., Carvell, C., Edwards, M., Morris, R. K. A., Roy, H. E., Woodcock, B. A., and Isaac, N. J.: Widespread losses of pollinating insects in Britain, Nat. Commun., 10, 1018, https://doi.org/10.1038/s41467-019-08974-9, 2019.
Prendergast, K. S., Menz, M. H. M., Dixon, K. W., and Bateman, P. W.: The relative performance of sampling methods for native bees: an empirical test and review of the literature, Ecosphere, 11, e03076, https://doi.org/10.1002/ecs2.3076, 2020.
QGIS Development Team: QGIS Geographic Information System, Open Source Geospatial Foundation Project, https://qgis.org/ (last access: 16 March 2025), 2012.
R Development Core Team: R: A Language and Environment for Statistical Computing, R Foundation for Statistical Computing, Vienna, Austria, https://www.r-project.org (last access: 16 March 2025), 2022.
Timberlake, T. P., Vaughan, I., and Memmott, J.: Phenology of farmland floral resources reveals seasonal gaps in nectar availability for bumblebees, J. Appl. Ecol., 56, 1585–1596, https://doi.org/10.1111/1365-2664.13403, 2019.
Tscharntke, T., Batáry, P., and Grass, I.: Mixing on- and off-field measures for biodiversity conservation, Trends Ecol. Evol., 3297, P726–733, https://doi.org/10.1016/j.tree.2024.04.003, 2024.
Westerberg, L., Berglund, H. L., Jonason, D., and Milberg, P.: Color pan traps often catch less when there are more flowers around, Ecol. Evol., 11, 3830–3840, https://doi.org/10.1002/ece3.7252, 2021.
Westphal, C., Bommarco, R., Carre, G., Lamborn, E., Morison, N., Petanidou, T., Potts, S., Roberts, S. P. M., Szentgyoryi, H., Tscheulin, T., Vassière, B. E., Woyciechowski, M., Biesmeijer, J., Kunin, W. E., Settele, J., and Steffan-Dewenter, I.: Measuring bee diversity in different European habitats and biogeographical regions, Ecol. Monogr., 78, 653–671, https://doi.org/10.1890/07-1292.1, 2008.
Wickham, H.: ggplot2: Elegant Graphics for Data Analysis, Springer-Verlag New York, ISBN 978-3-319-24277-4, https://ggplot2.tidyverse.org (last access: 16 March 2025), 2016.
Wood, T. J., Gibbs, J., Rothwell, N., Wilson, J. K., Gut, L., Brokaw, J., and Isaacs, R.: Limited phenological and dietary overlap between bee communities in spring flowering crops and herbaceous enhancements, Ecol. Appl., 28, 1924–1934, https://doi.org/10.1002/eap.1789, 2018.
Pollinating insects are essential for crops and wild plants, but their populations are declining due to habitat loss. Here we compared two methods for sampling pollinators: insect nets and pan traps. Both methods were effective but captured different pollinators: nets collected more bumblebees, while pan traps caught more solitary bees. Data from each method also showed different responses to the landscape, suggesting that both methods are needed for better conservation strategies.
Pollinating insects are essential for crops and wild plants, but their populations are...