the Creative Commons Attribution 4.0 License.
the Creative Commons Attribution 4.0 License.
 | 13 Apr 2018
The relationships between biodiversity and ecosystem services and the effects of grazing cessation in semi-natural grasslands
Knut Anders Hovstad
Line Johansen
Land use change can affect biodiversity, and this has an impact on ecosystem services (ESs), but the relationships between biodiversity and ESs are complex and poorly understood. Biodiversity is declining due to the abandonment of extensively grazed semi-natural grasslands.
We therefore aim to explore relationships between biodiversity and ESs provided by extensively managed semi-natural grasslands. Focusing on vascular plant species richness, as well as the ESs fodder quantity, quality, and stability, allergy control, climate regulation, nutrient cycling, pollination, and aesthetic appreciation, we carried out botanical field surveys of 28 paired extensively grazed and abandoned semi-natural grassland plots, with four subplots of 4 m2 in each plot. The management of the semi-natural grasslands is and has been at low intensity. We calculated the influence of abandonment on the ES indicators, measured the correlation between the biodiversity measure of vascular plant species richness and ES indicators, and finally determined how the relationships between plant species richness and the ES indicators were affected by the cessation of the extensive management.
ES indicators are often, but not always, positively correlated with species richness. Cessation of extensive grazing has both negative and positive effects on ES indicators but the relationships between species richness and ES indicators are often different in extensively managed and abandoned semi-natural grasslands. The relationships between species richness and ES indicators are less pronounced in the extensively managed semi-natural grassland than for the abandoned. One possible reason for this outcome is high functional redundancy in the extensively managed semi-natural grasslands.
- Article
(1013 KB) - Full-text XML
- BibTeX
- EndNote


Ecosystem services (ESs) are benefits that people gain from ecosystems (Millennium Ecosystem Assessment, 2005). Biodiversity is the foundation for all ESs as it underpins ecosystem processes and functioning (Mace et al., 2012).
Biodiversity is, however, declining worldwide. One of the greatest threats to biodiversity today is land use change (Pereira et al., 2010). Vegetation in Europe has been influenced by millennia of human land use and is a mosaic of natural, semi-natural, and novel ecosystems such as forests, mires, grasslands, heathlands, parks, and gardens (Dodgshon and Olsson, 2007; Raatikainen et al., 2007; Shoji et al., 2011). Semi-natural grasslands have high biodiversity and are habitats for several threatened species (Doxa et al., 2010; Henriksen and Hilmo, 2015). However, as economy and technology have developed, low-input agricultural systems have been widely abandoned, which has resulted in the encroachment of shrub and forest into the open semi-natural habitats (Bignal and McCracken, 1996) and consequently degradation and fragmentation of semi-natural grasslands (Emanuelsson et al., 2009; Norderhaug and Johansen, 2011).
This raises concerns of whether the observation of decline in biodiversity will also be seen in ES delivery and consequently human wellbeing (Díaz et al., 2005). The relationship between biodiversity and ES provision is complex. High species richness is often positively related to ES provision (Balvanera et al., 2006; Cardinale et al., 2012; Harrison et al., 2014; Isbell et al., 2011; Lindemann-Matthies et al., 2010), but not always (Balvanera et al., 2006; Bullock et al., 2011; Haines-Young and Potschin, 2010; Mayfield et al., 2010). Several potential relationships between biodiversity and ESs have been proposed (Cardinale et al., 2006; Haines-Young and Potschin, 2010), but there is a need for knowledge about how to maintain or even optimize the delivery of ESs, identify and manage ES trade-offs, and conserve biodiversity (Harrison et al., 2014; Deng et al., 2016). We lack evidence about how cessation of extensive land use management influences ESs as well as sufficient understanding of how changes in biodiversity due to land use changes relate to both ESs and ecosystem functioning (Nagendra et al., 2013).
The main service provided by semi-natural grasslands is fodder production (quantity, quality, stability), but a range of other important ESs such as nutrient cycling, climate regulation, allergy control, pollination, and aesthetic appreciation are also provided (Anderson-Teixeira et al., 2012; Betts, 2000; Bullock et al., 2011; de Bello et al., 2010a; Duru et al., 2012; Ford et al., 2012; Lavorel et al., 2011; Pakeman, 2014; Totland et al., 2013; Vinge and Flø, 2015). Nutrient cycling provides maintenance of fertility and supports food, timber, and fuel production as well as important ecological processes important for all aspects of life (Lavelle et al., 2005). Carbon sequestration in plants and absorption of incoming solar radiation (albedo) will buffer local climate warming and thus regulate climate. Abundance of allergy-inducing pollen producers regulates pollen emissions in the air and thus also allergy control. High diversity and abundance of insects provide high delivery of pollination (Bullock et al., 2011) and pollination is an ecosystem service of vital importance for human wellbeing because of its importance for global food production (Potts et al., 2016). Cultural benefits from ecosystems as a source of wellbeing are also important. One of the sources of wellbeing is the aesthetical appreciation of the landscape and the vegetation characteristics within the landscape (de Bello et al., 2010a; Ford et al., 2012; Vinge and Flø, 2015).
In this study, the overall objective is to study the relationships between biodiversity and ESs and how such relationships are affected by grazing cessation. We aim to contribute empirical evidence about effects of ceased land use on indicators of eight ESs relevant for semi-natural grasslands and their relationships with plant species richness. We address the following questions: (1) how does abandonment of extensive sheep grazing management influence the ES indicators, if at all? (2) Are there any relationships between vascular plant species richness and, if so, how are the relationships affected by abandonment of extensive sheep grazing management?
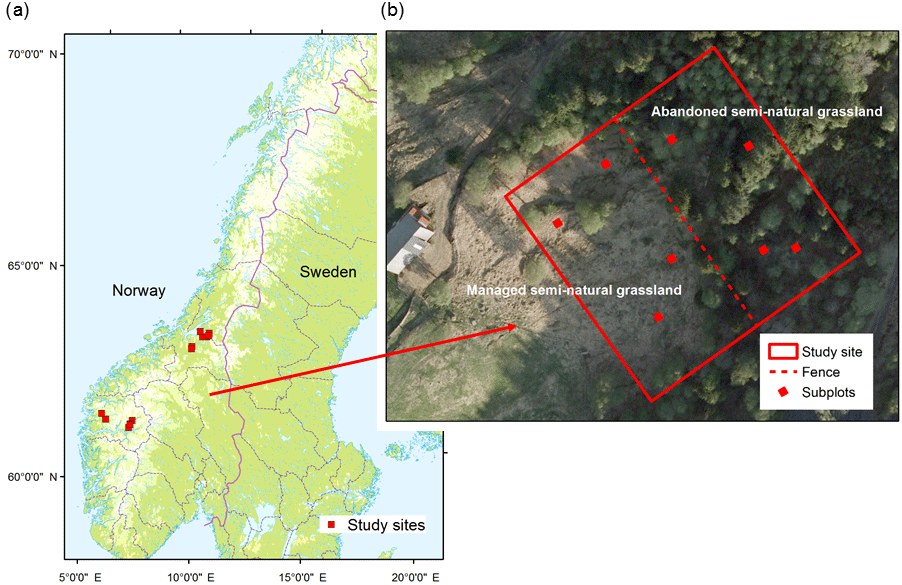
Figure 1The study design. (a) The locations of the 14 study sites, which each comprised of (b) two plots, including four subplots each. One of the plots was located in extensively managed semi-natural grassland and the other plot was located in the adjacent abandoned semi-natural grassland.
2.1 Study area and design
The study took place in boreal ecosystems in western (seven sites; 5∘33′50–7∘21′18 E, 61∘11′51–61∘33′50 N) and central Norway (seven sites; 10∘16′35–11∘16′52 E, 63∘09′24–63∘32′32 N). The study has a “space for time” design approach: 14 sites with paired plots (nplots=28), one in extensively managed semi-natural grassland and the other in abandoned semi-natural grassland (Fig. 1). The managed semi-natural grasslands were enclosed by fences and the areas ranged from 1 to 10.5 ha. In each site, the paired plots were located on either side of a fence (see Fig. 1), which was approximately perpendicular to the contour lines in the terrain. The maximum “vertical” lengths of the plots along the fences were 100 m and each of the plots extended a maximum of 50 m away from the fence. The size of the plots varied due to the varying sizes of the extensively managed semi-natural grasslands and ranged from 0.08 to 0.5 ha (mean size = 0.26 ha). Each plot contained four subplots (2 m× 2 m; n=110). Two of the subplots were randomly located in the lower part of the plot and the other two in the upper part. In the extensively managed semi-natural grassland, locations of the subplots were rejected when less than 10 m from the fence to avoid effects of the canopy in the neighbouring abandoned plot. The sites were selected on the basis of having a sheep pasture, representative of Norwegian semi-natural grasslands, with an abandoned area outside its fences.
The vegetation structure of the semi-natural grasslands was similar and none were overgrazed but the grazing management was a result of the farmer's practice and not set by the study.
Information about the management of the grasslands was gained through semi-structured interviews with the farmers (nfarmers=12). The farming system was the same for all farms in the study and represents typical Norwegian sheep husbandry. The sheep were held in sheds during winter and kept on semi-natural grasslands in the lowland only during spring and autumn. These semi-natural grasslands had not been ploughed, reseeded, or fertilized during the last few decades. During the summer from early June to mid-September, the sheep were let free to range and graze on alpine pastures. Differences in time of lambing, snow cover, and availability of forage in the mountain pastures create variation among years in the grazing period. We were therefore unable to define the total grazing pressure for several years on the semi-natural grasslands. However, due to the similar structure of the pastures we assumed the total grazing pressure during the last decade to be comparable among the sites. In some of the extensively managed semi-natural grasslands, shrubs and trees were cleared by the farmers to increase pasture quality. The abandoned semi-natural grasslands were at different successional stages moving towards forest. Time since abandonment ranged from 5 to 70 years.
2.2 Species richness
Semi-natural ecosystems in Norway have high biodiversity (Henriksen and Hilmo, 2015). One important aspect of biodiversity in semi-natural grasslands is the species richness of the community assemblage of vascular plants, which is extensively used as a biodiversity indicator in semi-natural grassland studies (de Bello et al., 2010b). In Norway, a decline in plant species richness has been observed in response to abandonment of extensive semi-natural grassland management (Wehn et al., 2017). We therefore chose vascular plant species richness as a measure of semi-natural grassland biodiversity.
The calculation of the vascular plant species richness used in this study was based on field surveys in which we registered all vascular plant species present in each of our subplots (4 m2; in total 170 species).
Table 1Ecosystem services (ES) provided by semi-natural grasslands. Vegetation characteristics (indicators) and measures used to indicate the ESs, the processes they affect, and the nature of the relationship (positive (+) or negative (−)) between the process.
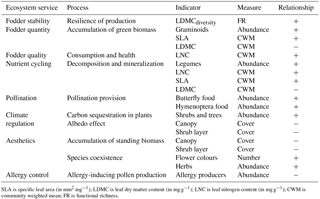
SLA is specific leaf area (in mm2 mg−1); LDMC is leaf dry matter content (in mg g−1); LNC is leaf nitrogen content (in mg g−1); CWM is community weighted mean; FR is functional richness.
2.3 Ecosystem services
Measurements of ESs are hard to achieve but characteristics of a biotope can be used as indicators of the ESs provided. To estimate the amount of, and changes in, ES provision, a range of indicators are used (Layke et al., 2012; Maes et al., 2014). Vegetation structure, species characteristics, and functional identity and/or diversity of a plant community underpin several ESs (Lavorel et al., 2011) and are therefore useful ES indicators (de Bello et al., 2010a). In this study, we used measures obtained from the botanical surveys as indicators of the ESs fodder quantity, fodder quality, fodder stability, nutrient cycling, climate regulation, allergy control, pollination, and aesthetic appreciation (Table 1). Abundance of each vascular plant species (eight cover categories: 0, > 0–1∕64, 1∕64–1∕32, 1∕32–1∕16, 1∕16–1∕8, 1∕8–1∕4, 1∕4–1∕2, 1∕2–1∕1) and percentage cover (0–100 %) of the canopy and shrub layers were registered for each subplot during the field survey.
2.3.1 Fodder quantity, quality, and stability
Fodder production depends on the quantity, quality, and stability of certain species (Bullock et al., 2011; Pakeman, 2014). High abundances of graminoids provide a high quantity of fodder (Lavorel et al., 2011) and high specific leaf area (SLA) and leaf nitrogen content (LNC) contribute positively to the quality of the fodder (de Bello et al., 2010a). Leaf dry matter content (LDMC) is negatively related to fodder quality (de Bello et al., 2010a; Pakeman, 2014), but a high range of LDMC in a plant community indicates fodder production resilience (Mouchet et al., 2010; Pakeman, 2011; Villeger et al., 2008).
To calculate indicators of fodder production we used trait data for all the recorded plants in the survey (Table 1). Growth form (graminoids) and LNC were extracted from the TRY database (Kattge et al., 2011; https://www.try-db.org/TryWeb/Home.php, last access: 15 Februar 2017) and SLA and LDMC from the LEDA database (Kleyer et al., 2008; http://www.uni-oldenburg.de/en/biology/landeco/research/projects/leda/, last access: 15 Februar 2017). The percentages of missing data of LDMC, SLA, and LNC were 8, 3, and 27 %, respectively. We replaced these missing data with values estimated based on other traits (such as LDMC, SLA, and/or LNC) with values present for that particular species using imputation methods as described by Taugourdeau et al. (2014). We then calculated community weighted means (CWMs) as suggested by Garnier et al. (2004), which is a commonly used approach to summarize the functional composition of single traits in a community, i.e. the functional identities of the semi-natural grasslands. CWM of SLA, LDMC, and LNC and functional richness (range of the trait values in the plant assemblages; Villeger et al., 2008) of LDMC (LDMCdiversity) were calculated for each subplot using the R package FD version 1.0-12 (Laliberté and Shipley, 2011). Total abundance of graminoids was calculated as the sum of the abundance for each graminoid in each subplot.
2.3.2 Nutrient cycling
We selected the vegetation characteristics CWM of SLA, LNC, and LDMC and abundance of legumes as indicators of decomposition and mineralization because these measures have been shown to impact the rate of nutrient cycling in grasslands. High abundance of legumes and high SLA and LNC but low LDMC have been shown to positively affect nutrient cycling rates (de Bello et al., 2010a; Duru et al., 2012).
To calculate abundance of legumes we classed the plant species registered according to whether they were legumes or not using information provided by the TRY database (Kattge et al., 2011) and summed the abundance of all legumes for each subplot.
2.3.3 Climate regulation
Carbon storage through carbon sequestration is larger in forested areas compared to in grasslands (Anderson-Teixeira et al., 2012) as carbon sequestration in shrub and tree species is high (de Bello et al., 2010a). However, forests absorb more energy compared to more “open” vegetation (Anderson-Teixeira et al., 2012; Betts, 2000); hence the more trees, the warmer it is at the earth surface (the albedo effect).
An indicator of carbon sequestration was calculated based on the eight cover classes of trunks of shrubs and trees in the subplots. We classed the plant species registered according to whether they were shrubs, trees, or not using information provided by the TRY database (Kattge et al., 2011) and summed the cover of the trunks of all shrubs and trees for each subplot. An indicator of albedo was calculated based on the information obtained through the surveys on the cover of the canopy and shrub layer.
2.3.4 Allergy control
A biotope's lack of allergy-inducing plants is here referred to as total allergy control. The indicator of allergy control used in this study was therefore abundance of allergy producers and, following de Bello et al. (2010a), the allergy control delivery was defined as the more allergy producers, the less control.
We categorized the recorded species as allergy-inducing plants or not based on Norwegian conditions (information provided by the Norwegian asthma and allergy association; https://www.naaf.no/fokusomrader/allergi-og-overfolsomhet/pollenallergi/, last access: 15 Februar 2017). The allergy producers registered in the surveys were grasses, birch (Betula spp.), hazel (Corylus avellana), and alder (Alnus incana) and the sum of the abundance of these species was calculated for each subplot.
2.3.5 Pollination
We assumed a direct link between the potential abundance of the pollinator species and their food plants and therefore defined two indicators of pollination: butterfly food and Hymenoptera food. Butterfly and Hymenoptera species are two of the most important and abundant taxa of pollinators in Norway, especially in semi-natural grasslands (Totland et al., 2013).
From the Biological Records Centre's database of insects and their food plants (DBIF; http://www.brc.ac.uk/dbif/homepage.aspx, last access: 15 Februar 2017), we extracted information about species used as food plants by Hymenoptera and butterfly species (both for immature stages and adults) and calculated the indicators of butterfly and Hymenoptera food as the sum of the abundance of the food plants for each insect category for each subplot.
2.3.6 Aesthetic appreciation
How characteristics of the vegetation are valued is largely subjective (Bryce et al., 2016). In this study we evaluated aesthetic appreciation based on personal communication with stakeholders during field surveys in cultural landscapes in Norway (semi-structured interviews with the farmers in this study as well as stakeholders in other projects; see Wehn et al., 2018) and relevant literature (de Bello et al., 2010a; Ford et al., 2012; Vinge and Flø, 2015). High abundance of herbs and diversity of plants provides higher numbers of flower types and colours which are aesthetically appreciated (de Bello et al., 2010a; Ford et al., 2012). Two indicators of aesthetical appreciation included in our study are therefore abundance of herbs and number of flower colours. Flower colours were extracted from the Norwegian Flora (Lid and Lid, 2005) and growth forms from the TRY database (Kattge et al., 2011).
Together with Sweden and Finland, Norway is the most forested country in Europe (39 % of the land; Statistics Norway, 2008, https://www.ssb.no, last access: 15 Februar 2017). The areas of open vegetation types in cultural landscapes are in decline (Olsson et al., 2000; Wehn, 2009) but these are highly appreciated by Norwegians as they are part of the cultural heritage of the rural communities (Vinge and Flø, 2015; Wehn et al., 2018). Percent cover of canopy and shrub layer was therefore included as indicators of aesthetic appreciation. The less the cover, the higher the appreciation. The measures of cover of canopy and shrub layer obtained from each subplot during the surveys are used as indicators.
2.4 Data analysis
The mean value of species richness and each ES indicator was calculated for each plot and used as observational units in the statistical analyses.
Table 2Effect of abandonment on ecosystem service (ES) indicators. Mean differences between extensively managed and abandoned semi-natural grasslands, test statistics of the difference between the two land use classes (t), significance level of the t (Pt), test statistics of the differences along time since abandonment (F), and significance level of the F (PF). t and Pt are based on paired t tests or Wilcoxon signed rank test1. F and PF are based on linear regression.
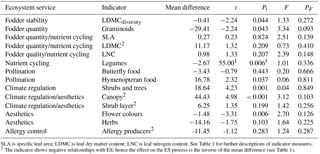
SLA is specific leaf area; LDMC is leaf dry matter content; LNC is leaf nitrogen content. See Table 1 for further descriptions of indicator measures. 2 The indicator shows negative relationships with ES; hence the effect on the ES process is the inverse of the mean difference (see Table 1).
2.4.1 Effect of abandonment on ES indicators
To establish whether cessation of sheep grazing management had any impact on each of the ES indicators we compared the values of each ES indicator in the managed and abandoned semi-natural grasslands using paired sample t tests or Wilcoxon signed rank tests (if the differences were not normally distributed). Then we investigated whether the difference varied with time since abandonment by using linear regression models which included the difference in species richness or each of the ES indicators between the two land use classes as a response variable and time (years) since abandonment in the abandoned semi-natural grasslands in the sites as the explanatory variable. Legume abundance was square root transformed to meet the assumption of normal distribution.
2.4.2 Relationships between species richness and ES indicators
To achieve the main aim of this study, which is to established knowledge about the relationships between vascular plant species richness and ES indicators, we first calculated and tested the correlations between number of vascular plant species and each ES indicator across all plots using the Pearson correlation or Spearman rank correlation coefficient (if assumptions for the Pearson correlation were not met).
In subsequent analyses we tested whether land use influenced the relationships between species richness and the ES indicators. First, we calculated the correlation coefficients (Pearson if assumptions were met, Spearman rank if not) and tested their significance in each of the two land use classes – managed and abandoned. Then, we compared the relationships in these two land use classes. We compared the correlation coefficients directly, by calculating the differences between the correlation coefficients in the two land use classes, but we also compared models of the relationships in the two land use classes using likelihood ratio statistics. These models were based on the model II regression approach because we aim to investigate the relationship between two random variables (each ES indicator (explanatory) and species richness (response)) and not the effect of one variable on the other. The model II regression models were developed by the standardized major axis estimation as described by Legendre and Legendre (2012) using the R package smatr version 3.4-3 (Warton et al., 2012).
All modelling procedures were performed in the R 3.1.1 software (R Core Team, 2015).
Table 3Correlation (r) between plant species richness and ecosystem service (ES) indicators. Test statistics (t) and significance of the correlation (p) based on Pearson or Spearman1 correlation tests.
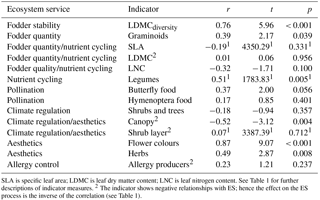
SLA is specific leaf area; LDMC is leaf dry matter content; LNC is leaf nitrogen content. See Table 1 for further descriptions of indicator measures. 2 The indicator shows negative relationships with ES; hence the effect on the ES process is the inverse of the correlation (see Table 1).
Table 4Different relationships between plant species richness and ecosystem service (ES) indicators in extensively managed (m) and abandoned (a) semi-natural grasslands. The correlation (r) between plant species richness and ES indicators, the test statistics (t), and significance of the correlation (p) based on Pearson or Spearman1 correlation tests and the test statistics (χ2 and pslopes) of likelihood ratio tests that compare the relationships (slopes of standardized major axis models) in the two land use classes.
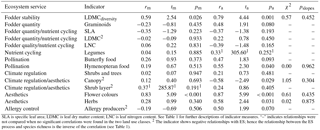
SLA is specific leaf area; LDMC is leaf dry matter content; LNC is leaf nitrogen content. See Table 1 for further descriptions of indicator measures. “–” indicates relationships were not compared when no significant correlations were found in the two land use classes. 2 The indicator shows negative relationships with ES; hence the relationship between the ES process and species richness is the inverse of the correlation (see Table 1).
Five (out of 14) of the ES indicators showed higher ES provision in the extensively managed compared to the abandoned semi-natural grasslands and two showed higher ES provision in the abandoned semi-natural grasslands (Table 2). Half of the ES indicators, however, showed no difference. Time since abandonment does not influence species richness of vascular plants (F=0.94; p=0.350) or the ES indicators (Table 2). Six of the 14 ES indicators did positively correlate with plant species richness (Table 3). The other indicators showed no significant correlations with vascular plant species richness.
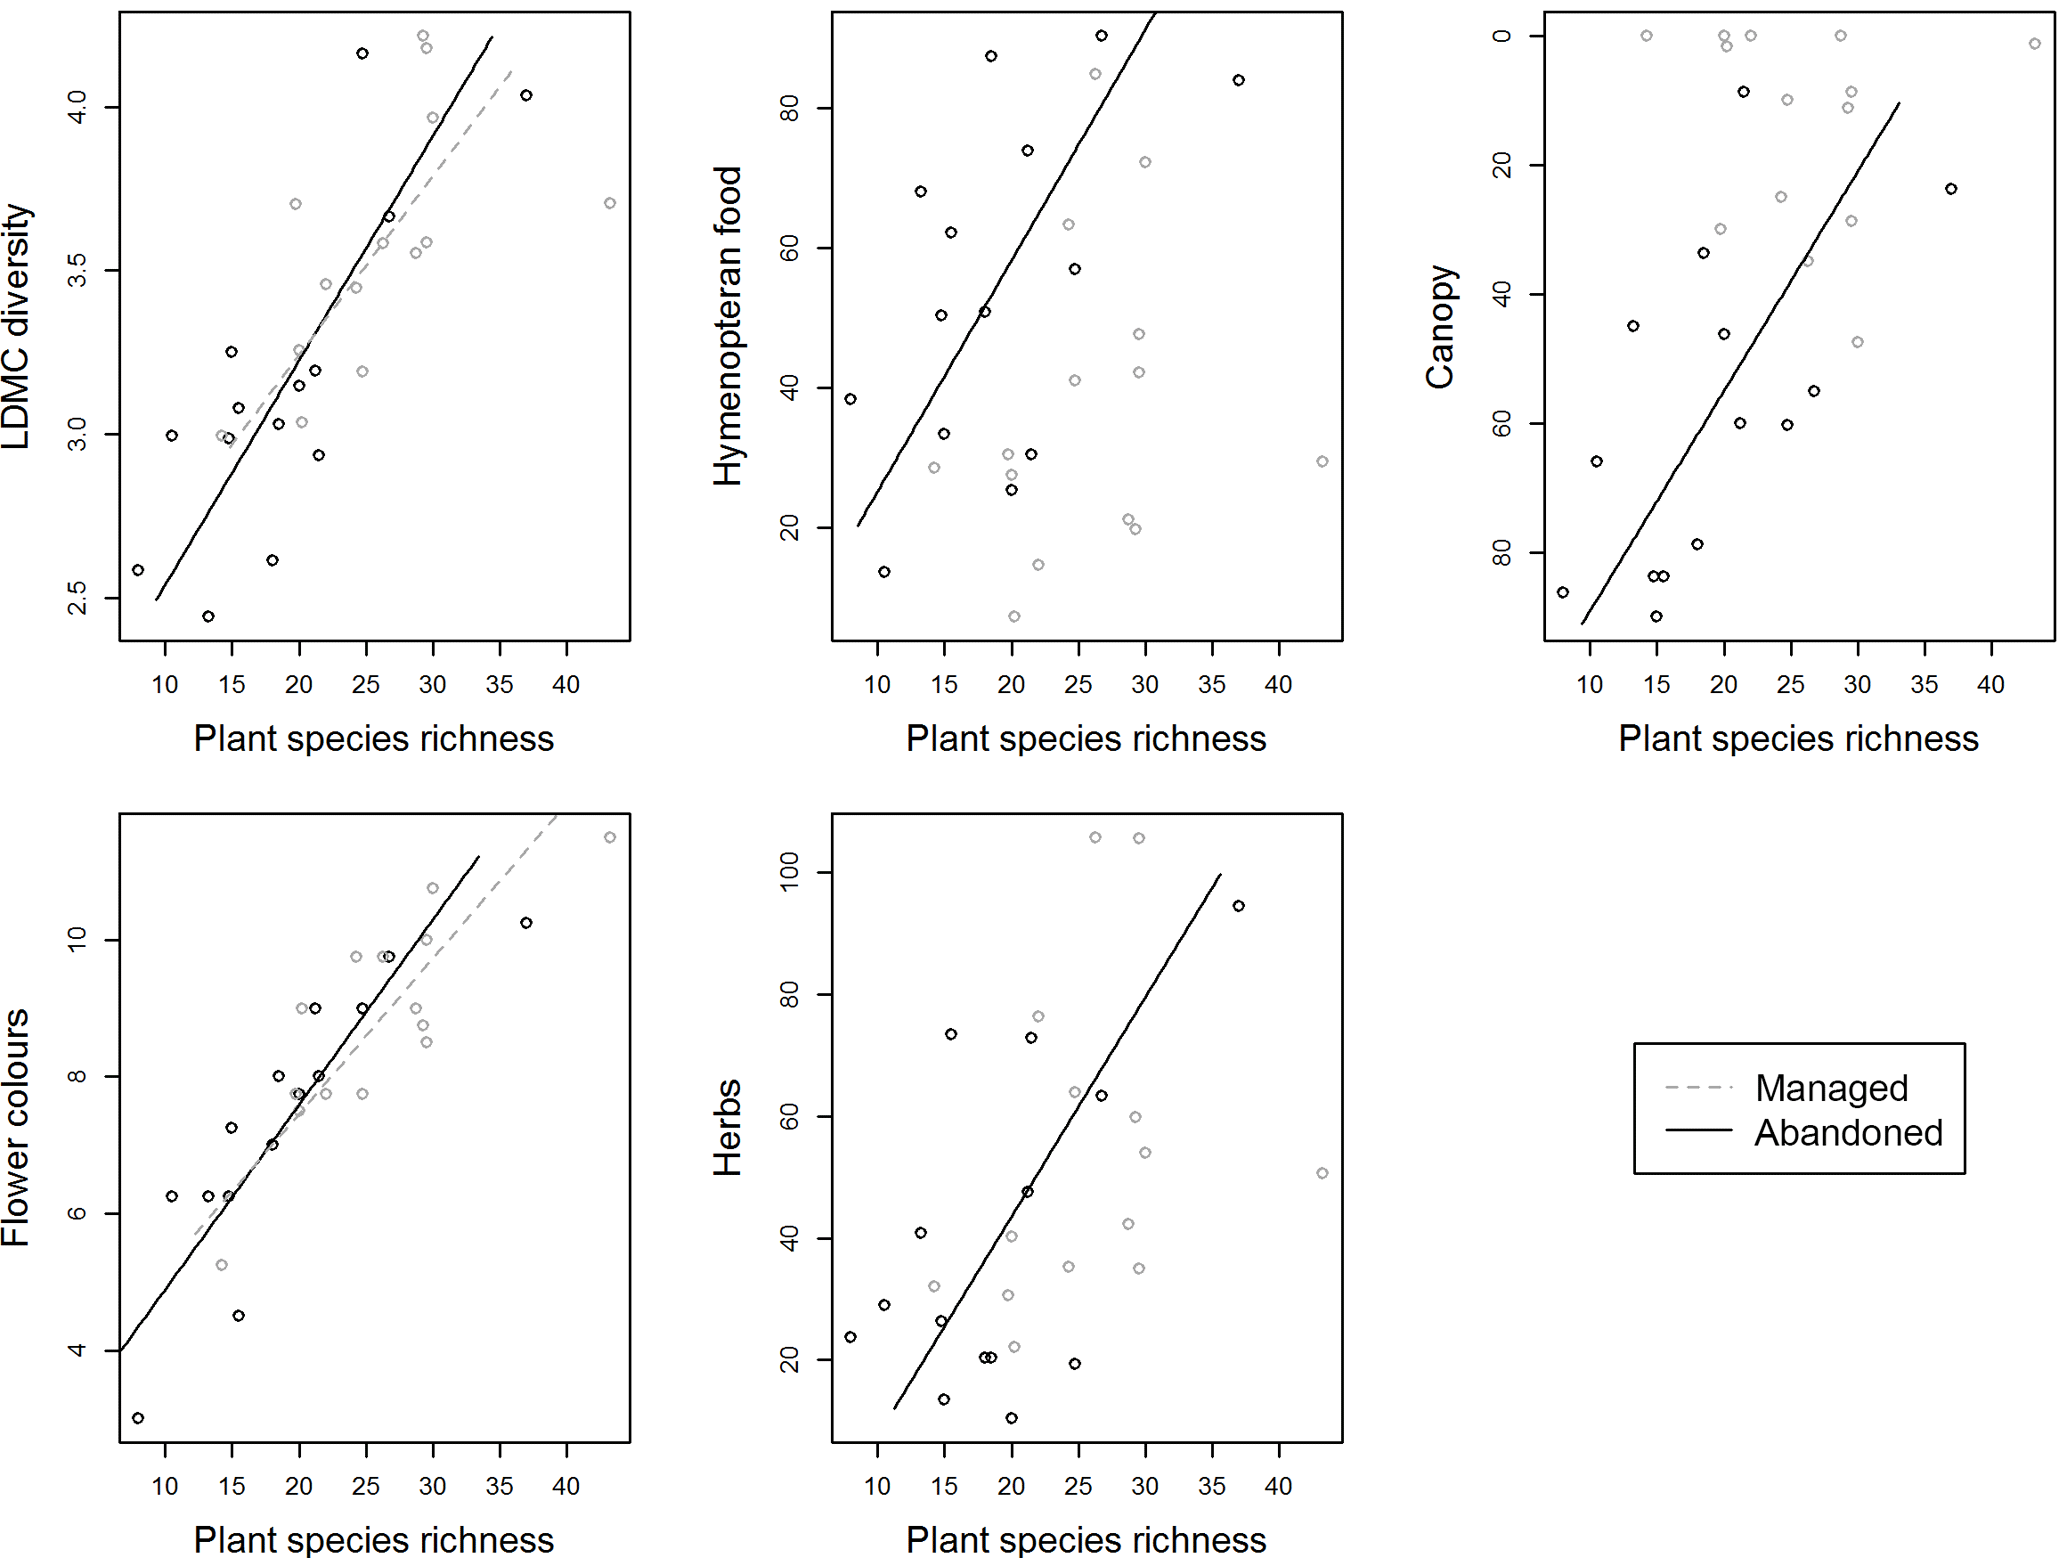
Figure 2Relationships between plant species richness and ecosystem service (ES) indicators in extensively managed and abandoned semi-natural grasslands. Slopes are calculated based on standardized major axis modelling with species richness and each of the ES indicators as the targets and land use (managed and abandoned) as a fixed predictor. Only those relationships that significantly correlate in one or both land use classes (see Table 4) are shown. See descriptions of ES indicators in Table 1.
The analyses indicated that in addition to influencing the ES indicators directly, land use also influenced the relationship between plant species richness and ES indicators. The relationships between species richness and the ES indicators were not significantly different in the two land use classes but for three ES indicators the correlation coefficients in the extensively managed (rm) and abandoned semi-natural grassland (ra) differed by more than 0.5 (Table 4). In the abandoned semi-natural grasslands we observed that species richness was negatively related with the indicator of allergy control (abundance of allergy producers) while in the extensively managed semi-natural grasslands this relationship was positive (Table 4). For one of the indicators of aesthetics and climate regulation (canopy cover) and one of the indicators of fodder quantity (graminoid abundance), we observed the opposite. In the abandoned semi-natural grasslands there were positive relationships between these two indicators and species richness while in the managed there were negative relationships (Table 4). Further, only two of the ES indicators showed significant correlations with plant species richness in the extensively managed semi-natural grasslands while five showed significant correlations in the abandoned semi-natural grasslands. The indicator of fodder stability (the diversity of leaf dry matter content, LDMCdiversity) and one of the indicators of aesthetics (number of flower colours) correlated positively with species richness in the extensively managed semi-natural grasslands. In the abandoned semi-natural grasslands, species richness was positively related with three of the indicators of aesthetics (abundance of herbs, number of flower colours, and canopy cover, which also indicate climate regulation), the indicator of fodder stability (LDMCdiversity), and one of the indicators of pollination (abundance of Hymenoptera food plants). This mean that the values of three ES indicators did not vary along the species richness gradient in the extensively managed semi-natural grasslands even though they varied along this gradient in the abandoned semi-natural grasslands (Fig. 2).
Extensive grazing management in semi-natural grasslands during a few weeks in spring and autumn promotes plant species richness. This has been reported previously (Norderhaug and Johansen, 2011) and verified experimentally in this study area (Wehn et al., 2017). Sheep grazing cessation has consequently decreased vascular plant species richness and this study shows that several vegetation measures related to ES delivery also decrease, although not all. The presumption is that species richness is positively correlated with ES provision (Mace et al., 2012). This study verifies that this is the general trend, but the study also shows that drivers such as extensive land use management influence this relationship.
Functional identity and diversity underpin ecosystem processes and are therefore some of the most relevant measures of ESs (de Bello et al., 2010a; Lavorel et al., 2011). Functional diversity can be linearly and positively related with species richness (Tilman et al., 1997) but a range of other trajectories is possible (Harrison et al., 2014). Mayfield at al. (2010) suggest several trajectories where one (the sampling effect hypotheses) is a positive relationship which would occur if new trait values accumulate linearly whenever a new species arrives in a community. We observed this response for the vegetation measure number of flower colours (flower colours) and the diversity of leaf dry matter content (LDMCdiversity). Flower colours and LDMCdiversity did correlate positively with vascular plant species both when analysing across all plots and when analysing managed and abandoned plots separately.
The rationale for the semi-natural grasslands is fodder production. Hence, continuous low-intensity semi-natural grassland management will give high quality and quantity of fodder because the land use system facilitates high-quality grazing plants such as grasses. This is demonstrated in the studied plots as abundance of graminoids being much higher in the managed semi-natural grasslands compared to the abandoned plots. The high species richness in semi-natural grassland is a positive side effect of extensive management. Harrison et al. (2014) document that for some ESs, high biodiversity is detrimental and, according to Mayfield et al. (2010), a decrease in functional diversity with increasing species richness is a relatively unlikely process in nature. But, as pointed out by Harrison et al. (2014), this can occur when a decline in species richness allows invasion of functional types, which in agricultural land are promoted to increase production. We did not find any significant negative relations between the indicators of fodder quantity or quality and plant species richness in the extensively managed semi-natural grasslands, but note negative trends for abundance of graminoids and CWM of SLA.
Loss of species affects the functioning of ecosystems, but the magnitude of the effect is determined by species composition and what species are lost (Cardinale et al., 2006). Mayfield et al. (2010) suggest that if there is high functional redundancy, a change in environmental filters might cause a loss in species richness but not of functional diversity or identity, as functional identity is influenced by the distribution of a trait's values (Díaz et al., 2007). This happens if the functional values of the species lost are distributed randomly in functional space. For the investigated ES indicators, this might be the case for CWM of SLA, LDMC, LNC, abundance of butterfly food, and cover of shrub layer which are neither influenced by land use abandonment nor correlated with species richness. Functional redundancy might increase the ability of a community to resist changes as there will be species with similar functional capacities that can substitute for ones lost (McCann, 2000). For example, as SLA, LDMC, and LNC show no change even when species richness declines, the ESs of nutrient turnover and fodder quantity seem to be robust in our study sites regardless of changes in land use.
Generally, across all plots, the relationships between ES indicators and plant species richness were positive. However, the ES indicators' abundance of herbs, cover of canopy, and abundance of Hymenoptera food were not significantly correlated with species richness in the extensively managed semi-natural grasslands, only in the abandoned semi-natural grasslands. The extensive management might thus contribute to the functional redundancy (no change in ES delivery along the species richness gradient) because this low-intensity disturbance limit potential dominating species (Grime, 2006). Most species in the extensive semi-natural grasslands are herbs and grasses that have similar ecological effects and our result is consistent with other studies that state that functional redundancy in and among semi-natural grasslands is high (Kahmen, 2009). In addition, as similar grazing management is practiced across all semi-natural grasslands to optimize fodder production, other environmental factors such as microclimate potentially vary more between the abandoned semi-natural grasslands compared to between the extensively managed semi-natural grasslands. The difference in functional redundancy between the managed and the abandoned semi-natural grassland could therefore also be explained by small variation within environmental factors that have the potential to filter the functional measures between the extensively semi-natural grasslands.
Abandonment of extensive management imposes a negative effect on both species richness and some ESs. The results of this study document that as provision of some ecosystem services are high in abandoned and forested areas, semi-natural grasslands managed by extensive land use practices such as sheep grazing during spring and autumn deliver other ecosystem services such as fodder quantity and stability, nutrient cycling, climate regulation through the albedo effect, and aesthetics, which are impaired when management is abandoned. Biodiversity is often positively correlated with ecosystem service provision, but not always. Cessation of extensive sheep grazing management influences not only plant species richness and ES indicators directly but also the relationships between species richness and ES indicators. The relationships between vascular plant species richness and ES indicators are less pronounced in the extensively managed semi-natural grasslands than for the abandoned semi-natural grasslands. One explanation of this is high levels of functional redundancy in extensively managed semi-natural grasslands.
The data are not publicly accessible in their present form, but can be shared by the authors upon request.
SW prepared the concept of the study, developed the ES indicators, performed the statistical analyses, wrote the manuscript, prepared the images, and checked the final version. KAH prepared the concept of the study, provided input to the statistical analysis, participated in the writing process, and checked the final version. LJ prepared the concept of the study, developed the ES indicators, provided input to the statistical analysis, participated in the writing process, and checked the final version.
The authors declare that they have no conflict of interest.
This study was part of project no. 208036/010 funded by the Norwegian
Research Council. The authors thank the landowners for granting them access
to the field sites, Synnøve Nordal Grenne, Per Vesterbukt, Liv Guri Velle,
Sigrun Aune, and På Thorvaldsen for field assistance, Simon Taugourdeau
for help during data curation and Cathy Jenks, Jan Bengtsson, and an
anonymous reviewer for helpful comments.
Edited by: Jutta Stadler
Reviewed by: Jan Bengtsson and one anonymous referee
Anderson-Teixeira, K. J., Snyder, P. K., Twine, T. E., Cuadra, S. V., Costa, M. H., and DeLucia, E. H.: Climate-regulation services of natural and agricultural ecoregions of the Americas, Nat. Clim. Change, 2, 177–181, 2012.
Balvanera, P., Pfisterer, A. B., Buchmann, N., He, J.-S., Nakashizuka, T., Raffaelli, D., and Schmid, B.: Quantifying the evidence for biodiversity effects on ecosystem functioning and services, Ecol. Lett., 9, 1146–1156, 2006.
Betts, R. A.: Offset of the potential carbon sink from boreal forestation by decreases in surface albedo, Nature, 408, 187–190, 2000.
Bignal, E. M. and McCracken, D. I.: Low-intensity farming systems in the conservation of the countryside, J. Appl. Ecol., 33, 413–424, 1996.
Bryce, R., Irvine, K. N., Church, A., Fish, R., Ranger, S., and Kenter, J. O.: Subjective well-being indicators for large-scale assessment of cultural ecosystem services, Ecosyst. Serv., 21, 258–269, 2016.
Bullock, J. M., Jefferson, R. G., Blackstock, T. H., Pakeman, R. J., Emmett, B. A., Pywell, R. J., Grime, J. P., and Silvertown, J.: Semi-natural Grasslands in UK National Ecosystem Assessment, chap. 6, in: The UK National Ecosystem Assessment Technical Report, UNEP-WCMC, Cambridge, 2011.
Cardinale, B. J., Srivastava, D. S., Duffy, J. E., Wright, J. P., Downing, A. L., Sankaran, M., and Jouseau, C.: Effects of biodiversity on the functioning of trophic groups and ecosystems, Nature, 443, 989–992, 2006.
Cardinale, B. J., Duffy, J. E., Gonzalez, A., Hooper, D. U., Perrings, C., Venail, P., Narwani, A., Mace, G. M., Tilman, D., and Wardle, D. A.: Biodiversity loss and its impact on humanity, Nature, 486, 59–67, 2012.
de Bello, F., Lavorel, S., Diaz, S., Harrington, R., Cornelissen, J. H. C., Bardgett, R. D., Berg, M. P., Cipriotti, P., Feld, C. K., Hering, D., da Silva, P. M., Potts, S. G., Sandin, L., Sousa, J. P., Storkey, J., Wardle, D. A., and Harrison, P. A.: Towards an assessment of multiple ecosystem processes and services via functional traits, Biodivers. Conserv., 19, 2873–2893, 2010a.
de Bello, F., Lavorel, S., Gerhold, P., Reier, Ü., and Pärtel, M.: A biodiversity monitoring framework for practical conservation of grasslands and shrublands, Biol. Conserv., 143, 9–17, 2010b.
Deng, X., Li, Z., and Gibson, J.: A review on trade-off analysis of ecosystem services for sustainable land-use management, J. Geogr. Sci., 26, 953–968, 2016.
Díaz, S., Tilman, D., Fargione, J., Chapin III, F. S., Dirzo, R., and Ktzberber, T.: Biodiversity regulation of ecosystem services, Trends and conditions, in: Ecosystems and Human Well-being; Current State & Trends, edited by: Hassan, R., Scholes, R., and Ash, N., Island Press, Washington, DC, 297–329, 2005.
Díaz, S., Lavorel, S., de Bello, F., Quétier, F., Grigulis, K., and Robson, T. M.: Incorporating plant functional diversity effects in ecosystem service assessments, P. Natl. Acad. Sci. USA, 104, 20684–20689, 2007.
Dodgshon, R. A. and Olsson, E. G. A.: Seasonality in European mountain areas: a study in human ecology, in: Seasonal landscapes, Springer, 85–101, 2007.
Doxa, A., Bas, Y., Paracchini, M. L., Pointereau, P., Terres, J. M., and Jiguet, F.: Low-intensity agriculture increases farmland bird abundances in France, J. Appl. Ecol., 47, 1348–1356, 2010.
Duru, M., Theau, J. P., and Cruz, P.: Functional diversity of species-rich managed grasslands in response to fertility, defoliation and temperature, Basic Appl. Ecol., 13, 20–31, 2012.
Emanuelsson, U., Arding, M., and Petersson, M.: The Rural Landscapes of Europe: How Man has Shaped European Nature, Formas, Stockholm, 2009.
Ford, H., Garbutt, A., Jones, D. L., and Jones, L.: Impacts of grazing abandonment on ecosystem service provision: Coastal grassland as a model system, Agr. Ecosyst. Environ., 162, 108–115, 2012.
Garnier, E., Cortez, J., Billes, G., Navas, M. L., Roumet, C., Debussche, M., Laurent, G., Blanchard, A., Aubry, D., Bellmann, A., Neill, C., and Toussaint, J. P.: Plant functional markers capture ecosystem properties during secondary succession, Ecology, 85, 2630–2637, 2004.
Grime, J. P.: Plant Strategies, Vegetation Processes, and Ecosystem Properties, John Wiley & Sons, 2006.
Haines-Young, R. and Potschin, M.: The links between biodiversity, ecosystem services and human well-being, in: Ecosystem Ecology: a new synthesis, Ecological Reviews, Cambridge University Press, 110–139, 2010.
Harrison, P., Berry, P., Simpson, G., Haslett, J., Blicharska, M., Bucur, M., Dunford, R., Egoh, B., Garcia-Llorente, M., and Geamănă, N.: Linkages between biodiversity attributes and ecosystem services: a systematic review, Ecosyst. Serv., 9, 191–203, 2014.
Henriksen, S. and Hilmo, O.: Norsk rødliste for arter 2015 (Norwegian Red List for Species), The Norwegian Biodiversity Information Centre, Norway, 2015.
Isbell, F., Calcagno, V., Hector, A., Connolly, J., Harpole, W. S., Reich, P. B., Scherer-Lorenzen, M., Schmid, B., Tilman, D., van Ruijven, J., Weigelt, A., Wilsey, B. J., Zavaleta, E. S., and Loreau, M.: High plant diversity is needed to maintain ecosystem services, Nature, 477, 199–202, 2011.
Kahmen, A.: Biodiversity and Ecosystem Functioning of Selected Terrestrial Ecosystems: Grasslands, in: Biodiversity: Structure and Function, Volume 1: Encyclopedia of Life Support Systems (EOLSS), edited by: Barthlott, W., Linsenmair, K. E., and Porembski, S., UNESCO, 117–128. 2009.
Kattge, J., Diaz, S., Lavorel, S., Prentice, I., Leadley, P., Bönisch, G., Garnier, E., Westoby, M., Reich, P. B., and Wright, I.: TRY–a global database of plant traits, Glob. Change Biol., 17, 2905–2935, 2011.
Kleyer, M., Bekker, R., Knevel, I., Bakker, J., Thompson, K., Sonnenschein, M., Poschlod, P., Van Groenendael, J., Klimeš, L., and Klimešová, J.: The LEDA Traitbase: a database of life-history traits of the Northwest European flora, J. Ecol., 96, 1266–1274, 2008.
Laliberté, E. and Shipley, B.: FD: measuring functional diversity from multiple traits, and other tools for functional ecology, R package version 1.0-12, available at: http://CRAN.R-project.org/package=FD (last access: 4 May 2016), 2011.
Lavelle, P., Dugdale, R., and Scholes, R.: Nutrient cycling, in: Ecosystems and Human Well-being: Current State & Trends, edited by: Hassan, R., Scholes, R., and Ash, N., Island Press, 2005.
Lavorel, S., Grigulis, K., Lamarque, P., Colace, M. P., Garden, D., Girel, J., Pellet, G., and Douzet, R.: Using plant functional traits to understand the landscape distribution of multiple ecosystem services, J. Ecol., 99, 135–147, 2011.
Layke, C., Mapendembe, A., Brown, C., Walpole, M., and Winn, J.: Indicators from the global and sub-global Millennium Ecosystem Assessments: An analysis and next steps, Ecol. Indic., 17, 77–87, 2012.
Legendre, P. and Legendre, L. F.: Numerical ecology, Elsevier, 2012.
Lid, J. and Lid, D.: Norsk flora, 7 utgåve ved R, Elven, Det Norske Samlaget, Oslo, Norway, 2005.
Lindemann-Matthies, P., Junge, X., and Matthies, D.: The influence of plant diversity on people's perception and aesthetic appreciation of grassland vegetation, Biol. Conserv., 143, 195–202, 2010.
Mace, G. M., Norris, K., and Fitter, A. H.: Biodiversity and ecosystem services: a multilayered relationship, Trends Ecol. Evol., 27, 19–26, 2012.
Maes, J., Teller, A., Erhard, M., Murphy, P., Paracchini, M. L., Barredo, J. I., Meiner, A., Grizzetti, B, Cardoso, A., Somma F., Petersen, J.-E., Meiner, A., Gelabert, E. R., Zal, N., Kristensen, P., Bastrup-Birk, A., Biala, K., Romao, C., Piroddi, C., Egoh, B., Fiorina, C., Santos, F., Naruševičius, V., Verboven, J., Pereira, H., Bengtsson, J., Gocheva, K., Marta-Pedroso, C., Snäll, T., Estreguil, C., San Miguel, J., Braat, L., Grêt-Regamey, A., Perez-Soba, M., Degeorges, P., Beaufaron4, G. Lillebø, A., Malak, D. A., Liquete, C., Condé, S, Moen, J., Östergård, H., Czúcz, B., Drakou, E. G., Zulian, G., Lavalle, C., Meiner, A.:: Mapping and assessment of ecosystems and their services indicators for ecosystem assessments under action 5 of the EU biodiversity strategy to 2020: 2nd report-final, European Commission, February 2014.
Mayfield, M. M., Bonser, S. P., Morgan, J. W., Aubin, I., McNamara, S., and Vesk, P. A.: What does species richness tell us about functional trait diversity? Predictions and evidence for responses of species and functional trait diversity to land-use change, Global Ecol. Biogeogr., 19, 423–431, 2010.
McCann, K. S.: The diversity–stability debate, Nature, 405, 228–233, 2000.
Millennium Ecosystem Assessment: Ecosystems and human well-being: desertification synthesis, World Resources Institute, 2005.
Mouchet, M. A., Villeger, S., Mason, N. W. H., and Mouillot, D.: Functional diversity measures: an overview of their redundancy and their ability to discriminate community assembly rules, Funct. Ecol., 24, 867–876, 2010.
Nagendra, H., Reyers, B., and Lavorel, S.: Impacts of land change on biodiversity: making the link to ecosystem services, Curr. Opin. Env. Sust., 5, 503–508, 2013.
Norderhaug, A. and Johansen, L.: Semi-natural sites and boreal heaths, in: The 2011 Norwegian Red List for Ecosystems and Habitat Types, edited by: Lindgaard, A. and Henriksen, S., Norwegian Biodiversity Information Centre, Trondheim, Norway, 2011.
Olsson, E. G. A., Austrheim, G., and Grenne, S. N.: Landscape change patterns in mountains, land use and environmental diversity, Mid-Norway 1960–1993, Landscape Ecol., 15, 155–170, 2000.
Pakeman, R. J.: Multivariate identification of plant functional response and effect traits in an agricultural landscape, Ecology, 92, 1353–1365, 2011.
Pakeman, R. J.: Leaf dry matter content predicts herbivore productivity, but its functional diversity is positively related to resilience in grasslands, PLoS ONE, 9, e101876, https://doi.org/10.1371/journal.pone.0101876, 2014.
Pereira, H. M., Leadley, P. W., Proença, V., Alkemade, R., Scharlemann, J. P., Fernandez-Manjarrés, J. F., Araújo, M. B., Balvanera, P., Biggs, R., and Cheung, W. W.: Scenarios for global biodiversity in the 21st century, Science, 330, 1496–1501, 2010.
Potts, S. G., Imperatriz-Fonseca, V., Ngo, H., Biesmeijer, J., Breeze, T. D., Dicks, L., Garibaldi, L., Hill, R., Settele, J., and Vanbergen, A.: Summary for policymakers of the assessment report of the Intergovernmental Science-Policy Platform on Biodiversity and Ecosystem Services on pollinators, pollination and food production, Intergovernmental Science-Policy Platform on Biodiversity and Ecosystem Services, Bonn, Germany, 2016.
Raatikainen, K. M., Heikkinen, R. K., and Pykälä, J.: Impacts of local and regional factors on vegetation of boreal semi-natural grasslands, Plant Ecology, 189, 155–173, 2007.
R Core Team: R: A Language and Environment for Statistical Computing, R Foundation for Statistical Computing, Vienna, Austria, https://www.R-project.org/ (last access: 15 Februar 2017), 2015.
Shoji, A., Hayashi, H., Kohyama, K., and Sasaki, H.: Effects of horse grazing on plant species richness and abundance of Iris setosa in a boreal semi-natural grassland, Japan, Grassl. Sci., 57, 1–8, 2011.
Taugourdeau, S., Villerd, J., Plantureux, S., Huguenin-Elie, O., and Amiaud, B.: Filling the gap in functional trait databases: use of ecological hypotheses to replace missing data, Ecol. Evol., 4, 944–958, 2014.
Tilman, D., Knops, J., Wedin, D., Reich, P., Ritchie, M., and Siemann, E.: The influence of functional diversity and composition on ecosystem processes, Science, 277, 1300–1302, 1997.
Totland, Ø., Hovstad, K. A., Ødegaard, F., and Åström, J.: State of knowledge regarding insect pollination in Norway – the importance of the complex interaction between plants and insects, Norwegian Biodiversity Information Centre, Trondheim, Norway, 2013.
Villeger, S., Mason, N. W. H., and Mouillot, D.: New multidimensional functional diversity indices for a multifaceted framework in functional ecology, Ecology, 89, 2290–2301, 2008.
Vinge, H. and Flø, B. E.: Landscapes lost? Tourist understandings of changing Norwegian rural landscapes, Scand. J. Hosp. Tour., 15, 29–47, 2015.
Warton, D. I., Duursma, R. A., Falster, D. S., and Taskinen, S.: smatr 3–an R package for estimation and inference about allometric lines, Methods Ecol. Evol., 3, 257–259, 2012.
Wehn, S.: A map-based method for exploring responses to different levels of grazing pressure at the landscape scale, Agr. Ecosyst. Environ., 129, 177–181, 2009.
Wehn, S., Taugourdeau, S., Johansen, L., and Hovstad, K. A.: Effects of abandonment on plant diversity along environmental gradients, J. Veg. Sci., 28, 838–847, 2017.
Wehn, S., Burton, R., Riley, M., Johansen, L., Hovstad, K. A., and Rønningen, K.: Adaptive biodiversity management of semi-natural hay meadows: The case of West-Norway, Land Use Policy, 72, 259–269, 2018.