the Creative Commons Attribution 4.0 License.
the Creative Commons Attribution 4.0 License.
 | 15 Aug 2024
Geographic distribution of mammal diets
María Losada
Miguel Suárez-Couselo
Mar Sobral
The study of trophic interactions might be key to understanding the distribution of species on Earth. Particularly, the biogeography of heterotrophic species – such as mammals – could be strongly driven by trophic interactions (diet). Here, we map and discuss the division of dietary strategies (herbivory, frugivory, carnivory, etc.) of terrestrial mammals on a global scale. We analyzed the diet of 4854 extant terrestrial mammal species (with known range and diet data, representing 86.67 % of extant mammal species). We compiled species diets (EltonTraits database), species ranges (International Union for Conservation of Nature, IUCN, database) and climate data (WorldClim database) to illustrate how mammal dietary strategies are distributed across the globe. First, we performed a principal coordinate analysis (PCoA) with diet data. Second, we mapped the distribution of the main dietary strategies (PCoA axes) of terrestrial mammals globally. Third, we analyzed how climate relates to dietary strategies. We found that herbivory in mammals is more common in northern and desert areas, which corresponds to areas with lower minimum temperatures and lower precipitation. Mammals feeding on fruits and invertebrates (frugivory and invertivory) are more common in the tropics, which corresponds to areas with higher precipitation and higher minimum temperatures. Mammals feeding on seeds (granivory) are predominant in North America, Europe, Central Asia and Oceania, corresponding to areas with temperate environments. Carnivorous mammals are more common in the Northern Hemisphere and towards the poles, which corresponds to areas with lower minimum temperatures and less extreme dry periods. Terrestrial mammal diets show clear geographical patterns that can be partially explained by climate across the globe.
- Article
(1670 KB) - Full-text XML
-
Supplement
(5416 KB) - BibTeX
- EndNote


Biogeography studies the distribution of life on Earth, aiming to unveil large-scale evolutionary processes, dispersal constraints and geographic barriers to biodiversity. Additionally, it has focused on the links between climate and biodiversity, studying, for example, how climate shapes species ranges (Olson et al., 2009) or using the ongoing temperature rise to predict future risks for biodiversity (Harvell et al., 2002; Urban, 2015). However, given that species interact with each other, forming complex trophic networks, the study of trophic interactions might be key to understanding species distribution across the globe. Particularly, species occupying higher levels of the trophic pyramid (i.e., heterotrophic animals versus autotrophic plants) rely on the co-occurrence of others that are part of their diet, which can have deep impacts on the spatial distribution of biodiversity at large scales (Araújo and Rozenfeld, 2014).
Although climate is relevant to species distributions, the relationship between the geographic distribution of animals and climate might not be as direct as in the case of plants and might be mediated by dietary strategies (Mendoza and Araújo, 2022). Climate itself could be related to dietary strategies at the landscape scale (Badgley and Fox, 2000). Here, we aimed to illustrate the geographic patterns of mammal trophic interactions (dietary strategies) across the globe and their relationships to climate. Our hypothesis is that geographical patterns in mammal distribution should be partly driven by dietary strategies, i.e., food availability, which is simultaneously highly dependent on climate (White, 2008; Ramos Pereira et al., 2010; Ramos-Robles et al., 2018).
Therefore, food availability might be a key factor explaining the geographic distribution of mammals, as proposed in the classic article by Brown and Mauer (1989). Recent studies found a close link between global distribution of birds and their diets (Barnagaud et al., 2019). The diversity of available fruits also correlates with the diversity of frugivores (Kissling et al., 2007). Moreover, the biogeography of both mammal and bird trophic interactions follows a climatic gradient across the globe, and the same trophic interactions are maintained in areas with similar environmental conditions regardless of the biogeographic region (Mendoza and Araújo, 2022). Additionally, terrestrial mammal distribution was previously mapped for five trophic guilds (mammal eaters, insectivores, granivores, frugivores, folivores) using species-level data for 38 % of the terrestrial mammals and extrapolating to the genus level for the remaining 62 % (Kissling et al., 2014). The biogeography of dietary strategies followed by terrestrial mammals has been barely explored at a global scale, with only a few studies addressing this (Badgley and Fox, 2000; Kissling et al., 2014; Mendoza and Araújo, 2019, 2022; Price et al., 2012; Reuter et al., 2023).
Here, we mapped and discussed the division of dietary strategies of 4854 extant terrestrial mammals across the globe and explored their relationship to climate. The geographic distribution of terrestrial mammals might be mediated by trophic interactions and thus by their dietary preferences that relate to food availability, which is mostly driven by climate.
We obtained data of species dietary preferences from the EltonTraits 1.0 database (https://figshare.com/collections/EltonTraits_1_0_Species-level_foraging_attributes_of_the_world_s_birds_and_mammals/3306933/1, last access: 26 April 2024, Wilman et al., 2014; see Supplementary_Data_S1 in the Supplement) to assess the diet space of 4854 extant species of terrestrial mammals with known global ranges (86.67 % of a total of 5632 extant terrestrial mammal species recognized by the International Union for Conservation of Nature – IUCN, 2023), encompassing 26 orders (89.65 % of the 29 orders recognized by Solari and Baker, 2007, and all the orders recognized by IUCN, 2023) and 134 different families (97.8 % of the 137 families recognized; Solari and Baker, 2007).
The diet of mammals was described in the 10 dietary categories defined by the database used, based on their feeding preferences (Wilman et al., 2014): (1) invertebrates (Diet-Inv: from mollusks to flying insects through crustaceans or cephalopods), (2) mammals and birds (Diet-Vend: endotherm vertebrates), (3) reptiles and amphibians (Diet-Vect: ectotherm vertebrates), (4) fish (Diet-Vfish), (5) vertebrates in general (Diet-Vunk), (6) scavenging (Diet-Scav: garbage, offal, carcasses, trawlers, carrion), (7) fruits (Diet-Fruit: drupes), (8) nectar (Diet-Nect: nectar but also pollen, plant exudates), (9) seeds (Diet-Seed: including maize, nuts, spores, wheat, grains), and (10) other plant materials (Diet-PlantO: including grasses, weeds, lichens, mosses, crops, roots and tubers, bulbs, leaves, aquatic plants, seedlings, shrubs, tree barks). For each species, a value between 0 (it does not have this type of diet) and 1 (it exclusively has this type of diet) to each feeding preference category was assigned with the condition that the sum of the values of the 10 categories does not exceed 1. These diet categories are based on the different relative importance (%) in the species diet in 10 % steps (Wilman et al., 2014; see Supplementary_Data_S1).
We defined the diet space of terrestrial mammals using principal coordinate analysis (PCoA; Legendre and Legendre, 2012). PCoA, also known as classical multidimensional scaling (MDS), is a statistical technique commonly used in data analysis and visualization. PCoA allows us to explore and compare the dissimilarities or distances between samples, in our case, between mammal species. By transforming complex data into a lower-dimensional space, PCoA simplifies the interpretation of relationships and patterns among species, facilitating insights into the underlying structure of the data. This method is particularly valuable for revealing hidden structures and trends within multivariate datasets. Further, it is a very robust method for extreme values and fuzzy variables, which occur in our data on some occasions due to rare dietary strategies of some of the species. For the computation of the PCoA, we used the pcoa() function from the {ape} R package (Paradis and Schliep, 2019). To obtain the principal coordinate (PC) axes of the PCoA, we first calculated the pairwise species dissimilarity matrix from the diet data matrix. We used the dist.ktab() function of the {ade4} R package (Dray and Dufour, 2007), and we introduced the 10 dietary categories in percentage as a fuzzy variable, i.e., a function from an abstract space to the real line (Liu, 2002), using the prep.fuzzy() function of the {ade4} R package (Bougeard and Dray, 2018; Thioulouse et al., 2018). We tested the normality of all variables included and performed a Pearson's correlation test between the 10 dietary categories and score values of the first four PCoA axes (see Table S1 in the Supplement), using, respectively, the shapiro.test() and cor.test() functions of the {stats} R package (R Core Team, 2013).
We used the global species range data provided by the IUCN (2023, https://www.iucnredlist.org/search?permalink=244328c0-8a55-4921-a860-1b70ef673f95, last access: 26 April 2024) for 4854 out of 5632 extant terrestrial mammal species. Of a total of 5632 extant and possibly extant terrestrial mammals with a known IUCN range (excluding introduced, vagrant and assisted colonization ranges), 5592 species occurred more than three times worldwide, and only 4479 species showed the same scientific name as in the EltonTraits database (Wilman et al., 2014). After checking the nomenclature used by both databases, 4885 mammals in the EltonTraits database have the same nomenclature as IUCN, but 29 are possibly extinct or lack confirmed occurrence records in the IUCN (2023), and 2 species with incomplete diet data (Myzopoda aurita and Mystacina tuberculata), leaving 4854 extant terrestrial mammals considered in this study. We mapped the distribution of the dietary strategies of the extant terrestrial mammals with available global range by averaging the sum of the score values of the first four PCoA axes per species divided by the species richness within the 10 000 km2 grid cells, as in previous mapping studies of the global distribution of mammals (Sastre et al., 2009; Pompa et al., 2011). Only grid cells with more than 10 species present were considered to account for potential biases in the availability of taxonomic spatial data of terrestrial mammals, especially for possibly extinct, endangered or endemic species with deficient occurrence data in the IUCN that are excluded from our dataset (González-Suárez et al., 2012; Rocchini et al., 2023), which can affect our model predictability on the distribution of terrestrial mammal species and their dietary strategies. We used the rasterize() function to obtain the raster of the sum of the score values of each PCoA axis per grid cell (nlyr = 4) with more than 10 presences matching the polygons of the species IUCN ranges and after masking this multilayer raster with the raster of the species richness per grid cell using the mask() function, both with the {terra} R package (Hijmans, 2024). We showed the distribution of trophic interactions of terrestrial mammals across global maps.
First, we used regression tree models to explore the relationships between climate (using 19 bioclimatic variables from WorldClim version 2.1 climate data, https://www.worldclim.org/data/worldclim21.html, last access: 26 April 2024, Fick and Hijmans, 2017; see the list in Table S2 in the Supplement) and the rasterized terrestrial mammal dietary strategies (first four PCoA axes; see Supplementary_Data_S2). This step identified the main bioclimatic predictors explaining the variance in each PCoA axis value and simplified the relationships between climate and mammal dietary strategies. For the regression tree model construction, we used the rpart() function of the {rpart} R package (Therneau et al., 2013), with the parameter “minsplit = 5000” (number of cases for branch opening) to limit the number of branches per tree, generating models that explain variation at a global scale rather than local oscillations. This simplification improves our interpretation of the effects of climate (averaged values of all the bioclimatic variables in the respective grid cell) on the distribution of terrestrial mammal trophic interactions at the community level (rasterized PCoA axis score values averaged per grid cell, i.e., sum of the axis score values per species divided by species richness within the grid cell).
Second, we programmed four independent generalized linear models (GLMz's), each with one of the first four PCoA axes (rasterized mean score values, i.e., sum of the axis score values per species divided by species richness within the grid cell) as the response variable (with normal error distribution and identity link function), using the same bioclimatic variables selected in the regression tree models (bio5, bio6, bio12 and bio14 and their respective interactions) to estimate their effects on the distribution of dietary strategies in mammals, based solely on climate. GLMz's were constructed using the glm() function of the {stats} R package (R Core Team, 2013), and stepwise selection was applied using the stepAIC() function of the {MASS} R package (Venables and Ripley, 2002) to remove non-significant climatic variables considering the corrected Akaike information criterion (AICc; Burnham and Anderson, 2004). All analyses were conducted using packages and functions written in the R language (version 4.2.3; R Core Team, 2023).
The first four principal coordinate (PC) axes explain more than 90 % of the total accumulated variance and correspond to four dietary strategies that characterize terrestrial mammal diet space (score values of the first four PC axes obtained by PCoA; Fig. 1, Table S1). PC1 (∼ 50 % of total variance) separates mammal herbivory interactions (feeding on plant materials different from seeds, fruits or nectar; positive values) from mammal invertivory interactions (feeding only on invertebrates; negative values; Table S1, Axis 1). PC2 (∼ 23 % of total variance) represents the variation in mammal frugivory interactions (feeding on fruits; positive values; Table S1, Axis 2). PC3 (∼ 11 % of total variance) explains the variation in mammal granivory interactions (feeding on seeds; negative values; Table S1, Axis 3). PC4 (∼ 7 % of total variance) represents the variation in mammal carnivory interactions (feeding on other mammals and birds; positive values; Table S1, Axis 4).
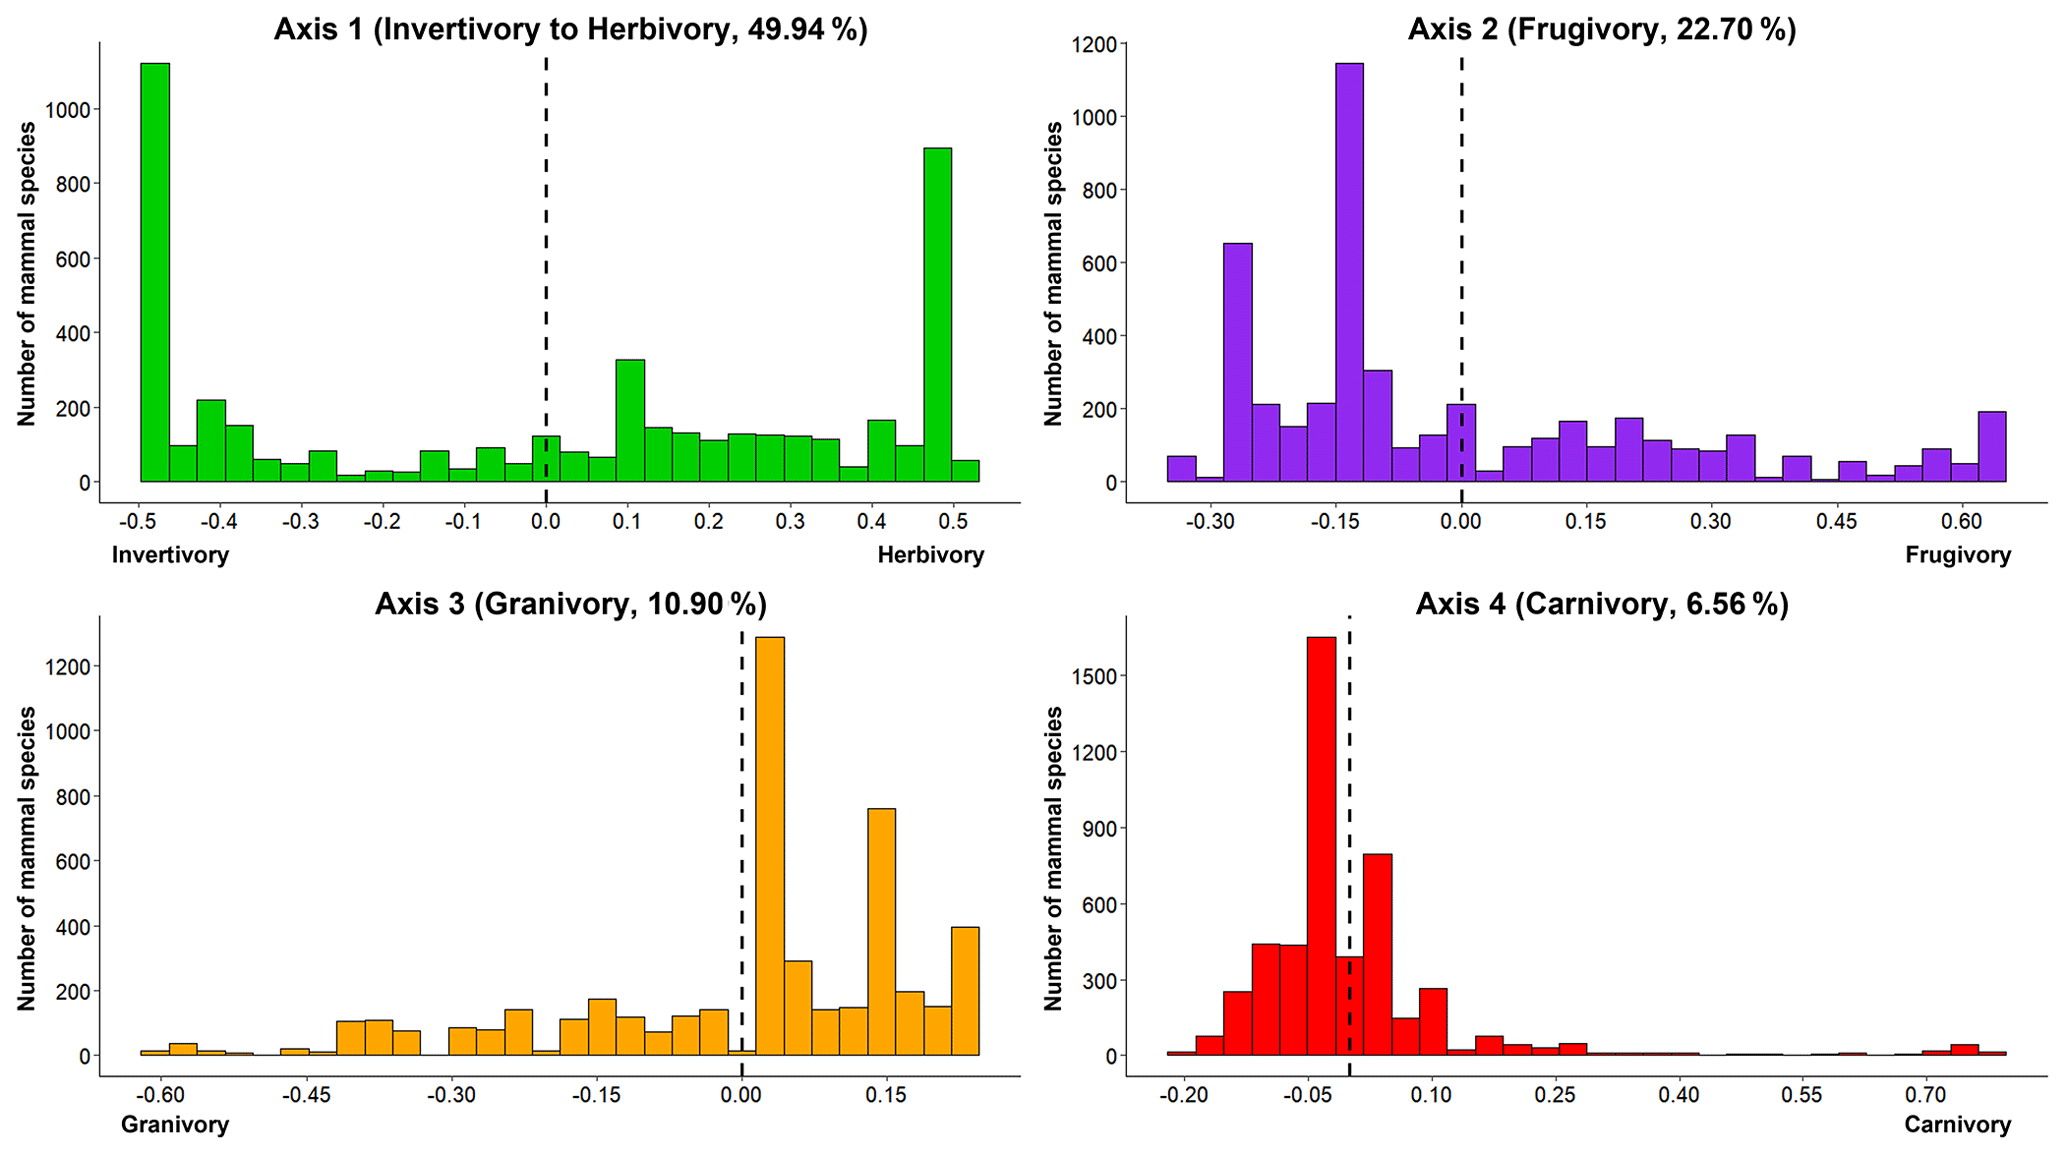
Figure 1Histogram plots of the dietary strategies of terrestrial mammals (PCoA axes). Distribution of the number of mammal species per dietary strategy (score values of PCoA axes per species): Axis 1 (49.94 %, from invertivory to herbivory), Axis 2 (22.70 %, frugivory), Axis 3 (10.90 %, granivory) and Axis 4 (6.56 %, carnivory).
Projecting the rasterized four dietary strategies (PCoA axes) on a global map (World Mollweide ESRI: 54009, 10 000 km2 grid cells), we found geographic patterns in the distribution of trophic interactions in terrestrial mammals (Fig. 2). First, herbivory interactions are dominant in northern and desert areas of America, Europe, Africa and Asia, peaking on the Tibetan Plateau (Axis 1 – positive mean score values), while invertivory interactions predominate in tropical and temperate areas of Europe, Africa, South and Central America, Southeast Asia, the Indo-Malaysian archipelago, and Oceania (Axis 1 – negative mean score values). Second, frugivory interactions are mainly found in the tropics (Axis 2 – positive mean score values). Third, mammal granivory predominates in North America and Europe, including the subtropical zone of Africa, Asia and Oceania (Axis 3 – negative mean score values). Carnivory interactions stand out in the Northern Hemisphere, especially on the Tibetan Plateau, as well as in South America, South Africa and increasing towards the poles (Axis 4 – positive mean score values).
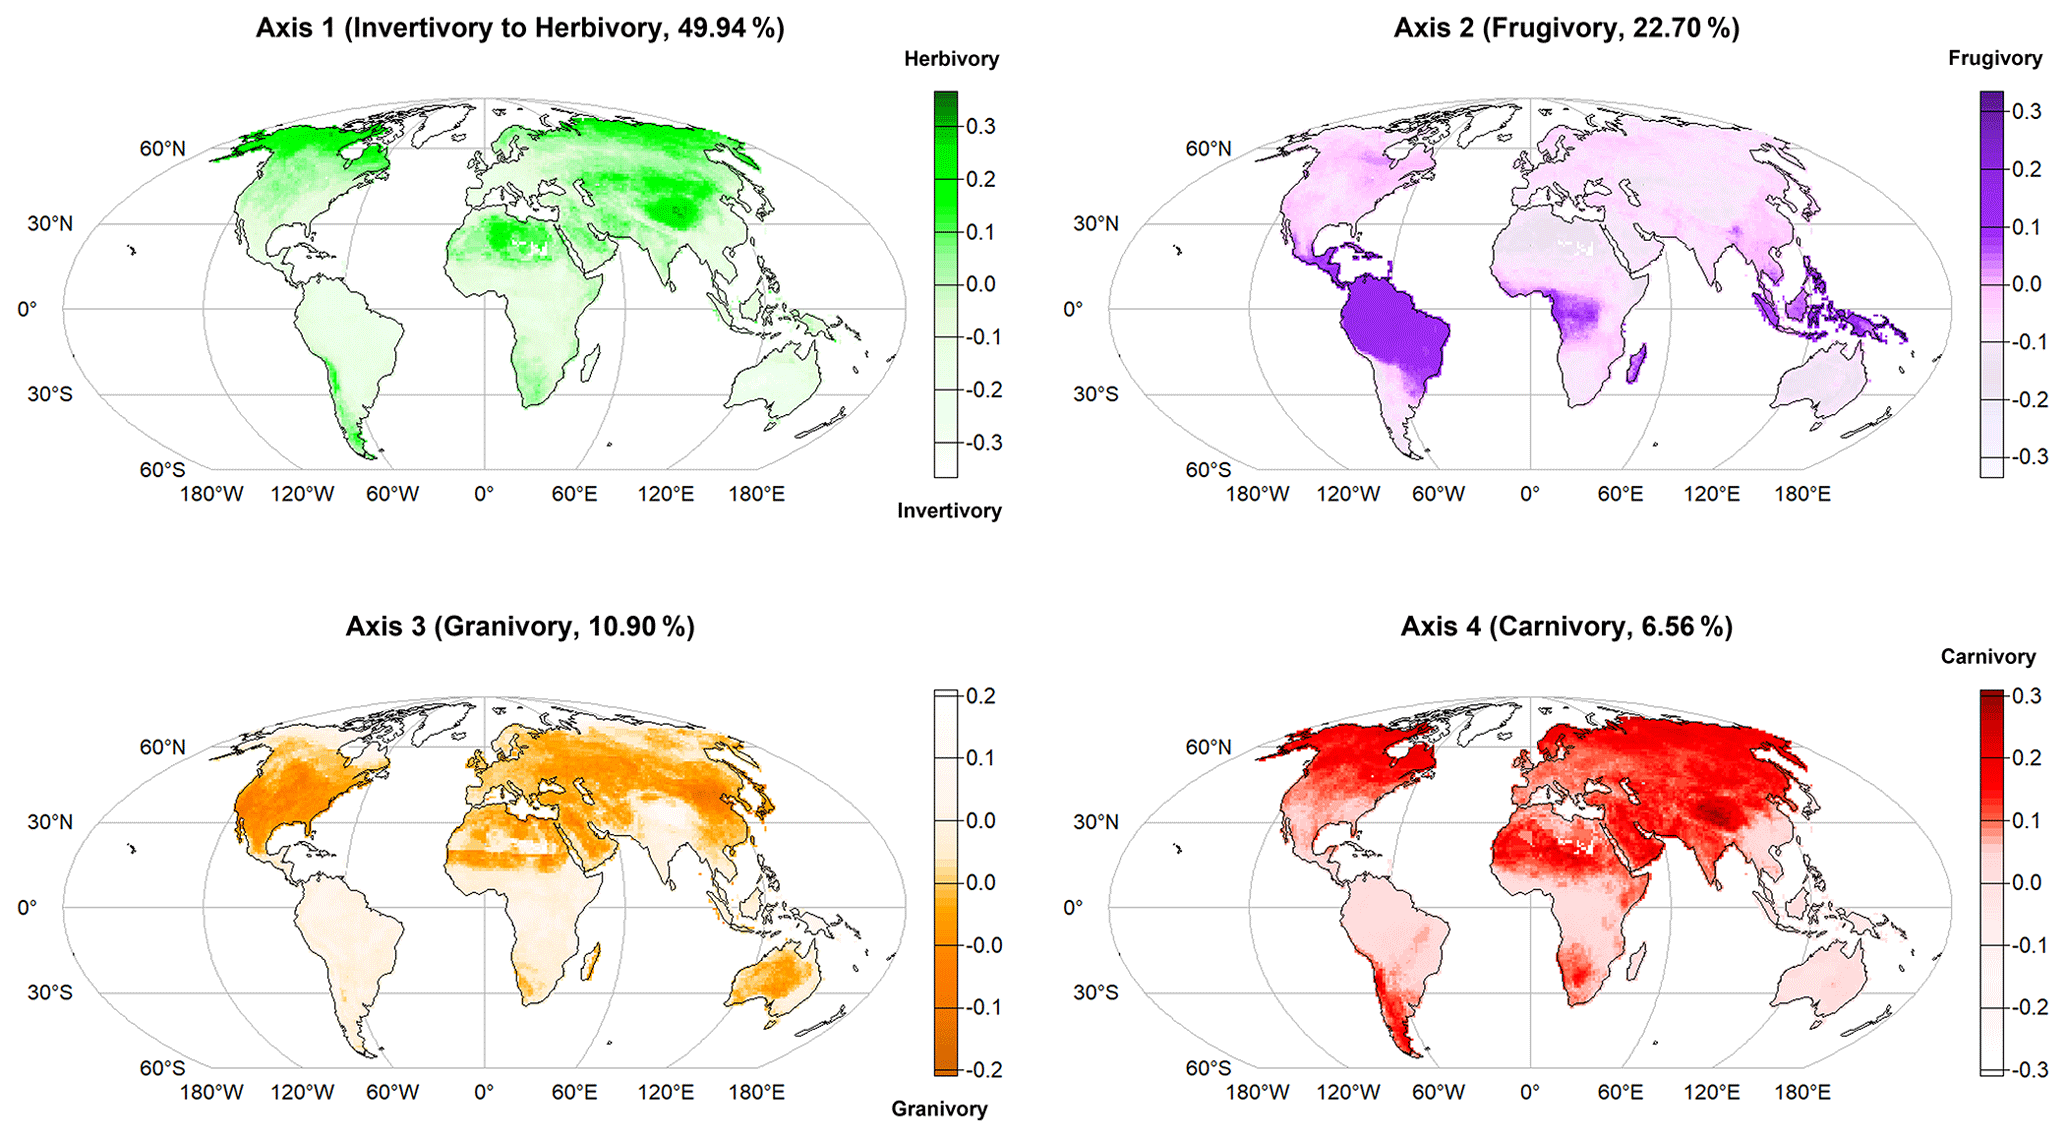
Figure 2Geographical distribution of the main dietary strategies of terrestrial mammals (first four PCoA axes) across the globe (raster projection World Mollweide ESRI: 54009, grid cells sized 10 000 km2). Axis 1 – positive mean score values (i.e., sum of the axis score values per species divided by the species richness within the grid cell) indicate herbivory interactions (mammals feeding on plants) and negative mean score values indicate invertivory interactions (mammals feeding only on invertebrates). Axis 2 – positive mean score values indicate frugivory interactions (mammals feeding on fruits). Axis 3 – negative mean score values indicate prevalence of granivory interactions (mammals feeding on seeds). Axis 4 – positive mean score values indicate prevalence of carnivory interactions (mammals feeding on other mammals and birds).
Our regression tree models (Fig. 3) selected the important bioclimatic variables explaining mammal dietary strategies to later estimate their effects on the variation in the mean score values of PCoA axes through GLMz analysis. Herbivory interactions (Axis 1 – positive mean score values) were mainly related to absolute minimum temperatures (bio6) and annual precipitation (bio12), while invertivory interactions (Axis 1 – negative mean score values) were primarily related to the interactions between absolute minimum temperatures (bio6), annual precipitation (bio12) and precipitation of the driest month (bio14). Frugivory (Axis 2 – positive mean score values) was mainly associated with annual precipitation (bio12) and its interaction with absolute minimum temperatures (bio6). Granivory interactions (Axis 3 – negative mean score values) were chiefly related to absolute minimum temperatures (bio6) and their interaction with absolute maximum temperatures (bio5). Carnivory interactions (Axis 4 – positive mean score values) were mainly related to absolute minimum temperatures (bio6), annual precipitation (bio12) and precipitation of the driest month (bio14), along with their respective interactions with bio6.
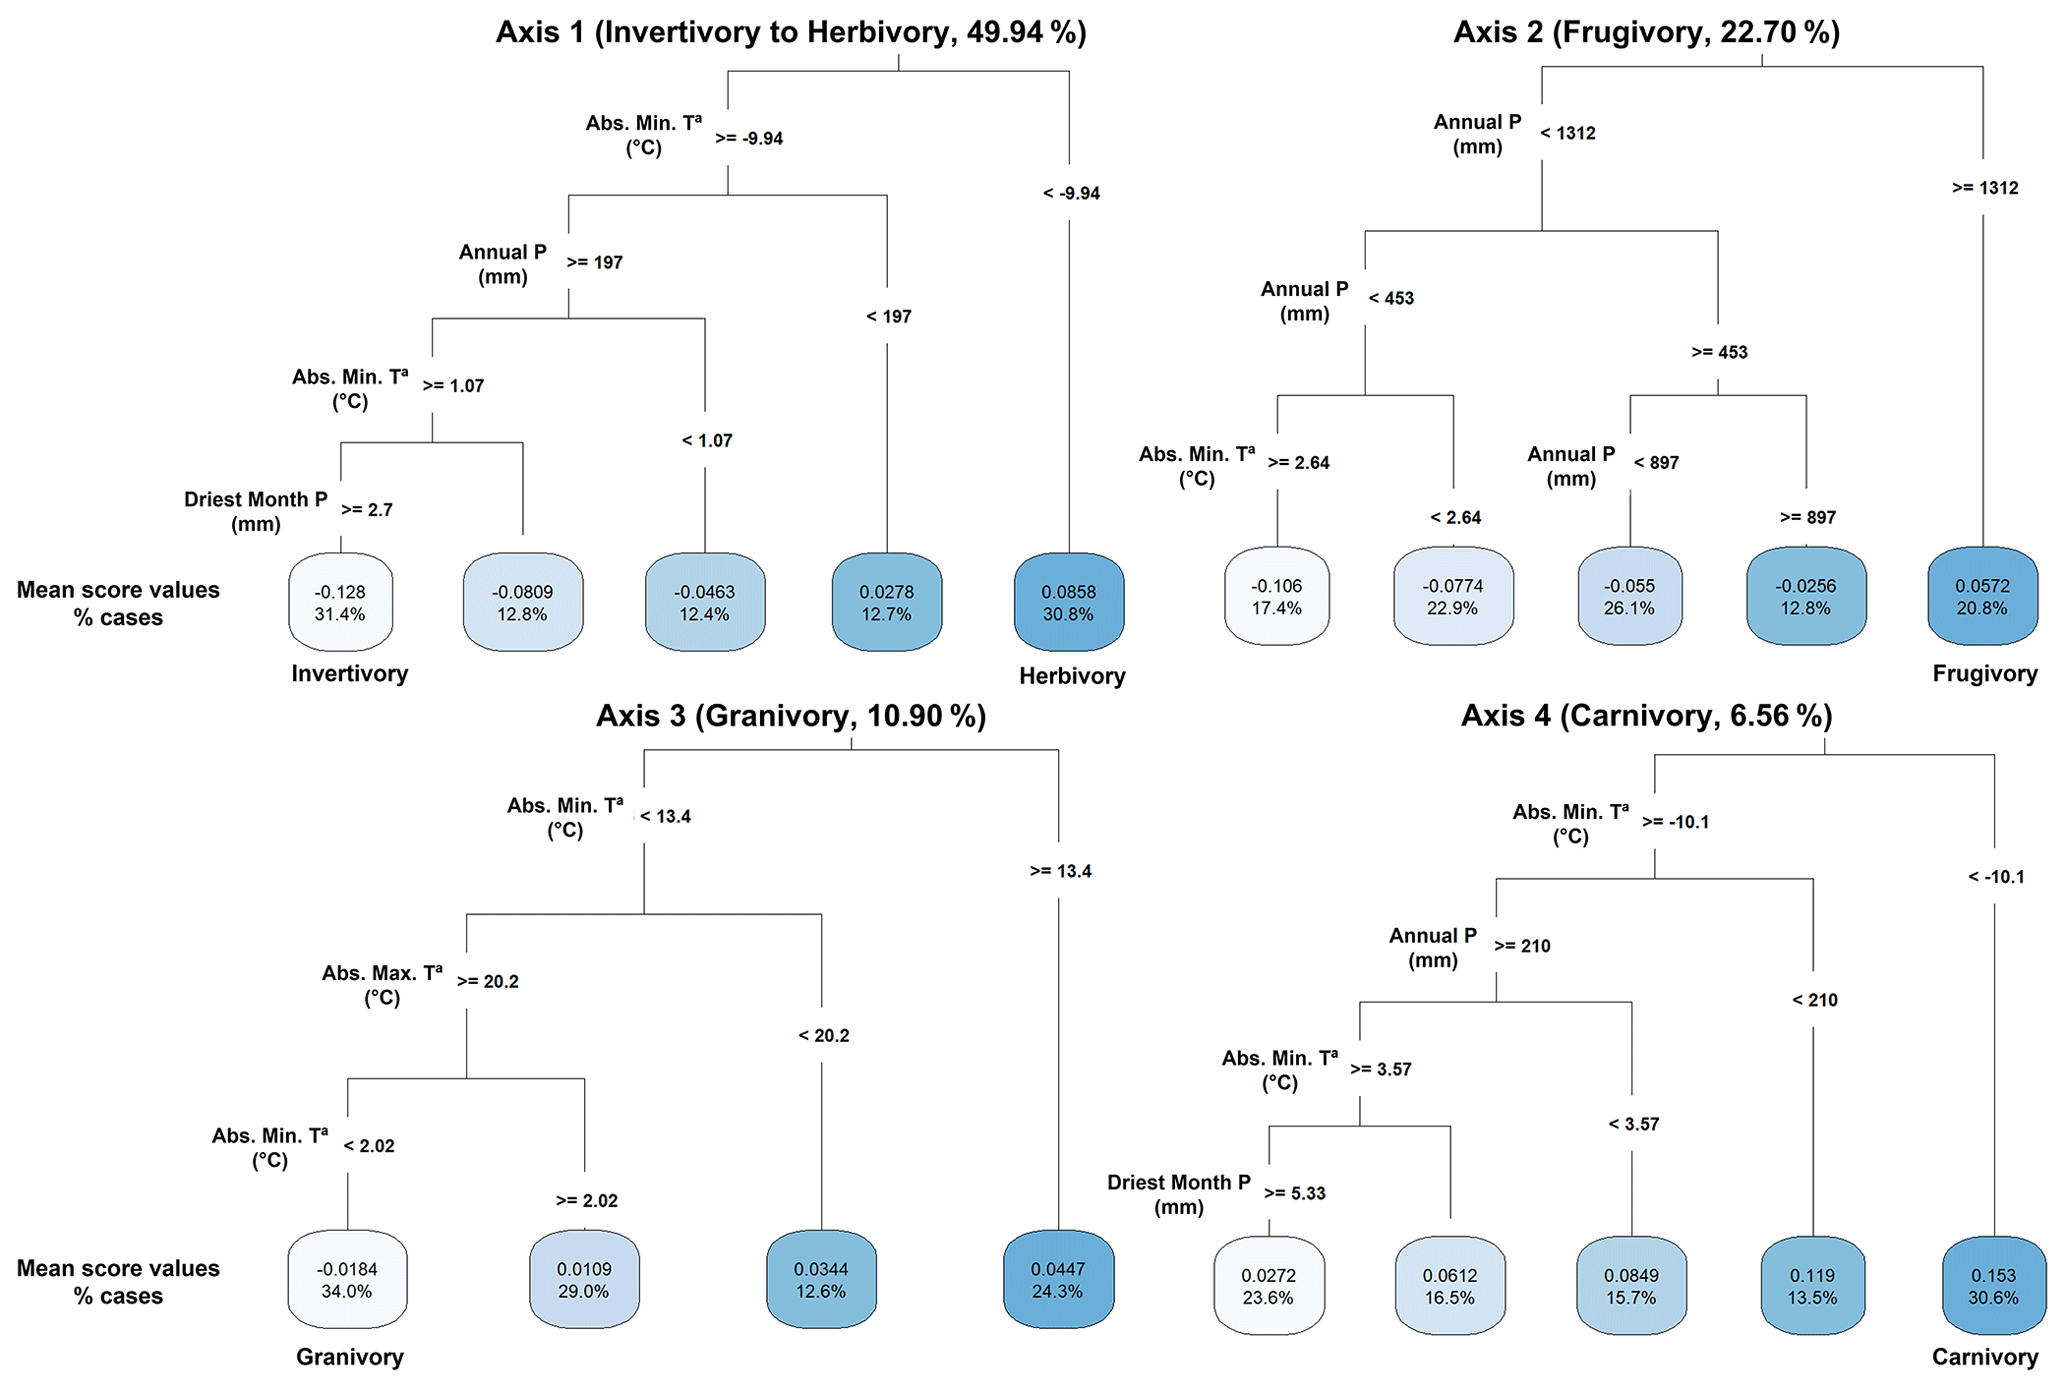
Figure 3Regression tree model results showing the distribution of the main dietary strategies of terrestrial extant mammals (mean score values of the first four PCoA axes) in relation to climate (bioclimatic variables from Fick and Hijmans (2017), https://www.worldclim.org/data/worldclim21.html, last access: 26 April 2024). Only bio5 (maximum temperature of the warmest month, °C), bio6 (minimum temperature of the coldest month, °C), bio12 (annual precipitation, mm) and bio14 (precipitation of the driest month, mm) explained the variation in the global distribution of the mean score values of the first four PCoA axes (as the sum of axis score values per species divided by the species richness within the grid cell), with the percentage of cases explaining the variation in each axis values.
Our GLMz's relied on the four bioclimatic variables selected by previous regression tree models (see Fig. 3). Climate explained between ∼ 24 % and 64 % of the variance in our mammal dietary data from our GLMz's (see Table 1). The minimum temperature of the coldest month (bio6), annual precipitation (bio12) and precipitation of the driest month (bio14) explained ∼ 64 % of the variance in herbivory and invertivory interactions (Table 1, Axis 1). Herbivory (Axis 1 – positive mean score values) is more common in areas with lower absolute minimum temperatures (bio6) and lower precipitation (bio12), while invertivory (Axis 1 – negative mean score values) relates to more humid environments (bio12) with less restricted minimum temperatures (bio6) and lower water scarcity (bio14). Frugivory interactions (Axis 2 – positive mean score values) mainly dominate more humid environments (bio12), decreasing in areas with lower precipitation (bio12) and less restricted minimum temperatures (bio6), jointly explaining ∼ 31 % of the variance in the mean score values of Axis 2 (Table 1). Granivory interactions (Axis 3 – negative mean score values) mainly spread in temperate areas with more restricted absolute minimum temperatures (bio6) and environments with higher absolute maximum (bio5) and lower absolute minimum (bio6) temperatures but are less conspicuous in warmer areas with higher absolute maximum (bio5) and less restricted minimum (bio6) temperatures, explaining only ∼ 24 % of the variance in mean score values of Axis 3 (Table 1). Carnivory interactions (Axis 4 – positive mean score values) occur more frequently in cold and dry areas, with lower absolute minimum temperatures (bio6) and lower annual precipitation (bio12), and are less conspicuous in more humid environments (bio12) with higher absolute minimum temperatures (bio6) and less water scarcity (bio14), explaining ∼ 63 % of the variance in the mean score values of Axis 4 (Table 1).
Table 1Generalized linear model (GLMz) results of the effect of climate (bioclimatic variables extracted from WorldClim version 2.1 climate data and selected by regression tree analyses; see Fig. 3) on the main terrestrial mammal dietary strategies (first four PCoA axes). The mean score values of the PCoA axes (i.e., sum of axis score values per species divided by the species richness within the 10 000 km2 grid cell) were included as the response variable with normal error distribution and identity link function. Only bio5 (maximum temperature of the warmest month), bio6 (minimum temperature of the coldest month), bio12 (annual precipitation) and bio14 (precipitation of the driest month) were included as bioclimatic predictors (with the corresponding interactions) following stepwise selection. Significant effects of bioclimatic variables on mammal dietary strategies are indicated in bold (p value < 0.001).

Here, we described the dietary strategies followed by terrestrial mammals across geography, mapped the distribution of mammal trophic interactions globally and analyzed their relationship to climate. Our results indicate that trophic interactions might influence broad-scale patterns of biodiversity, complementing interpretations based solely on climate, as traditionally considered in biogeographical studies (but see Mendoza and Araújo, 2022). Our research highlights clear geographic patterns of mammal diets directly linking these patterns to specific climate variables like temperature and precipitation. Unlike previous studies, our work provides detailed diet-specific geographic mapping and emphasizes the significant role of climate-driven food availability in shaping mammal distributions. This new perspective enhances our understanding of biogeographical patterns by integrating dietary strategies and climate.
Our findings show that trophic interactions of terrestrial mammals are geographically distributed across the globe. Previous work demonstrated how dietary strategies are geographically distributed at a global scale for birds (Barnagaud et al., 2019). Additionally, it has been shown that the diversity of fruit-eating birds is influenced by the richness of fruits across the globe (Kissling et al., 2007; Barnagaud et al., 2019), and the coexistence of large mammal herbivores is explained by diet specialization (Kartzinel et al., 2015). Moreover, mammals that feed on fruits are found in warm and humid tropical environments where fruit is abundant year-round (Ramos Pereira et al., 2010; Ramos-Robles et al., 2018). Thus, climate-driven food availability might be crucial for some dietary strategies, like frugivory. Similarly, granivory interactions are common in temperate areas and less conspicuous in desert and semi-arid regions, possibly due to reduced plant availability in these regions due to climatic restrictions (Hulme and Benkman, 2002). Additionally, carnivore interactions are less widespread, mostly found in northern areas and well-preserved mammal assemblages in the Southern Hemisphere, possibly linked to the global decline in large carnivores due to human pressures such as hunting and ranching (Ripple et al., 2014).
Herbivory interactions dominate cold and dry regions, whereas invertivory and frugivory interactions are predominant in tropical (wet and hot) regions. Granivory interactions are predominant in temperate environments, while carnivore interactions stand out in colder regions and areas with fewer water restrictions, increasing towards the poles. Climate alone explained between 24 % and 64 % of the variance in our mammal dietary data. Thus, terrestrial mammal diets show clear geographical patterns that can be partially explained by climate across the globe. The geographical patterns observed here suggest that climate might affect the type of food available across bioclimatic regions, potentially driving trophic specialization in more extreme environments. This opens a dichotomy between plant distributions (driven by climate and soil) and animal distributions (driven by trophic interactions), suggesting the need to incorporate dietary strategies to study biogeographic patterns of animal diversity. It is becoming increasingly clear that dietary strategies must be taken into account to understand macroecological and biogeographical patterns on a global scale (Kissling et al., 2014; Araújo and Rozenfeld, 2014; Reuter et al., 2023).
Potential biases in the availability of taxonomic spatial data (IUCN) and species diet data (EltonTraits) used in this study (González-Suárez et al., 2012; Rocchini et al., 2023) may constrain our interpretation of global patterns regarding the distribution of the main dietary strategies of extant terrestrial mammals predicted by our models. Additionally, phylogenetic constraints and evolutionary processes may also shape the division of diets. In general terms, herbivores are substantially heavier than omnivores or carnivores (Price and Hopkins, 2015), and trophic structures of large-mammal communities are shaped by climate (Mendoza and Araújo, 2019). Thus, the distribution of trophic interactions in the phylogeny of the mammal diet and the inclusion of life-history traits, such as body size or body mass, which may covary with it, should also be considered in future biogeographical research. In fact, using phylogeny in comparative studies of life-history traits and dietary strategies would allow quantifying their relationships through the lens of evolutionary history. Understanding where species are (their geographic ranges), what they are (their phylogenetic constraints and phenotypic traits) and what they eat (their dietary strategies) will provide information about their evolutionary pathways and potential colonization of new habitats.
Mammal dietary strategies exhibit conspicuous geographic patterns that can be partially explained by climate. Trophic interactions seem to mediate the distribution of consumer species (animals) contrary to the distribution of producer species (plants), which are driven directly by abiotic factors such as climate and soil (Beauregard and de Blois, 2014; Chauvier et al., 2021). Climate-driven food availability appears to filter species co-occurrence at the community level (White, 2008), and local-scale trophic interactions seem to scale up to create observed diversity patterns across the globe (Araújo and Rozenfeld, 2014). The biogeography of dietary strategies raises interesting questions about where and how species coexist (Spitz et al., 2014) and may be included in global change models to enhance our understanding of factors constraining the distribution of biodiversity.
The raw dataset generated in this study is available in the Supplement (Supplementary_Data_S1.xlsx). The rasterized data of PCoA axes and bioclimatic variables per grid cell are available in the Supplement (Supplementary_Data_S2.xlsx).
The supplement related to this article is available online at: https://doi.org/10.5194/we-24-71-2024-supplement.
MS conceived the study; ML, MS and MSC collected and analyzed the data and prepared the figures and tables; MS and ML wrote the article.
The contact author has declared that none of the authors has any competing interests.
Publisher’s note: Copernicus Publications remains neutral with regard to jurisdictional claims made in the text, published maps, institutional affiliations, or any other geographical representation in this paper. While Copernicus Publications makes every effort to include appropriate place names, the final responsibility lies with the authors.
The authors want to acknowledge Nathan Mazet, Jean-Yves Baranagaud, Cyrille Violle, Sara Varela and Adrián Castro-Insua for their contribution in developing the methods used in this paper. This research has been supported by the Xunta de Galicia (Spain) under the grant I2C (ref. ED481D 2019/024) and the Agencia Estatal de Investigación (Spain) under the grant Research Consolidation 2022 (ref. CNS2022-135917).
This research has been supported by the Consellería de Cultura, Educación e Ordenación Universitaria, Xunta de Galicia (grant no. ED481D 2019/024) and the Agencia Estatal de Investigación, Ministerio de Ciencias, Innovación y Universidades, Gobierno de España, under the NextGenerationEU program (grant no. CNS2022-135917).
This paper was edited by Sérgio Timóteo and reviewed by Manuel Mendoza and one anonymous referee.
Araújo, M. B. and Rozenfeld, A: The geographic scaling of biotic interactions, Ecography, 37, 406–415, https://doi.org/10.1111/j.1600-0587.2013.00643.x, 2014.
Badgley, C. and Fox, D. L.: Ecological biogeography of North American mammals: Species density and ecological structure in relation to environmental gradients, J. Biogeogr., 27, 1437–1467, https://doi.org/10.1046/j.1365-2699.2000.00498.x, 2000.
Barnagaud, J.-Y., Mazet, N., Munoz, F., Grenié, M., Denelle, P., Sobral, M., Kissling, W. D., Şekercioğlu, C. H., and Violle, C: Functional biogeography of dietary strategies in birds, Global Ecol. Biogeogr., 28, 1004–1017, https://doi.org/10.1111/geb.12910, 2019.
Beauregard, F. and de Blois, S.: Beyond a climate-centric view of plant distribution: Edaphic variables add value to distribution models, PLoS One, 9, e92642, https://doi.org/10.1371/journal.pone.0092642, 2014.
Bougeard, S. and Dray, S.: Supervised multiblock analysis in R with the ade4 package, J. Stat. Softw., 86, 1–17, https://doi.org/10.18637/jss.v086.i01, 2018.
Brown, J. H., and Maurer, B. A.: Macroecology: The division of food and space among species on continents, Science, 243, 1145–1150, https://doi.org/10.1126/science.243.4895.1145, 1989.
Burnham, K. P. and Anderson, D. R.: Introduction, in: Model selection and multimodel inference, 2nd edn., edited by: Burnham, K. P. and Anderson, D. R., Springer New York, New York, USA, 1–48, https://doi.org/10.1007/b97636, 2004.
Chauvier, Y., Thuiller, W., Brun, P., Lavergne, S., Descombes, P., Karger, D. N., Renaud, J., and Zimmermann, N. E.: Influence of climate, soil, and land cover on plant species distribution in the European Alps, Ecol. Monogr., 91, e01433, https://doi.org/10.1002/ecm.1433, 2021.
Dray, S. and Dufour, A.-B.: The ade4 package: Implementing the duality diagram for ecologists, J. Stat. Softw., 22, 1–20, https://doi.org/10.18637/jss.v022.i04, 2007.
Fick, S. E. and Hijmans, R. J.: WorldClim 2: New 1-km spatial resolution climate surfaces for global land areas, WorldClim [data set], https://www.worldclim.org/data/worldclim21.html (last access: 26 April 2024), 2017.
González-Suárez, M., Lucas, P. M., and Revilla, E.: Biases in comparative analyses of extinction risk: mind the gap, J. Anim. Ecol., 81, 1211–1222, https://doi.org/10.1111/j.1365-2656.2012.01999.x, 2012.
Harvell, C. D., Mitchell, C. E., Ward, J. R, Altizer, S., Dobson, A. P., Ostfeld R. S., and Samuel, M. D.: Climate warming and disease risks for terrestrial and marine biota, Science, 296, 2158–2162, https://doi.org/10.1126/science.1063699, 2002.
Hijmans, R.: terra: Spatial data analysis, R package version 1.7-76, https://rspatial.github.io/terra/ (last access: 26 April 2024), 2024.
Hulme, P. E. and Benkman, C. W.: Granivory, in: Plant-animal interactions: An evolutionary approach, edited by: Herrera, C. M. and Pellmyr, O., Wiley-Blackwell, 132–154, ISBN 978-0-632-05267-7, 2002.
IUCN (International Union for Conservation of Nature): Terrestrial mammals (spatial data), The IUCN Red List of Threatened Species, Version 2022-2, IUCN [data set], https://www.iucnredlist.org/search?permalink=244328c0-8a55-4921-a860-1b70ef673f95 (last access: 9 January 2024), 2023.
Kartzinel, T. R., Chen, P. A., Coverdale, T. C., Erickson, D. L., Kress, W. J., Kuzmina, M. L., Rubenstein, D. I., Wang, W., and Pringle, R. M.: DNA metabarcoding illuminates dietary niche partitioning by African large herbivores, P. Natl. Acad. Sci. USA, 112, 8019–8024, https://doi.org/10.1073/pnas.1503283112, 2015.
Kissling, W. D., Rahbek, C., and Böhning-Gaese, K.: Food plant diversity as broad-scale determinant of avian frugivore richness, P. Roy. Soc. B-Biol. Sci., 274, 799–808, https://doi.org/10.1098/rspb.2006.0311, 2007.
Kissling, W. D., Dalby, L., Fløjgaard, C., Lenoir, J., Sandel, B., Sandom, C., Trøjelsgaard, K., and Svenning, J.-C.: Establishing macroecological trait datasets: Digitalization, extrapolation, and validation of diet preferences in terrestrial mammals worldwide, Ecol. Evol., 4, 2913–2930, https://doi.org/10.1002/ece3.1136, 2014.
Legendre, P. and Legendre, L. F.: Numerical ecology, 3rd edn., Elsevier, 1006 pp., ISBN 9780444538680, 2012.
Liu, B.: Fuzzy Variables, in: Theory and practice of uncertain programming, studies in fuzziness and soft computing, 1st edn., edited by: Liu, B., Physica-Verlag Heidelberg, 147–165, https://doi.org/10.1007/978-3-7908-1781-2_8, 2002.
Mendoza, M. and Araújo, M. B.: Climate shapes mammal community trophic structures and humans simplify them, Nat. Commun., 10, 5197, https://doi.org/10.1038/s41467-019-12995-9, 2019.
Mendoza, M. and Araújo, M. B.: Biogeography of bird and mammal trophic structures, Ecography, 2022, e06289, https://doi.org/10.1111/ecog.06289, 2022.
Olson, V. A., Davies, R. G., Orme, C. D. L., Thomas, G. H., Meiri, S., Blackburn, T. M., Gaston, K. J., Owens, I. P. F., and Bennett, P. M.: Global biogeography and ecology of body size in birds, Ecol. Lett., 12, 249–259, https://doi.org/10.1111/j.1461-0248.2009.01281.x, 2009.
Paradis, E. and Schliep, K.: ape 5.0: An environment for modern phylogenetics and evolutionary analyses in R, Bioinformatics, 35, 526–528, https://doi.org/10.1093/bioinformatics/bty633, 2019.
Pompa, S., Ehrlich, P. R., and Ceballos, G.: Global distribution and conservation of marine mammals, P. Natl. Acad. Sci. USA, 108, 13600–13605, https://doi.org/10.1073/pnas.1101525108, 2011.
Price, S. A. and Hopkins, S. S. B.: The macroevolutionary relationship between diet and body mass across mammals, Biol. J. Linn. Soc., 115, 173–184, https://doi.org/10.1111/bij.12495, 2015.
Price, S. A., Hopkins, S. S., Smith, K. K., and Roth, V. L.: Tempo of trophic evolution and its impact on mammalian diversification, P. Natl. Acad. Sci. USA, 109, 7008–7012, https://doi.org/10.1073/pnas.1117133109, 2012.
Ramos Pereira, M. J., Marques, J. T., and Palmeirim, J. M.: Ecological responses of frugivorous bats to seasonal fluctuation in fruit availability in Amazonian forests, Biotropica, 42, 680–687, https://doi.org/10.1111/j.1744-7429.2010.00635.x, 2010.
Ramos-Robles, M., Dáttilo, W., Díaz-Castelazo, C., and Andresen, E.: Fruit traits and temporal abundance shape plant-frugivore interaction networks in a seasonal tropical forest, Sci. Nat., 105, 29, https://doi.org/10.1007/s00114-018-1556-y, 2018.
R Core Team: R: A language and environment for statistical computing, R Foundation for Statistical Computing, Vienna, Austria, https://www.R-project.org/ (last access: 26 April 2024), 2013.
R Core Team: R: A language and environment for statistical computing, R Foundation for Statistical Computing, Vienna, Austria, https://www.R-project.org/ (last access: 26 April 2024), 2023.
Reuter, D. M., Hopkins, S. S., and Price, S. A.: What is a mammalian omnivore? Insights into terrestrial mammalian diet diversity, body mass and evolution, P. Roy. Soc. B-Biol. Sci., 290, 20221062, https://doi.org/10.1098/rspb.2022.1062, 2023.
Ripple, W. J., Estes, J. A., Beschta, R. L., Wilmers, C. C., Ritchie, E. G., Hebblewhite, M., Berger, J., Elmhagen, B., Letnic, M., Nelson, M. P., Schmitz, O. J., Smith, D. W., Wallach, A. D., and Wirsing, A. J.: Status and ecological effects of the world's largest carnivores, Science, 343, 1241484, https://doi.org/10.1126/science.1241484, 2014.
Rocchini, D., Tordoni, E., Marchetto, E., Marcantonio, M., Barbosa, A. M., Bazzichetto, M., Beierkuhnlein, C., Castelnuovo, E., Gatti, Roberto C., Chiarucci, A., Chieffallo, L., Da Re, D., Di Musciano, M., Foody, G. M., Gabor, L., Garzon-Lopez, C. X., Guisan, A., Hattab, T., Hortal, J., Kunin, W. E., Jordán, F., Lenoir, J., Mirri, S., Moudrý, V., Naimi, B., Nowosad, J., Sabatini, F. M., Schweiger, A. H., Šímová, P., Tessarolo, G., Zannini, P., and Malavasi, M: A quixotic view of spatial bias in modelling the distribution of species and their diversity, npj Biodiversity, 2, 10, https://doi.org/10.1038/s44185-023-00014-6, 2023.
Sastre, P., Roca, P., Lobo, J. M., and EDIT co-workers: A geoplatform for improving accessibility to environmental cartography, J. Biogeogr., 36, 568–568, https://doi.org/10.1111/j.1365-2699.2008.02070.x, 2009.
Solari, S. and Baker, R. J.: Mammal species of the world: A taxonomic and geographic reference by D. E. Wilson; D. M. Reeder, J. Mammal., 88, 824–830, https://doi.org/10.1644/06-MAMM-R-422.1, 2007.
Therneau, T., Atkinson, B., and Ripley, B.: Rpart: Recursive partitioning, R package version 4.1-3, https://cran.r-project.org/package=rpart (last access: 26 April 2024), 2013.
Thioulouse, J., Dray, S., Dufour, A., Siberchicot, A., Jombart, T., and Pavoine, S.: Multivariate analysis of ecological data with ade4, Springer, https://doi.org/10.1007/978-1-4939-8850-1, 2018.
Urban, M. C.: Accelerating extinction risk from climate change, Science, 348, 571–573, https://doi.org/10.1126/science.aaa4984, 2015.
Venables, W. D. and Ripley, B. D.: Modern Applied Statistics with S, 4th Edition, Springer New York, New York, USA, ISBN 0-387-95457-0, 2002.
White, T. C. R.: The role of food, weather and climate in limiting the abundance of animals, Biol. Rev., 83, 227–248, https://doi.org/10.1111/j.1469-185X.2008.00041.x, 2008.
Wilman, H., Belmaker, J., Simpson, J., de la Rosa, C., Rivadeneira, M. M., and Jetz, W.: EltonTraits 1.0: Species-level foraging attributes of the world’s birds and mammals, Wiley. Collection, figshare [data set], https://doi.org/10.6084/m9.figshare.c.3306933.v1, 2014.