the Creative Commons Attribution 4.0 License.
the Creative Commons Attribution 4.0 License.
 | 19 Aug 2020
Ödenwinkel: an Alpine platform for observational and experimental research on the emergence of multidiversity and ecosystem complexity
Robert R. Junker
Maximilian Hanusch
Xie He
Victoria Ruiz-Hernández
Jan-Christoph Otto
Sabine Kraushaar
Kristina Bauch
Florian Griessenberger
Lisa-Maria Ohler
Wolfgang Trutschnig
Studies on ecological successions have a long tradition and have strongly contributed to the understanding of community assembly, niche theory, and ecosystem structure and functionality. Reports on ecological successions are however mostly restricted to one or two taxonomic groups, neglecting the mutual influences and dependencies between multiple taxonomic groups that are the building blocks of diverse communities. We introduce the Alpine research platform Ödenwinkel to promote observational and experimental research on the emergence of multidiversity and ecosystem complexity. We established n= 140 permanent plots along the successional gradient of the forefield of the Ödenwinkelkees glacier at the end of the Stubachtal valley in the Hohe Tauern range (Hohe Tauern National Park, Land Salzburg, Austria). In summer 2019 we completed a first full inventory of biotic and abiotic characteristics of these plots covering the diversity and composition of vascular plants, bryophytes, arthropods, and other animals, bacteria and fungi as well as some geomorphologic properties. In this paper we introduce the design of the research platform and show first results. While focusing on the diversity and composition of vascular plants along the successional gradient, we also provide data on the diversity of animals, bacteria, and fungi. The Ödenwinkel platform will be available as a long-term ecological research site where researchers from various disciplines can contribute to the accumulation of knowledge on ecological successions and on how interactions between various taxonomic groups structure ecological complexity in this Alpine environment.
- Article
(9906 KB) - Full-text XML
-
Supplement
(172 KB) - BibTeX
- EndNote


Biodiversity is of indispensable value for ecosystem functioning and stability and provides multiple direct and indirect benefits crucial for human well-being (Gaston and Spicer, 2004). Anthropogenic alterations of the environment such as climate warming and habitat conversion have fueled recent scientific and social interest in the causes and consequences of biodiversity decline (Allan et al., 2014; Fischer et al., 2010; Gascon et al., 2015; Soliveres et al., 2016). Compared to those studies, research on the emergence of biodiversity and ecosystem complexity (i.e., the increase in biodiversity, ecological successions) has a longer tradition and is of continued interest as the ecological processes involved in community development are strongly relevant for the restoration of anthropogenically altered landscapes (Meiners et al., 2015). Prime examples of succession are recent deglaciations that create virtually uninhabited substrates waiting for initial colonization and the assembly of multidiverse communities consisting of microbes, plants, and animals. Such natural experiments (Diamond, 1983) provide an excellent opportunity to track transformations in community composition and diversity over time. Additionally, next to a purely biotic consideration, abiotic changes along a chronosequence can help us to understand biogeomorphic feedbacks that shape landscapes (Eichel, 2019; Matthews, 1992; Miller and Lane, 2019).
Whereas some large-scale studies of biodiversity decline consider a number of taxonomic groups such as plants, animals, and microbes (Fischer et al., 2010), most information on succession has been gathered in studies focusing on plants. Consequently, concepts of community establishment have mostly been based on plant succession (Eichel et al., 2013; Fierer et al., 2010; Mueller-Dombois, 1995). However, successional processes are regulated by the concerted appearance of plants, animals, and microbes. For instance, herbivores affect plant succession (Milchunas and Vandever, 2014), plants and microbes reciprocally affect their establishment (Tscherko et al., 2005), and studies have shown that the community composition and diversity of plants, animals, and microorganisms cannot be viewed in isolation because of mutual influences (Humphrey et al., 2014; Mikkelson et al., 2016; Samuni-Blank et al., 2014). Furthermore, local soil microbial communities have the potential to determine the local abundance of plant species (Klironomos, 2002) and to affect tritrophic interactions between plants, herbivores, and parasitoids (Benítez et al., 2017). These examples demonstrate that overall diversity and composition of communities emerge from interdependent taxa that affect each other's presence or absence and abundance (Junker et al., 2019; Manning et al., 2015). Thus, the different ecological roles of plants, animals, and microorganisms as well as their interactions demand ecosystem-wide comprehensive assessments of the diversity of several taxonomic groups (Humphrey et al., 2014; Manning et al., 2015). This cumulative diversity of a number of taxonomic groups is defined as multidiversity (Allan et al., 2014). Studies that comprehensively track the successional increase in multidiversity in the field are lacking, and thus little is known about the mechanisms of the successional establishment of multidiversity and ecological complexity under natural conditions. However, this knowledge is crucial for understanding ecosystem processes and designing conservation and restoration efforts.
Successional processes on glacier forefields are excellent study systems for groundbreaking insights into the fundamentals of the generation of multidiversity and the interactions between various trophic levels as well as feedbacks between biotic and abiotic factors. In order to facilitate research addressing these issues, we introduce the research platform Ödenwinkel, recently established along a glacier forefield of the Ödenwinkelkees in the Austrian Alps, that will serve as a long-term field site to study processes towards the emergence of multidiversity and ecological complexity. The permanent plots (n= 140) representing a chronosequence of ∼ 170 years of community establishment will be used to accumulate plot-specific information on biotic and abiotic characteristics as well as to monitor long-term changes therein. Information on the precise location, geomorphological characteristics and previous ecological data gathered at the plots will be made available to colleagues interested in addressing their research questions within the framework of Ödenwinkel.
2.1 Geomorphology and plot location
In summer 2019 we established n= 140 permanent plots along the successional gradient of the forefield of the Ödenwinkelkees glacier (Austria). The Ödenwinkelkees is a low-lying, highly sheltered valley glacier at the end of the Stubachtal valley in the Hohe Tauern range. The field site is located in the Hohe Tauern National Park and is part of the Natura 2000 areas. The glacier initiates below a northern exposed cirque headwall (more than 600 m in height) formed by the peaks of Hoher Kasten (3189 m a.s.l.), Eiskögele (3423 m a.s.l.), and Johannisberg (3453 m a.s.l.). The headwall is a buildup of two distinct, stacked lithological units with an upper layer of Penninic mica schists and amphibolites underlain by sub-Penninic granitic gneisses of the Tauern Window. The Ödenwinkelkees glacier has an area of 1.4 km2 (2015) and is about 2.6 km long. The current ice surface spreads between 2880 and 2190 m a.s.l. and is mainly nourished by avalanches from the headwall. The majority of the plots (n= 135) were established within the glacier forefield, i.e., the area that was covered by ice at the latest glacial maximum in the Little Ice Age (LIA; around 1850). Glacier melt released an area of 0.9 km2 in a typically u-shaped valley. The flat valley floor that hosts the plots has an area of 0.35 km2 at elevations between 2070 and 2170 m a.s.l. The glacier forefield is characterized by a variable pattern of sedimentary deposits originating from the glacier. Besides subglacial and glaciofluvial sediments, coarse boulders, deposited as supraglacial debris from rockfall activity dominate the surface material composition. An additional n= 5 plots were established outside the glacier forefield in areas unaffected by recent geomorphological influences (i.e., age ≫ 170 years). The plots within the glacier forefield were evenly distributed between the LIA glacier maximum and the current extent of the glacier (glacier tongue) to represent a chronosequence of succession with high temporal resolution. Locations of the plots were preselected to guarantee longevity in this highly geomorphodynamic environment. Therefore, five main criteria were operationalized using a 2007 digital elevation model (5 m×5 m by the state of Salzburg, Austria) and ARC GIS 10.4 to predefine potential areas with the following characteristics: (1) outside of the main river bed and episodic fluvial rills, (2) outside of the recent bed load exchange reach, (3) situated on the terrace with a low curvature, (4) plot slope angle ≤ 10 %, (5) distance to the river at least 2 m. Afterwards, the n= 135 plots located in the glacier forefield were predefined in order to evenly cover the temporal succession. The predefined locations were located in the field using a GPS device (Geo 7X, Trimble, Sunnyvale, US) and permanently marked using ground anchors (FENO-BODENANKER, FENO-Bodenanker, Faynot, Thilay, France). Each ground anchor was marked with a running number with plot_001 as the youngest plot close to the glacier tongue and plot_135 as the oldest plot within the glacier forefield close to the glacial maximum of 1850. Plot_136–plot_140 are located outside of the glacier forefield. Locations of the plots can be found in Fig. 1 and Supplement 1a both as coordinates and as what3words addresses, facilitating the location of the plot using any smartphone and the what3words app (https://what3words.com, last access: January 2020). Additional plots that will be located in future deglaciated areas following expected glacial retreat will have negative numbers.
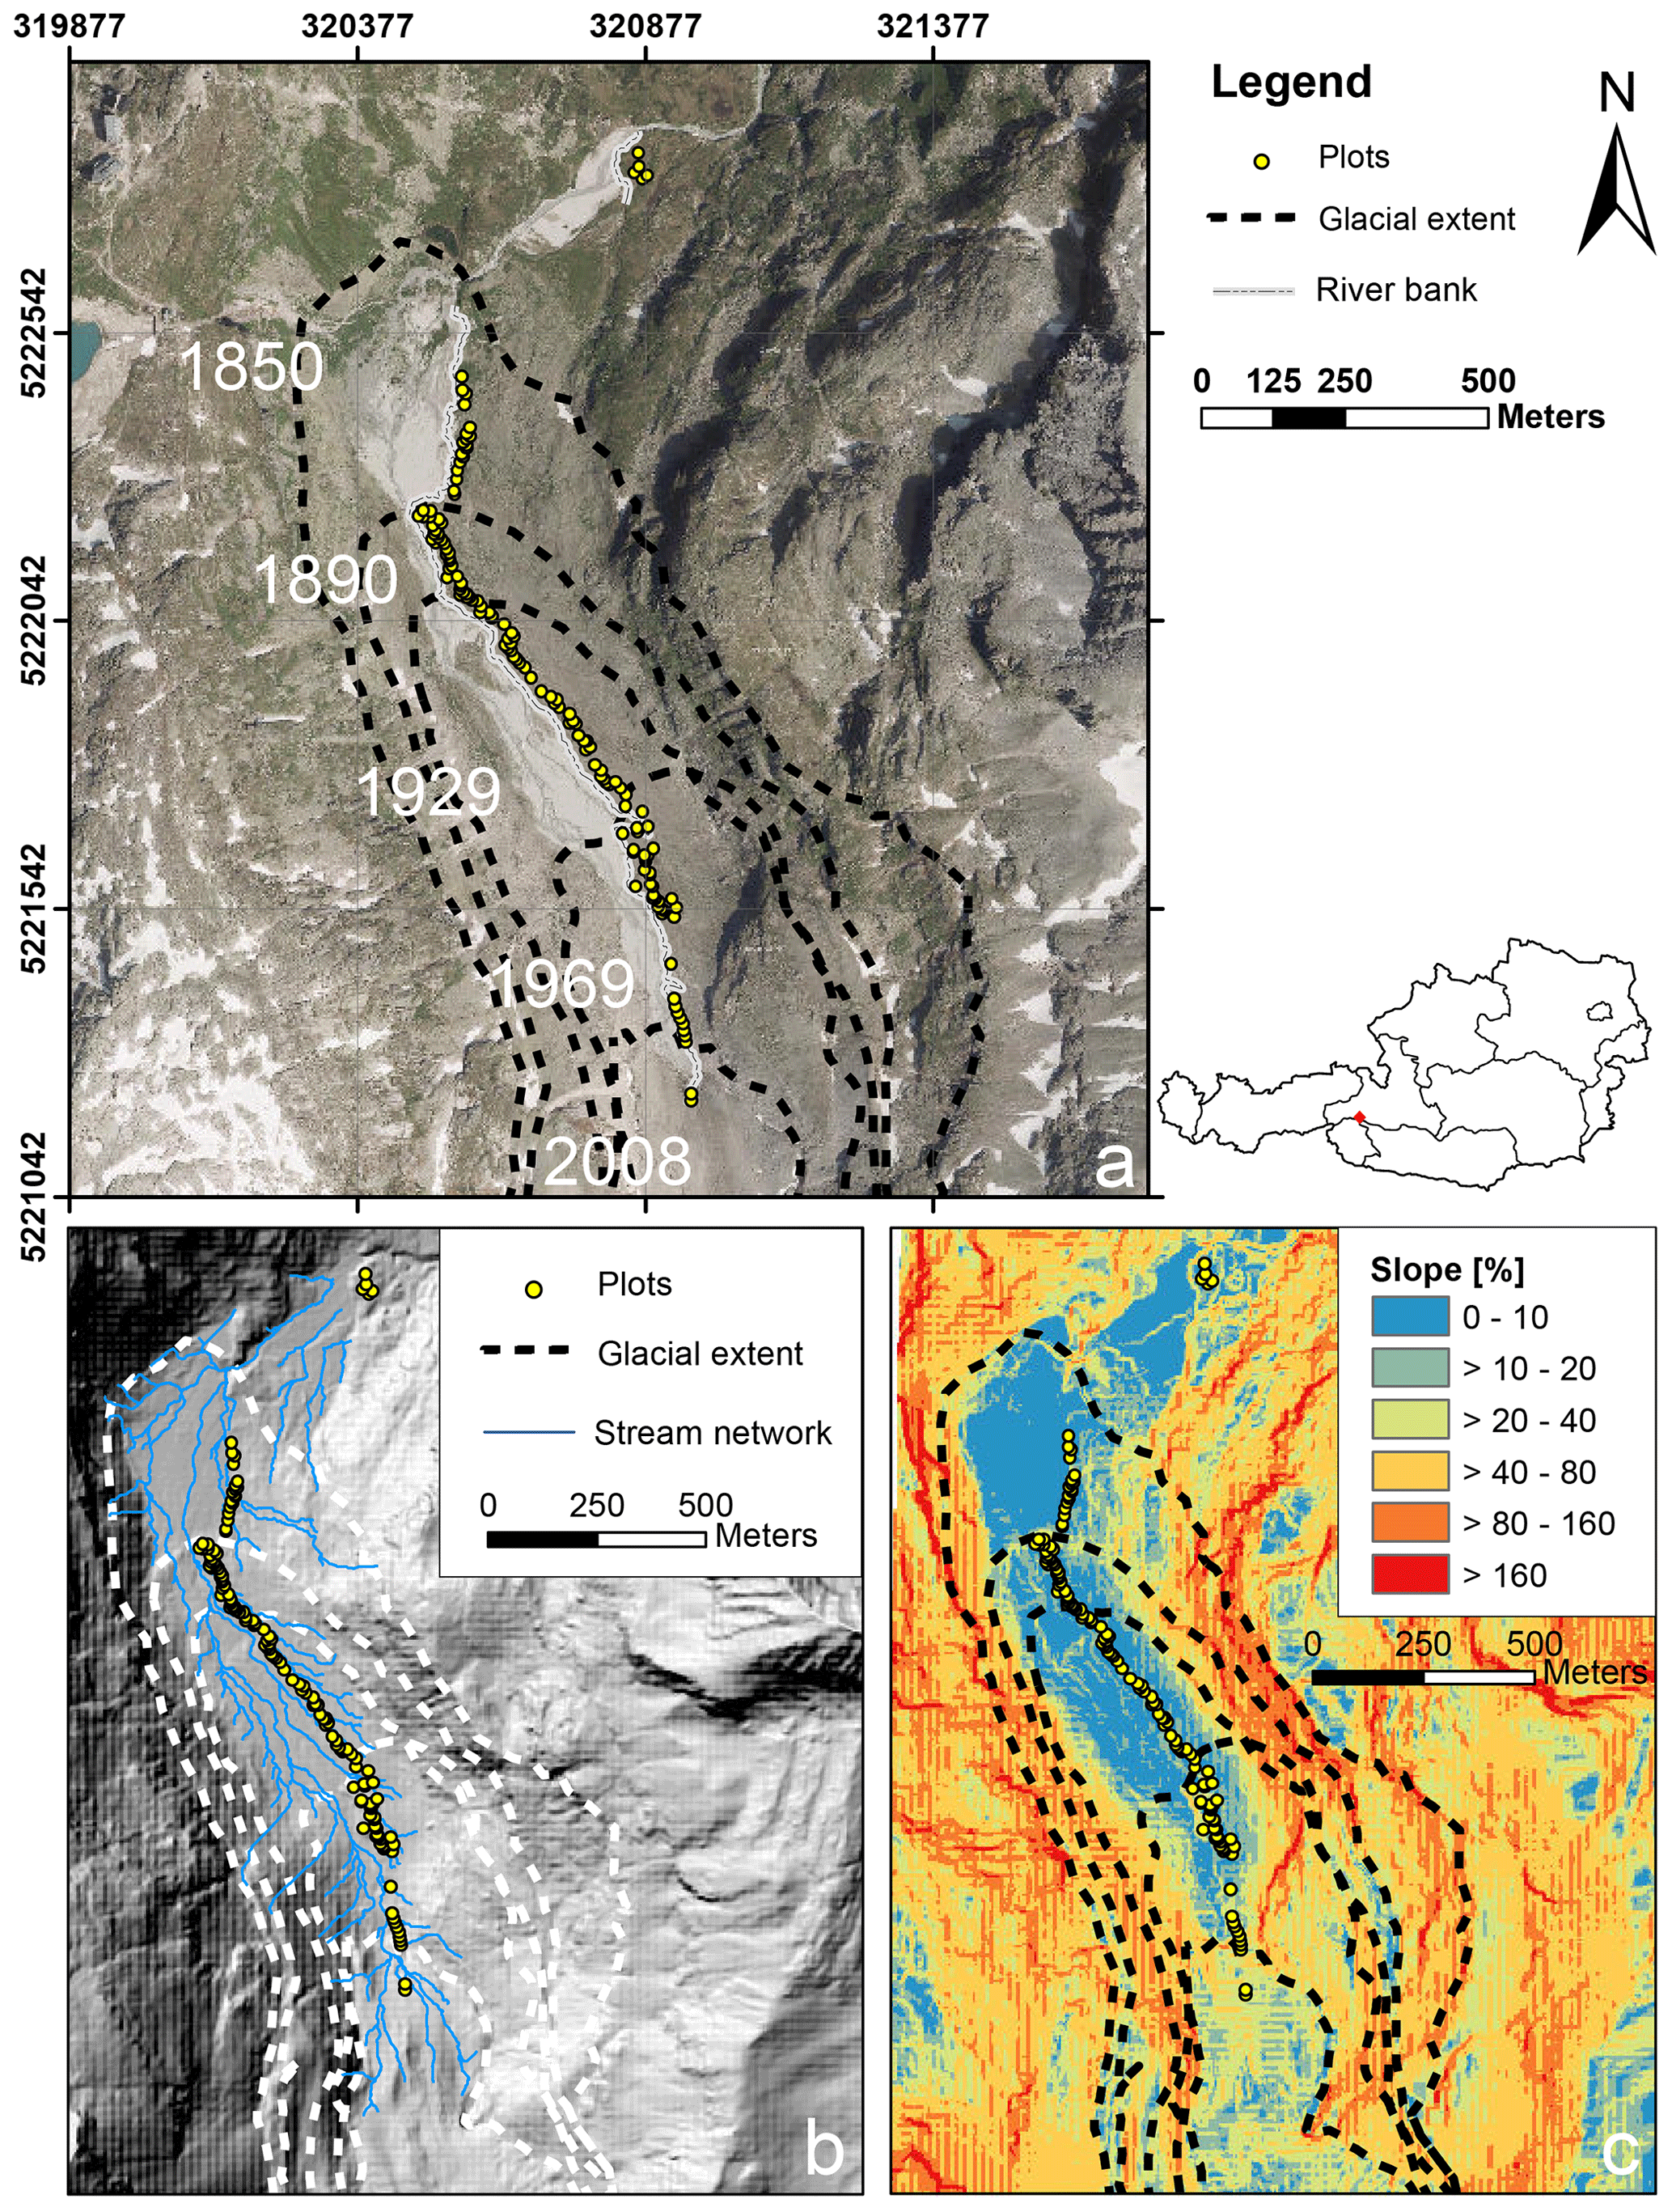
Figure 1Study area and plot location along the Ödenwinkelkees valley. (a) Location of the permanent plots along the glacier forefield. The glacial extents at different time points are given as dashed lines (orthophoto data source: http://basemap.at, last access: January 2020). (b) Digital elevation model (DEM) with modeled stream network (DEM data source: © SAGIS). (c) DEM with the spatial distribution of slope angles in the study area. Angles are expressed as a percentage ( %; DEM data source: © SAGIS).
The Ödenwinkel platform is registered as a long-term ecological research site at DEIMS-SDR (Dynamic Ecological Information Management System – site and dataset registry; https://deims.org/activity/fefd07db-2f16-46eb-8883-f10fbc9d13a3, last access: June 2020).
2.2 Plot design
The location of each plot is defined by a square with 1 m side length and the ground anchor as the center of the plot, resulting in an area of 1 m2. One tip of the square is pointing towards north, allowing the alignment of the plots to a defined orientation. Each plot is divided into 100 grid cells (A1–J10, 0.1 m × 0.1 m; Fig. 2a). In summer 2019, we buried one thermologger (MF1921G iButton, Fuchs Elektronik, Weinheim, Germany) per plot, took soil samples in two grid cells, and located pitfall traps in the same cells where possible. Because of the heterogenous distribution of rocks and sediments within each of the plots, it was not possible to take these measurements in the same grid cells in all the plots. However, we recorded the grid cells for each of the measurements per plot, allowing the rediscovery of the exact positions in future monitoring events (see Supplement 1).
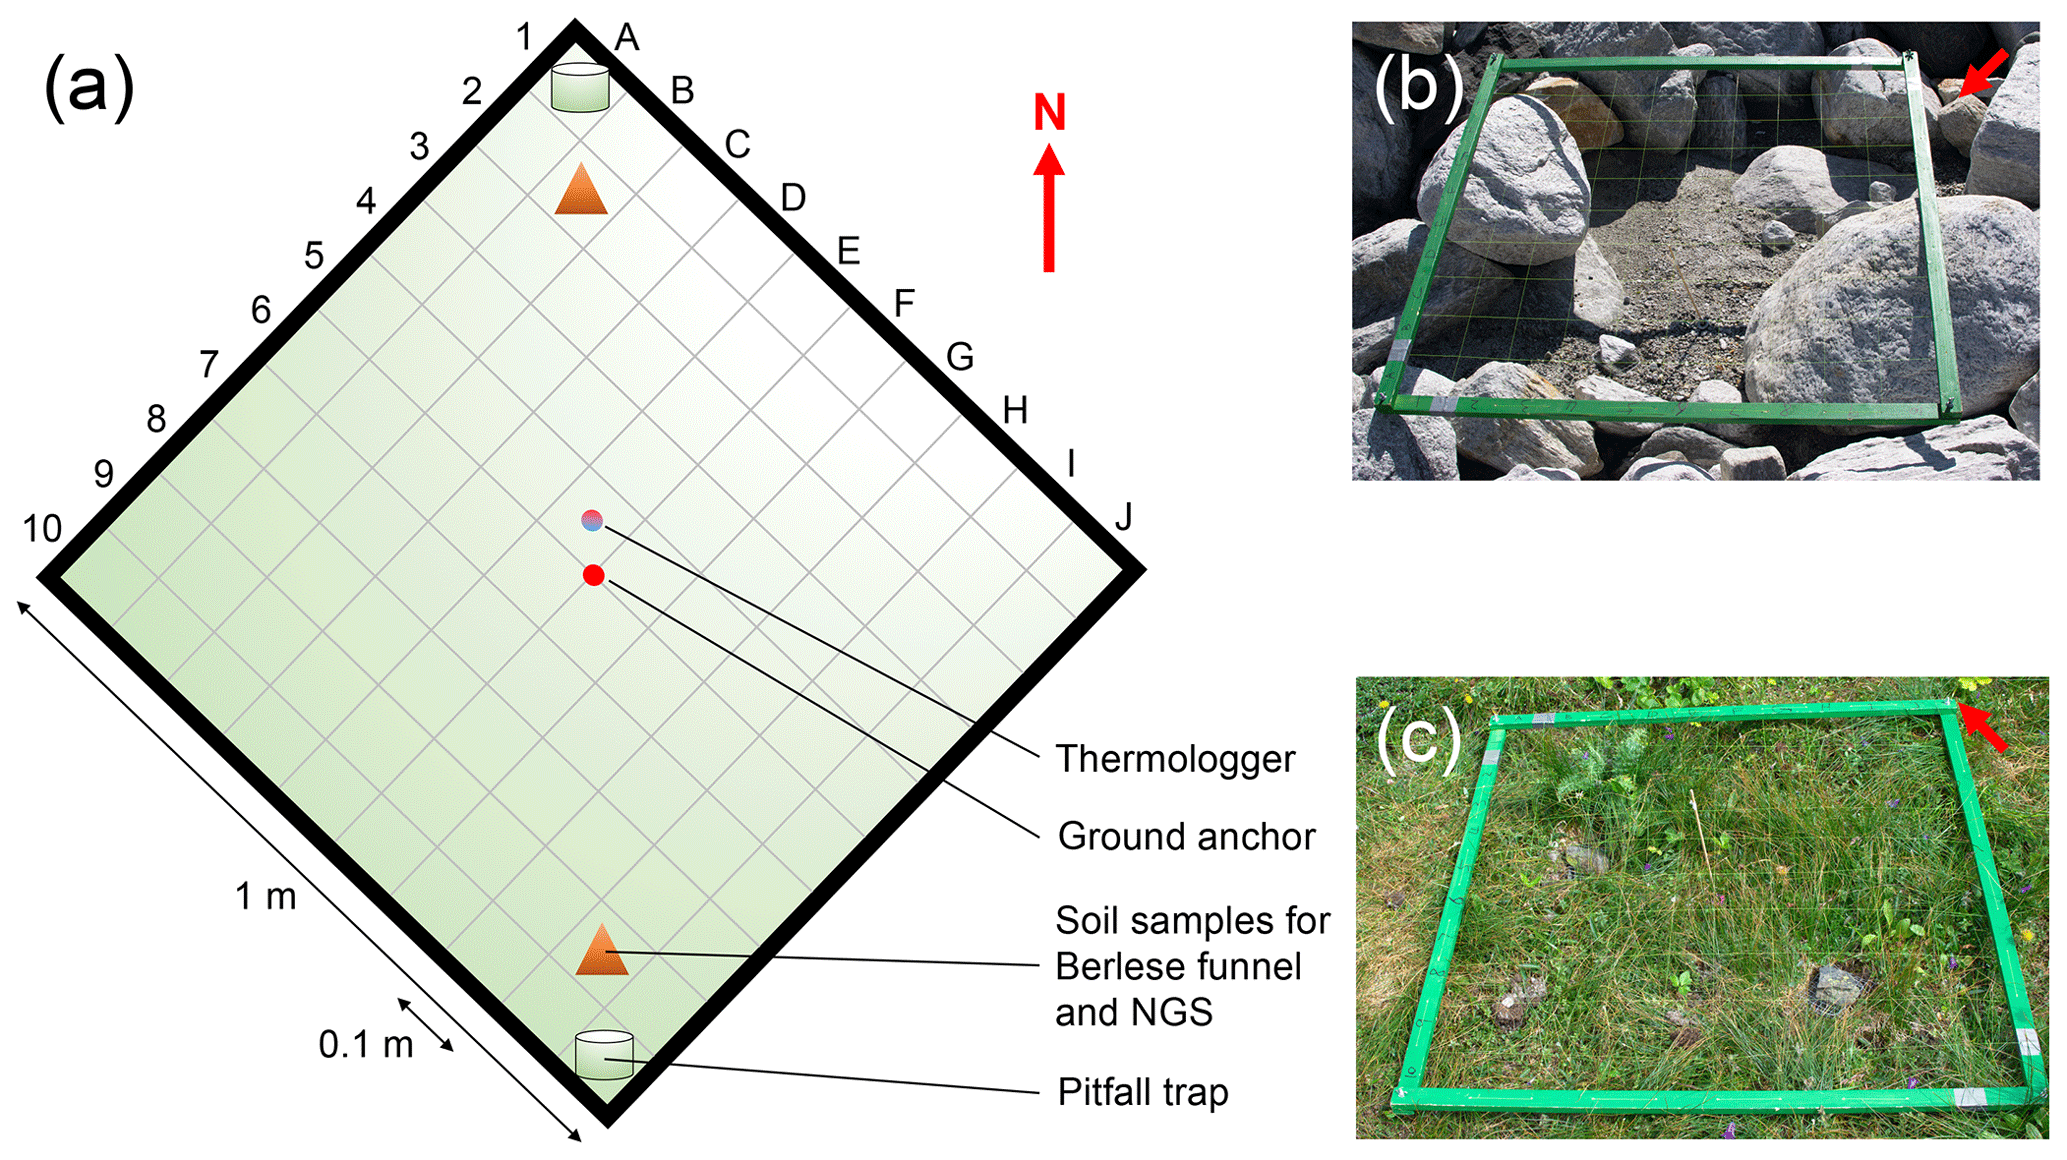
Figure 2Plot design. In summer 2019 we established n=140 plots along the successional gradient of the Ödenwinkelkees glacier in Land Salzburg, Austria. The majority of the plots (n= 135) were established within the glacier forefield, i.e., the area that was covered by ice at the latest glacial maximum. Another n= 5 plots were established outside the glacier forefield in areas unaffected by geomorphological influences (i.e., age ≫ 170 years). Location of plots can be found in Fig. 1 and Supplement 1a. Each plot is defined by a square with 1 m side length and a ground anchor as the center of the plot, resulting in an area of 1 m2. One tip of the square is pointing towards north (red arrow). Each plot is divided into 100 grid cells (A1–J10). These grid cells allow the rediscovery of the position of samples taken within the plot. Note that the locations of the measurements (thermologger, soil samples, and pitfall traps) are located at different positions and grid cells in each plot (see Supplement 1), accounting for the heterogenous distributions of rocks and soil in each of the plots. An early-succession (b, plot_002) and an old-succession plot (c, plot_123) are shown.
2.3 Inventory in 2019
From July to September 2019 we conducted a full inventory of the n= 140 plots considering abiotic and biotic factors. In order to reduce the covariation between seasonality of the organisms with plot age due to sampling of plots in the same order as they are located in the study area, we randomized the order in which every survey was performed. For that purpose, we assigned the 140 plots to 10 sections. Sections 1–9 include 15 plots each (plots 1 to 135 within the glacier forefield), and Sect. 10 includes the remaining 5 plots outside the glacier forefield (136–140). These sections were visited in a random order for the inventory.
2.4 Plot survey
For each plot, we recorded the abiotic and biotic properties (Supplement 1), including percentage of bare ground, rock and scree as abiotic features, cover of litter, lichens on rocks, lichens on soil, bryophytes on rocks, bryophytes on soil, and vascular plants as biotic features. Abiotic features were measured with a resolution of a quarter of a grid cell and biotic features with a resolution of a tenth of a grid cell, representing 0.25 % and 0.1 % of total possible plot cover, respectively. We recorded the predominant lithological property and the geomorphological process that deposited material on each plot. Additional information, such as exact coordinates, elevation, aspect, slope, distance to closest stream, distance to and plot height above main riverbank, and surface roughness index, were either directly exported from the GPS device or later retrieved from a digital elevation model (1 m LIDAR DEM, Land Salzburg). Additionally, we took up to two soil cores (7.5 cm diameter, 5 cm depth, grid location of soil cores corresponds to location of Berlese traps in Supplement 1) from the northern and southern part of every plot for potential analyses of soil properties such as pH value or grain size.
Temperature of plots
On each plot we installed a temperature logger at a depth of 3 cm below ground, located 10 cm north of the plot center. The thermologgers were set to start on 13 August between 09:00 and 09:10 MESZ (UTC+2). Temperature will be recorded every 255 min at a resolution of 0.5 ∘C, and loggers will be collected after 2048 measurements (362 d) in 2020. These data will allow modeling of plot microclimatic heterogeneity, which has been shown to affect plant species diversity, composition, and interactions between plants and other organisms (Ohler et al., 2020).
2.5 Plant diversity survey
On each plot we identified all vascular plant species, selected moss species (Niphotrichum canescens, Grimmaceae; Polytrichum piliferum, Polytrichaceae; and Dicranoweisia crispula, Dicranaceae), and estimated their cover with a resolution of 0.1 %. In addition, we identified and recorded the presence of all bryophyte species on each plot. Two vegetation surveys were conducted in early July (covering all plots) and early September 2019 (covering one plot per section).
2.6 Plant trait measurement
For all plant species that occurred on at least 10 of the 140 plots, we recorded plant traits including plant height, leaf area, dry leaf weight, and specific leaf area. We measured plant height in the field and collected the youngest fully developed leaf of plant individuals. For the three intensively studied plant species (defined below), we phenotyped up to three individuals on every plot on which they occurred. In addition, we phenotyped every plant species that was present on at least 10 plots throughout the successional gradient three times. For these n= 45 species, up to five individuals were phenotyped on the youngest, the oldest, and the intermediate plot where they occurred. If an insufficient number of individuals occurred within the plot, we chose the closest-growing individuals outside of the plot. Collected leaves were scanned using an HP ScanJet 200 (HP Inc., Wilmington, USA) along with a 1 cm2 square as a calibration reference. We used image analysis software ImageJ (Schneider et al., 2012) to calculate leaf area from the digital leaf scans. After scanning, leaves were dried for 3 d at 60 ∘C and weighed. Specific leaf area was calculated as leaf area divided by dry leaf weight. Field data were complemented with phenotypic data (e.g., life form, type of reproduction, pollen vector) available in online databases such as BiolFlor (Klotz et al., 2002).
2.7 Definition of intensively studied plant species
Based on the vegetation survey, we identified three plant species that will be intensively studied. We chose one plant species that occurs throughout the succession and one plant species each for early and late succession. For each plant species, we determined the total number of plots where the plant species occurred, the youngest and oldest plot of occurrence, and the mean plot number. Additionally, we used the machine learning algorithm “random forest” for regression (Breiman, 2001), using the R package randomForest to identify plant species that are representative of young, intermediate, or old parts of the chronosequence or those that increase or decrease with successional age. We used plot number (proxy for time since deglaciation) as a dependent variable and the cover of each plant species per plot as explanatory variables. For random forest analysis we chose the number of plant species divided by as the number of variables randomly sampled as candidates at each split, and we grew a total of ntree= 10 000 trees. For each plant species we extracted variable importance (%IncMSE), informing about the degree to which the chronosequence of community establishment is reflected by the cover of each plant species. Low %IncMSE values indicate species that either occur on few randomly distributed plots or have an even cover on plots throughout the gradient. High %IncMSE values indicate species that either increase (or decrease) in cover along the gradient or are present only in a given range within the chronosequence. Thus, the first of the intensively studied plant species that occurs throughout the succession needs an occurrence ranging from young to old plots and a low %IncMSE value. The other two intensively studied plant species should be restricted to either younger or older plots and have a high %IncMSE value. Information on these characteristics for all plant species is given in Supplement 2.
2.8 Animal (mostly arthropod) diversity
Arthropod diversity was surveyed with pitfall traps. To catch aboveground arthropods, we used plastic boxes (8.1 cm × 10.8 cm) as pitfall containers and filled them with 150 mL of a 30 % ethylene glycol–water mixture. A wire grid with 1.3 cm × 1.3 cm mesh size was put on every trap to avoid catching larger animals. A hole was punched in containers (1.5 cm below the rim) to allow drainage. Traps were active for a total of 14 d and were emptied twice after 7 d each. Samples were stored in 70% ethanol. Two pitfall traps were installed on each plot (north and south). If the topography of a plot did not allow a north–south orientation, we placed them in east–west direction and noted the exact location of the traps on the grid (location noted in Supplement 1a). The abundance of all arthropods, excluding Collembola and Acari, larger than 3 mm was counted. The abundance of Collembola and Acari and of animals smaller than 3 mm was estimated based on random samples of aliquots of the total sample. All arthropods and other animals are currently identified to the order level, but samples are stored for reidentification.

Figure 3Diversity and plant cover at the n= 140 study plots. (a) The estimated year of deglaciation decreases with plot number. For each plot the plant cover (circle size) and diversity (circle color) are given. The upper bar on the top of the panel informs about the lithological category of each plot, the lower bar about the geomorphological process responsible for the deposition of material on the plots. Plot age increases with plot number. (b) Plant Shannon diversity (green) and d′ (blue) as a function of plot age (old plots are on the right, young plots on the left). d′ informs about the degree of uniqueness of each plot regarding the composition of plant species. Low d′ values indicate that plots share all or most plant species with many other plots; high d′ values indicate that plots are vegetated with plant species that are unique or shared with few plots only.
2.9 Sampling of microbial communities associated with plants and soil
We sampled microorganisms (bacteria and fungi) inhabiting the phyllosphere of plants and the soil of each plot. Samplings were performed within 11 d during the main vegetative period (31 July–10 August 2019). Collected samples were directly transferred to ZR BashingBeads Lysis tubes containing 750 µL of ZymoBIOMICS lysis solution (ZymoBIOMICS DNA Miniprep Kit; Zymo Research, Irvine, California, USA). Leaf and soil samples were collected using sterilized forceps (dipped into 70 % ethanol and flamed) to avoid contamination. We sampled bacterial and fungal communities in the phyllospheres of three intensively studied plants (see above) on every plot where they occurred. Furthermore, we took three samples of vascular plant species that occurred on 10 or more plots. In these cases, we took samples on the oldest, the youngest, and the intermediate plot containing them. Soil microbiome was sampled in two locations within each plot (coinciding with the location of pitfall traps if possible) whenever there was enough soil to proceed. With a bulb-planting device, we took soil cores with an approximate depth of 5 cm, from which we took soil samples at 3 cm depth. In plots where it was not possible to take soil cores, we lifted boulders and took microbiome samples from sediments that were underneath these rocks. Additionally, we took microbiome samples of the three selected bryophyte species (see above) and rocks associated with them on 10 plots along the successional gradient. Rock microbiome was sampled by using a sterile cotton swab moistened with a lysis solution. The swab was swiped over the rock surface, and the tips were cut with sterile scissors. Within 8 h after collection of microbial samples, ZR BashingBeads Lysis tubes were sonicated for 7 min to detach microorganisms from the surfaces. In the case of plant leaves and bryophyte tissues, we removed them from tubes next to a flame with sterile forceps after the sonication to decrease the amount of plant DNA in the samples. Subsequently, all microbial samples were shaken using a ball mill. In cases where we were able to fully remove plant tissues from collection tubes and soil samples, tubes were shaken for 9 min with a frequency of 30.0 s−1. In some cases it was not possible to fully remove plant tissues from tubes, and samples were shaken for 5 min at 20.0 s−1. Microbial DNA was extracted using the ZymoBIOMICS DNA Miniprep Kit following the manufacturer's instructions. Next-generation sequencing and microbiome profiling of isolated DNA samples were performed by Eurofins Genomics (Ebersberg, Germany). Further details on the procedure can be found in Supplement 3. Prior to the statistical analysis of bacterial and fungal communities associated with leaf surfaces, we performed a cumulative sum scaling (CSS) normalization (R package metagenomeSeq v1.28.2) on the count data. In this paper we report on the diversity of bacteria and fungal communities associated with soil samples.
2.10 Test for spatial autocorrelation
Many glacier forefields are characterized by an overall steady retreat of the glacier since the Little Ice Age, which results in an environmental and temporal gradient that affects the assembly of communities. In such a setting, these gradients are also spatially correlated, which may interfere with the conclusions concerning abiotic and biotic effects on community composition and species interactions (Hawkins, 2012; Kühn and Dormann, 2012). In order to document the spatial autocorrelation (SA), we tested for SA in our dataset using Moran's I (Moran, 1948) based on geographic distance between plots using the R package spdep (Bivand and Wong, 2018), assessing significance levels with 1000 permutational steps.
The n= 140 plots established in 2019 follow the successional gradient of the glacier forefield in the south–north direction for about 1500 m within an elevational range of 119.6 m. The five plots outside of the glacier forefield are located about 500 m northeast of the glacier forefield in an area that has been unaffected by glacial activities for at least 170 years (Fig. 1, Supplement 1a). In total, we identified n= 107 plant species on the n= 140 plots; plot_001 and plot_006 were unvegetated. We assigned the plots to predominant geomorphological processes that deposited material on the plots: n= 34 plots are located on basal till, 60 plots are composed of supraglacial debris, 38 plots are by glaciofluvial deposits, 2 plots are covered by two or more sediment types, and for one plot no processes could be determined. The five plots outside of the glacier forefield were treated as a separate group (Fig. 3a, Supplement 1a). Furthermore, the plots could be assigned to four lithological categories: schist (n= 18 plots), gneiss (30 plots), fine material (57 plots), and mixed lithology (34 plots); one plot could not be assigned to either of the categories (Fig. 3a, Supplement 1a).
Plant cover linearly increased with increasing time since deglaciation (Pearson's product-moment correlation: t138=9.31, p<0.001, r2=0.39; Fig. 3a). As expected, plant cover was highest in the five plots outside of the glacier forefield (analysis of variance, ANOVA: , p<0.001; Tukey multiple comparisons of means: p≤0.007 in comparison to the other processes); the geomorphological processes that deposited material onto the plots otherwise mostly did not explain variation in plant cover except a significant difference between the plant cover on plots composed of supraglacial and basal deposits (Tukey multiple comparisons of means: p<0.01), with higher plant cover on plots covered by basal till (Fig. 3a, Supplement 1a and b). In contrast, plant cover was strongly affected by lithology (ANOVA: , p<0.001), with significant differences between all the categories except for gneiss and mix (according to Tukey multiple comparisons of means: fine > gneiss = mix > schist; Fig. 3a, Supplement 1a and 1b). The high plant cover on plots with fine material may represent a biogeomorphic feedback where plants support the establishment of soils and soils the establishment of further plants (Borin et al., 2010; D'Amico et al., 2014; Schmidt et al., 2008), which may deserve future investigations.
Plant Shannon diversity peaked on plots that have been deglaciated for roughly 110 years (Fig. 3b; quadratic model: , p<0.001, r2=0.31), showing a clear increase in plant diversity in the first 110 years after deglaciation but a decrease after succession proceeds, i.e., the five plots outside the glacier forefield had a lower plant diversity than the ∼ 110-year-old plots. Plant diversity was largely unaffected by surface material origin (depositional processes; ANOVA: , p=0.017), with a slightly higher diversity on plots covered by basal till on average compared to those composed of supraglacial debris (Tukey multiple comparisons of means: p=0.042; all other pairwise comparisons were nonsignificant; Fig. 3a and b, Supplement 1a and 1b). Plant diversity was affected by lithology, with the lowest diversity on plots with schist (ANOVA: , p<0.001; Tukey multiple comparisons of means between schist and all other lithologies: p≤0.004; Supplement 1a and 1b). Schist was also the predominant lithology on younger plots (i.e., few years after deglaciation).
Next to diversity indices, we adopted bipartite network analysis to inform about the plots' plant composition by defining plant species occurring on the plots as well as the plots themselves as nodes; the edges inform about the presence or absence of the plant species on each of the plots, weighted by the plant cover of each species on each plot. We calculated d′ for each plot, which is a network index informing about the complementary specialization of the plots (Blüthgen et al., 2006). In other words, d′ informs whether plots are characterized by a unique set of plant species (i.e., specialization, high d′ values) or by plant species that occur on many other plots (i.e., generalization, low d′ values). The d′ values had a bimodal distribution, with higher values at very young (few years after deglaciation) and very old plots (many years after deglaciation). Plots that deglaciated about 90 years ago were most generalized in the plant species composition, which means that these middle-aged plots share the occurrence of plant species with many other plots (Fig. 3b; quadratic model: , p<0.001, r2=0.43). These results suggest that pioneer species present on plots a few years after deglaciation are replaced by plant species that are representative of Alpine successions early in community assembly. Plots outside the glacier forefield were vegetated with species that cannot be found on many plots within the glacier forefield or that have a low coverage on these plots. The d′ of plots was negatively correlated to Shannon diversity of plots (Pearson's product-moment correlation: , p<0.001, r2=0.44), indicating that plant communities are most diverse after a few decades of succession and also share a core of plant species that can be found on many of the plots. This notion is also supported by nonmetric multidimensional scaling (NMDS) based on Bray–Curtis distances of vegetation composition (cover per species), where recently deglaciated (young) plots and some late successional plots as well as those outside of the glacier forefield occupy peripheral positions in the ordination (Fig. 4). Most other plots that were deglaciated between 30 and 145 years ago are clustered at the center of the ordination (Fig. 4). Accordingly, the position of each plot within the ordination, measured as the Euclidean distance of each plot to the origin of the ordination, strongly and positively correlated to d′ (Pearson's product-moment correlation: t136=18.39, p<0.001, r2=0.71) and negatively to the diversity of the plots (, p<0.001, r2=0.59). This again supports the notion that a typical successional vegetation is formed a few decades after deglaciation that is slowly replaced by a climax vegetation. This continuous shift from early to late to climax vegetation is also evidenced by the clear signal of plot age (and overall plant cover) in the ordination (fit of vectors to ordination, age: p<0.001, r2=0.40; cover: p<0.001, r2=0.64; Fig. 4). The distribution of plant species and plant diversity is in line with the intermediate disturbance hypothesis (IDH) stated by Connell (1978) and also suggested as an explanation for plant diversity patterns along glacier forefields (Raffl et al., 2006). Based on our findings and the IDH, we hypothesize that the low plant cover in young and intermediate-aged plots offers a large number of niches to be filled by diverse plant species that do not directly compete for space and nutrients. With increasing plant cover, competition for these resources increases, too, which may lead to the dominance of few species, resulting in reduced plant diversity. Therefore, the Ödenwinkel research platform allows the testing of this and further ecological hypotheses and the comparison the assembly of diverse communities of various trophic levels and thus the establishment of multidiversity and ecosystem complexity.
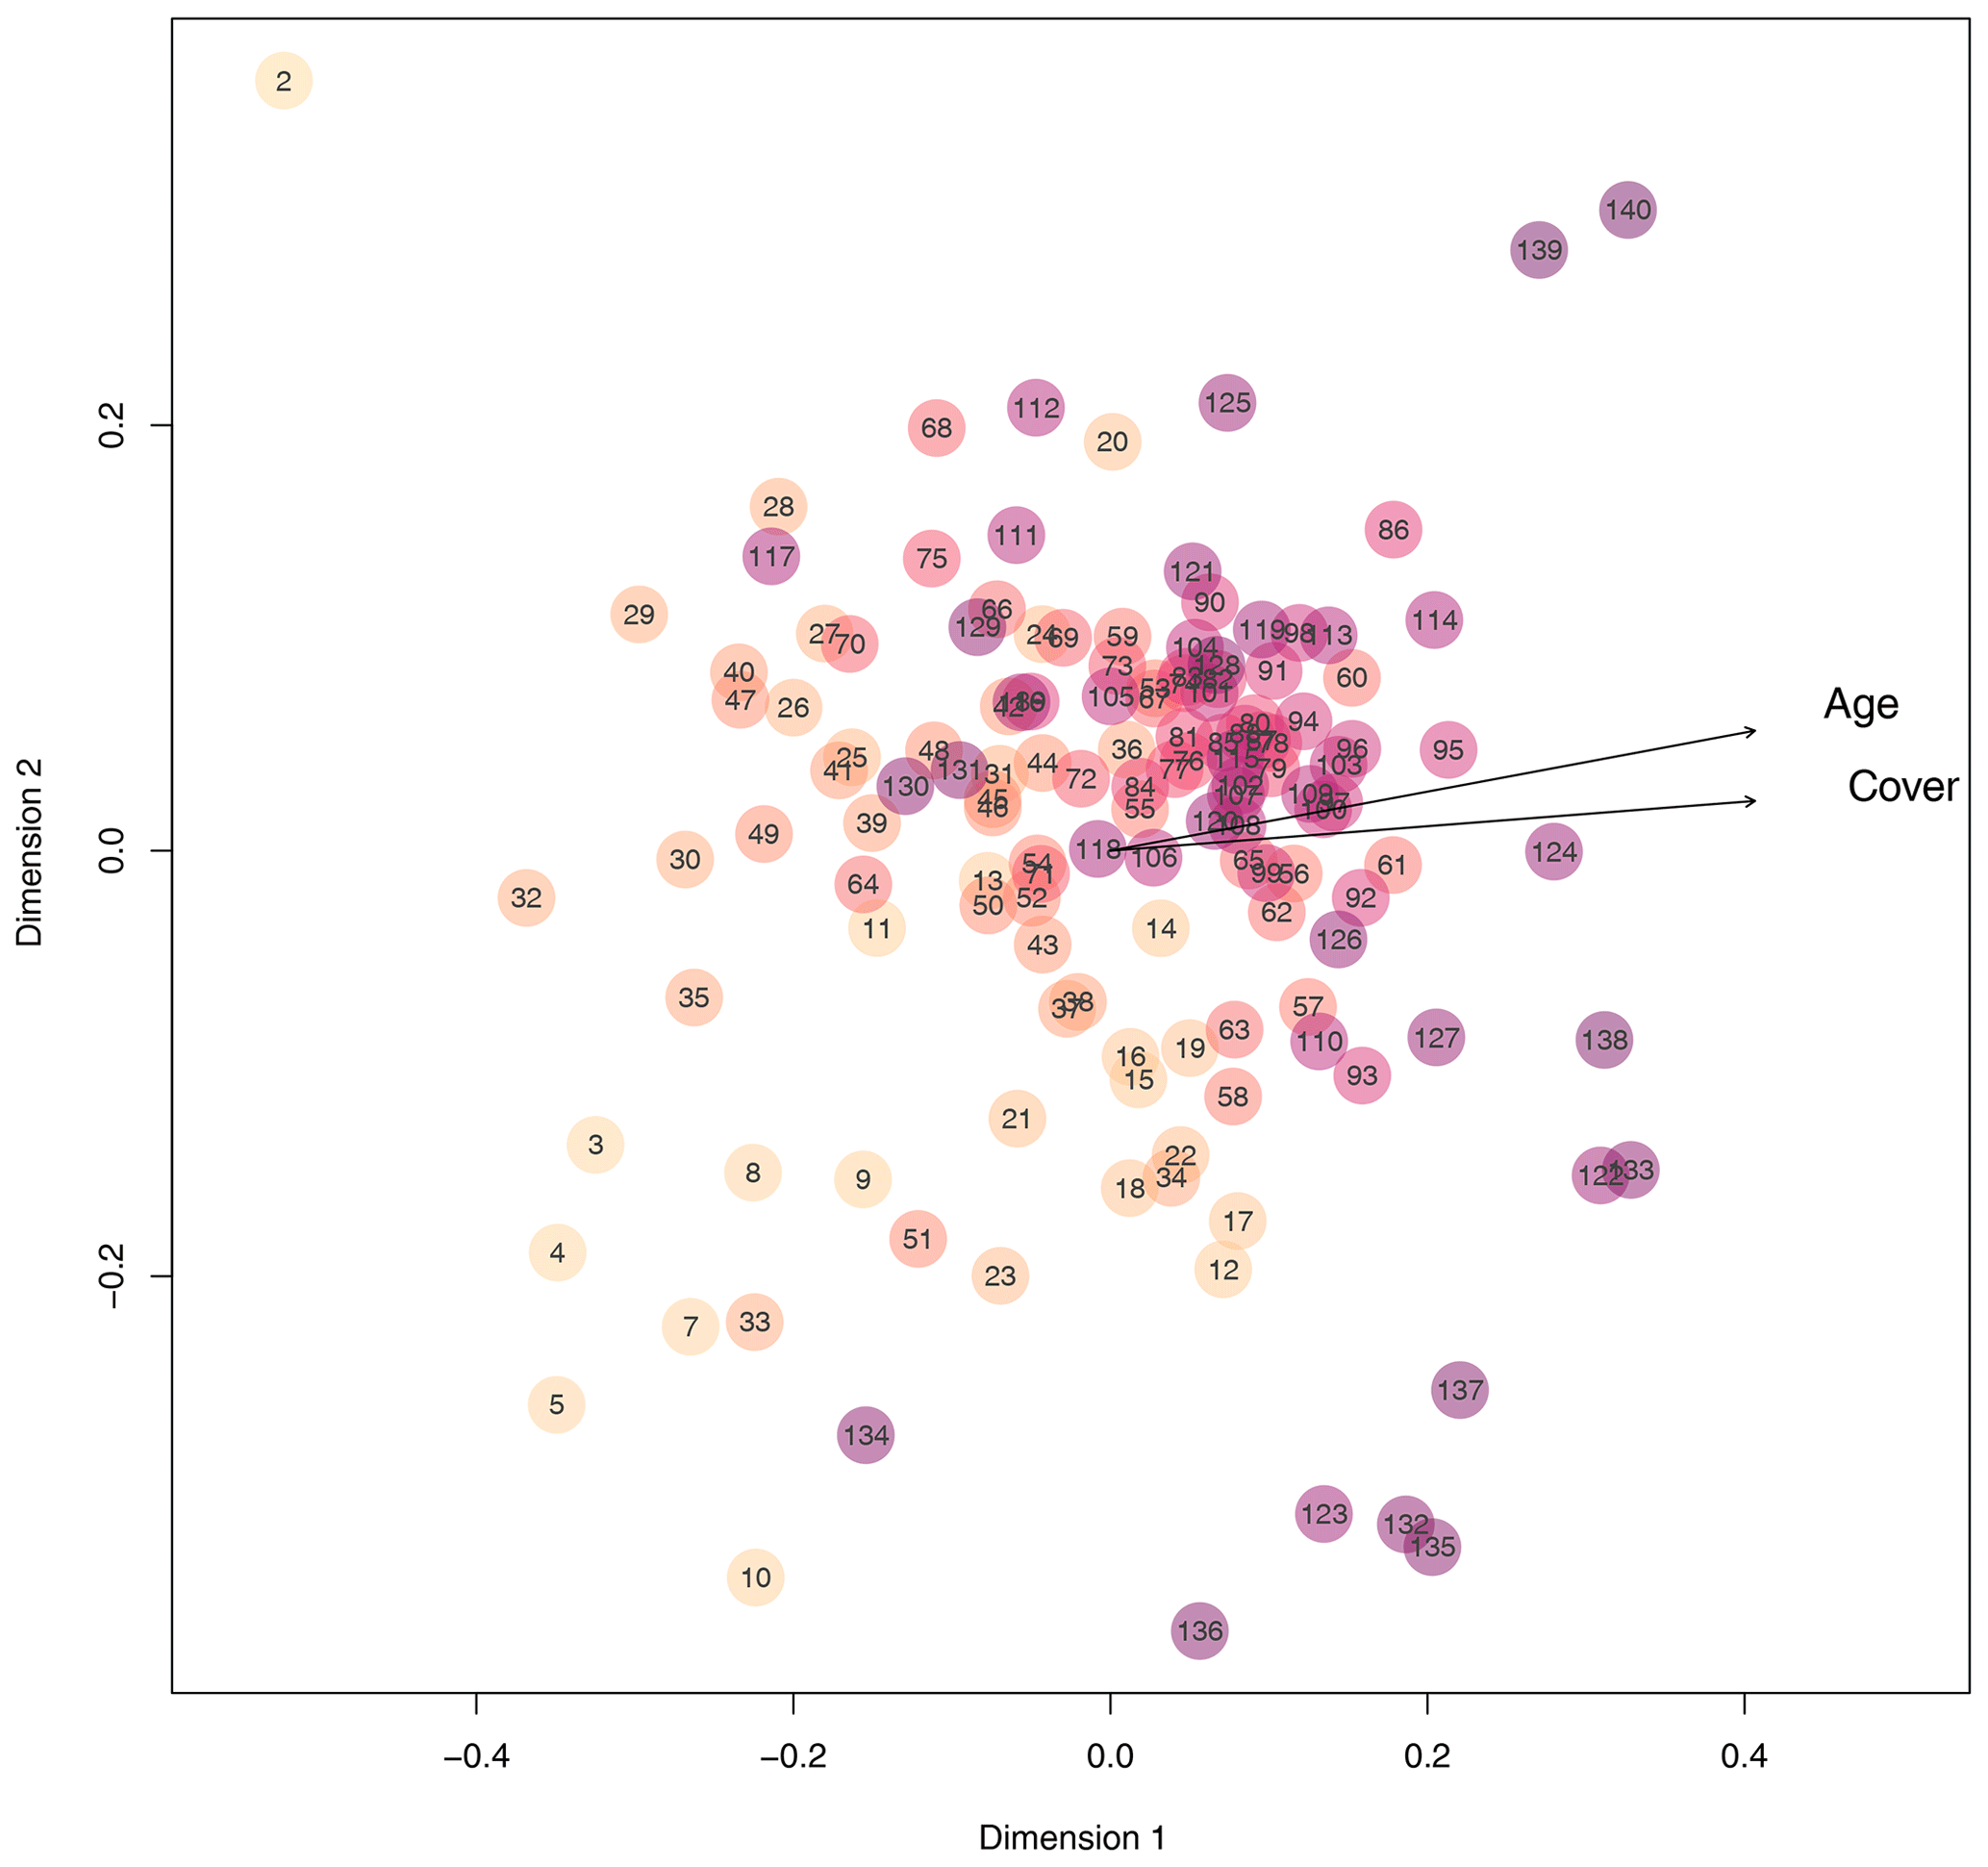
Figure 4Similarity of plots regarding quantitative plant species composition based on Bray–Curtis distances considering the cover of each plant species on each plot. The closer plots appear in the nonmetric multidimensional scaling, the more similar their plant species composition is. With increasing plot age, the color of the circles becomes darker. Arrows point towards increasing age and increasing total plant cover.
3.1 Intensively studied plant species
Based on the criteria described above, we identified Oxyria digyna (Polygonaceae, occurred on 27 plots) as representative of early successions, Trifolium badium (Fabaceae, 50 plots) as representative of late succession, and Campanula scheuchzeri (Campanulaceae, 116 plots) as the most widespread species along the successional gradient (Fig. 5). C. scheuchzeri individuals became larger (plant height) with plot age (Pearson's product-moment correlation: t114=5.63, p<0.001, r2=0.22); the other two focus species did not show a response in plant height to plot age (t≤1.78, p≥0.08, r2≤0.06). Leaf area of all three species varied independently of plot age (t≤1.39, p≥0.18, r2≤0.07). However, in all species we detected a strong positive correlation between leaf area and plant height (t≥3.12, p≤0.005, r2≥0.28). Both plant traits were unrelated to cover (t≤1.12, p≥0.23, r2≤0.01), except for the plant height of O. digyna, which was positively correlated to cover (t25=4.87, p<0.001, r2=0.49). C. scheuchzeri and T. badium displayed a unimodal abundance distribution along the successional gradient (quadratic model: F≥4.61, p≤0.015, r2≥0.12), both peaking at intermediate locations of their distribution range (Fig. 5). Abundance of O. digyna also peaked at intermediate locations of the species' distribution range, but we did not find a significant correlation with age (Fig. 5). These results suggest that the three selected focus species find ideal conditions in different stages of the succession and that these conditions become less well suited at the margins of their distribution ranges or are unsuited at parts of the succession in O. digyna and T. badium. This scenario provides the opportunity to study the biotic and abiotic factors that shape the realized niche (Junker et al., 2019) and therefore the ability of the species to grow and reproduce.
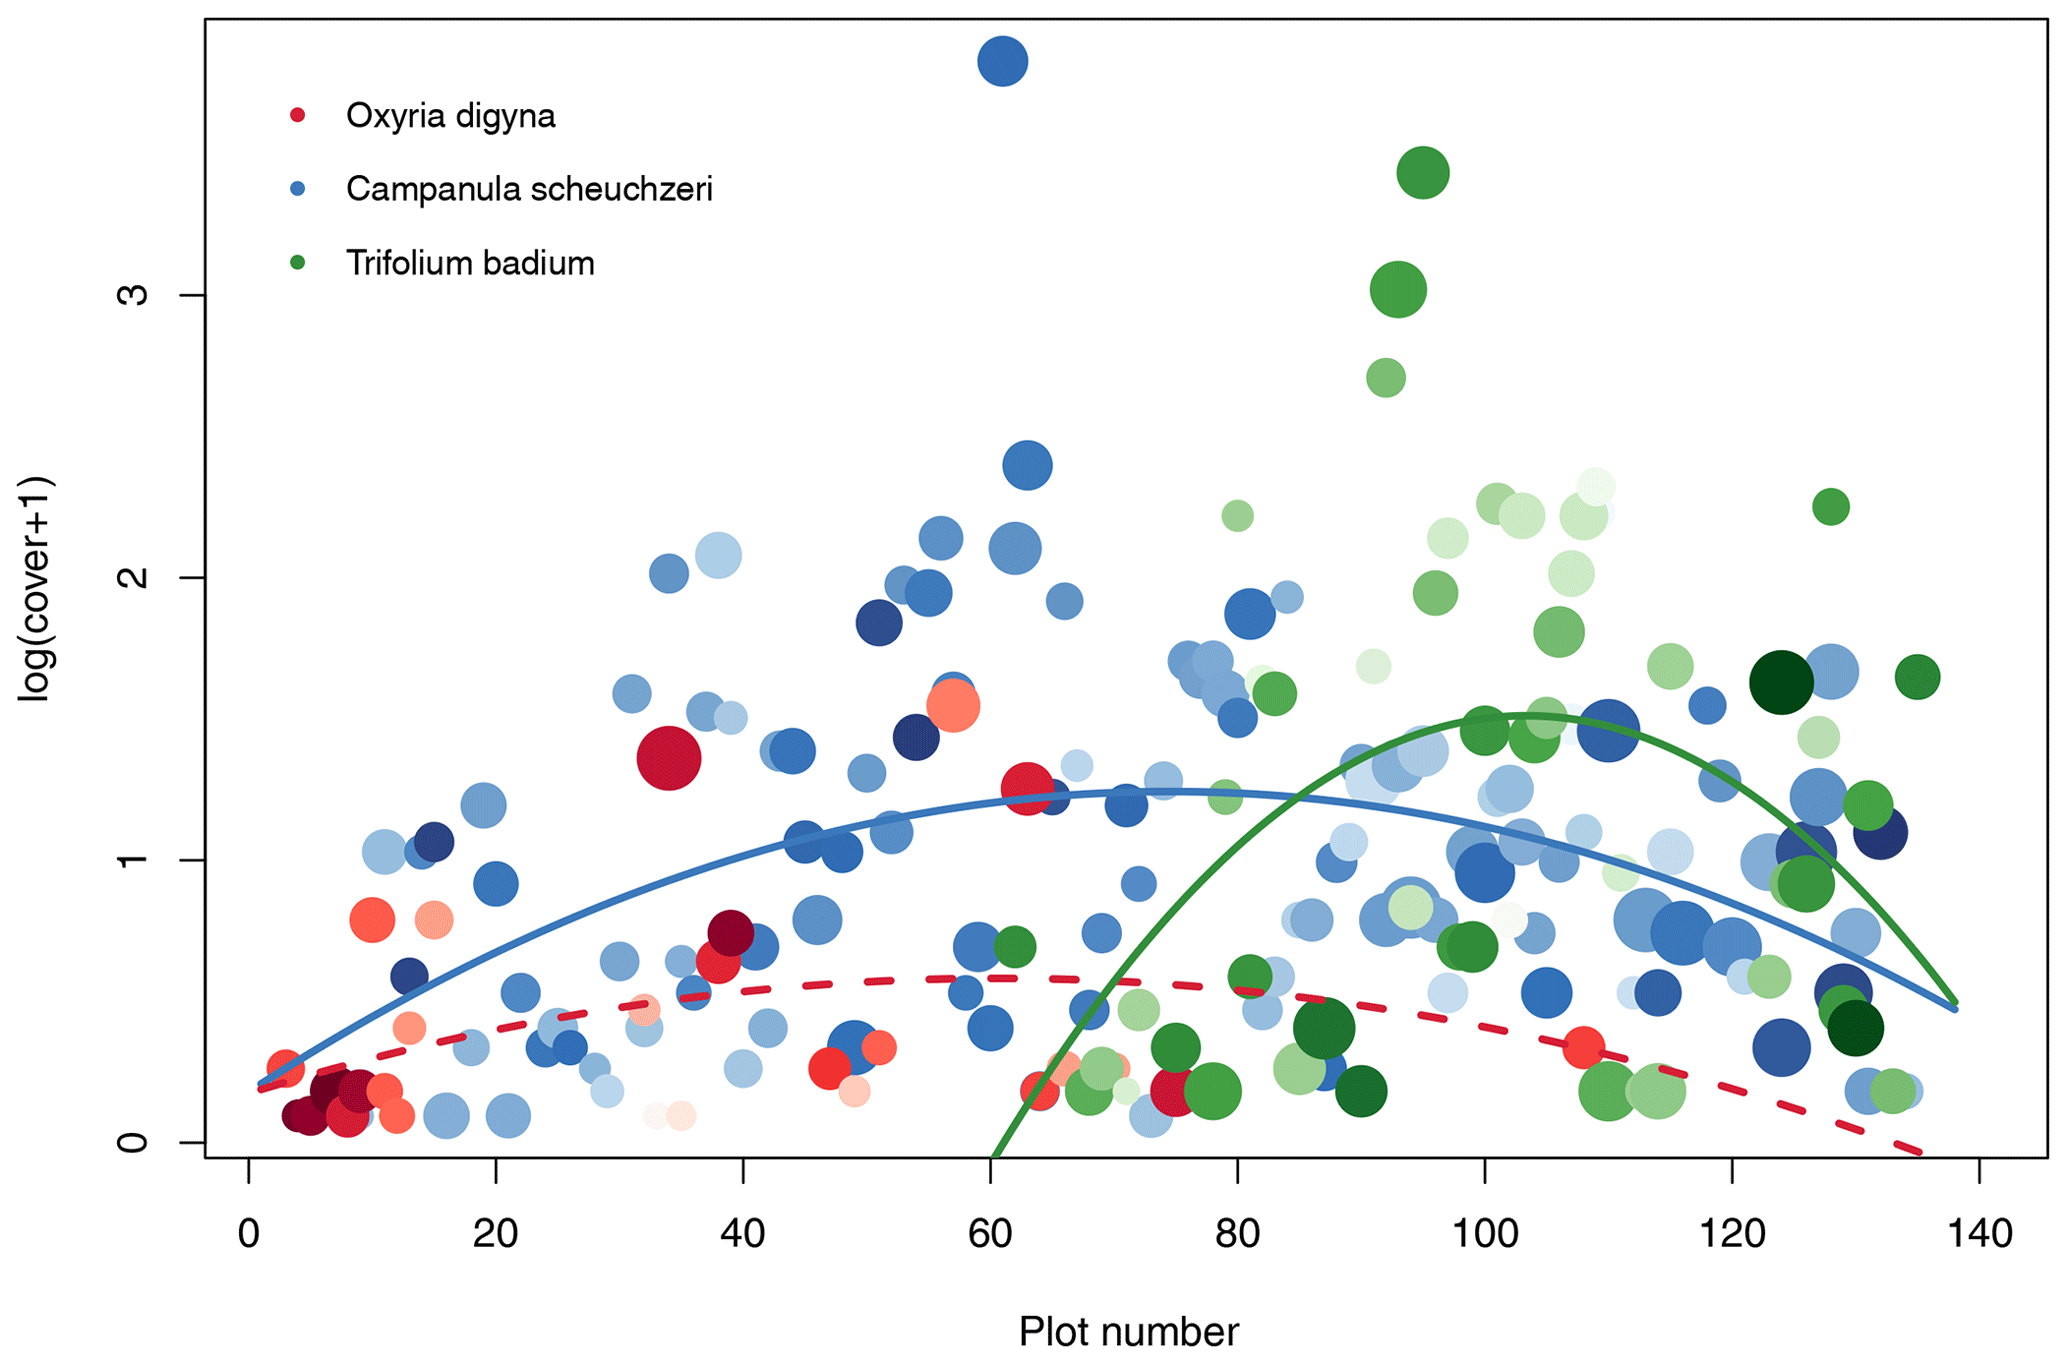
Figure 5Distribution of the three intensively studied plant species Oxyria digyna (Polygonaceae; red), Trifolium badium (Fabaceae; green), and Campanula scheuchzeri (Campanulaceae; blue). The abundance of each plant species given as log(cover+1) is given for the three plant species on each plot. Missing circles indicate that the species are absent from a given plot. Lines show significant quadratic regression models with plot number as an explanatory variable and cover as a dependent variable; the dashed line indicates a statistically nonsignificant association. The size of the circles is proportional to relative mean height of the species on each plot (plant height values are standardized for each species between 0 and 1); the darkness of the circles is proportional to mean leaf area, with light colors indicating relatively small leaves within a species and dark colors indicating larger leaves.
3.2 Diversity of animals, bacteria, and fungi
Next to plants, animals and microorganisms colonize glacier forefields in a successional manner (Brown and Jumpponen, 2014; Doblas-Miranda et al., 2008; Tscherko et al., 2003). On the Ödenwinkel platform, animal Shannon diversity peaked on plots that have been deglaciated for roughly 150 years (Fig. 6a; quadratic model: , p<0.001, r2=0.27) and therefore lagged behind the plant species diversity that peaked about 40 years earlier (see above). In contrast to plants and animals, diversity of microorganisms was not correlated to the successional gradient (Fig. 6a; , p≥0.121, r2≤0.031). The diversities of plants, animals, bacteria, and fungi did not vary independently from each other: we found positive relationships between the diversities of arthropods and plants, fungi and plants, and bacteria and fungi (Fig. 6b). These results confirm concerted changes in the diversity of different taxa along ecological successions, e.g., between microbes and plants (Brown and Jumpponen, 2014) or plants and invertebrates (Albrecht et al., 2010). Based on the results presented here, we cannot discriminate between the effects of mutual influences among the taxa, environmental factors, and random processes. Likewise, the direction of these effects cannot be directly assessed, i.e., whether microbes affect the composition of plant communities (Klironomos, 2002) or vice versa and whether plant–microbe interactions subsequently affect plant–animal interactions (Benítez et al., 2017; Karamanoli et al., 2020; Peters et al., 2017). However, the available data allow more detailed analyses to generate hypotheses to be tested in field or lab experiments.
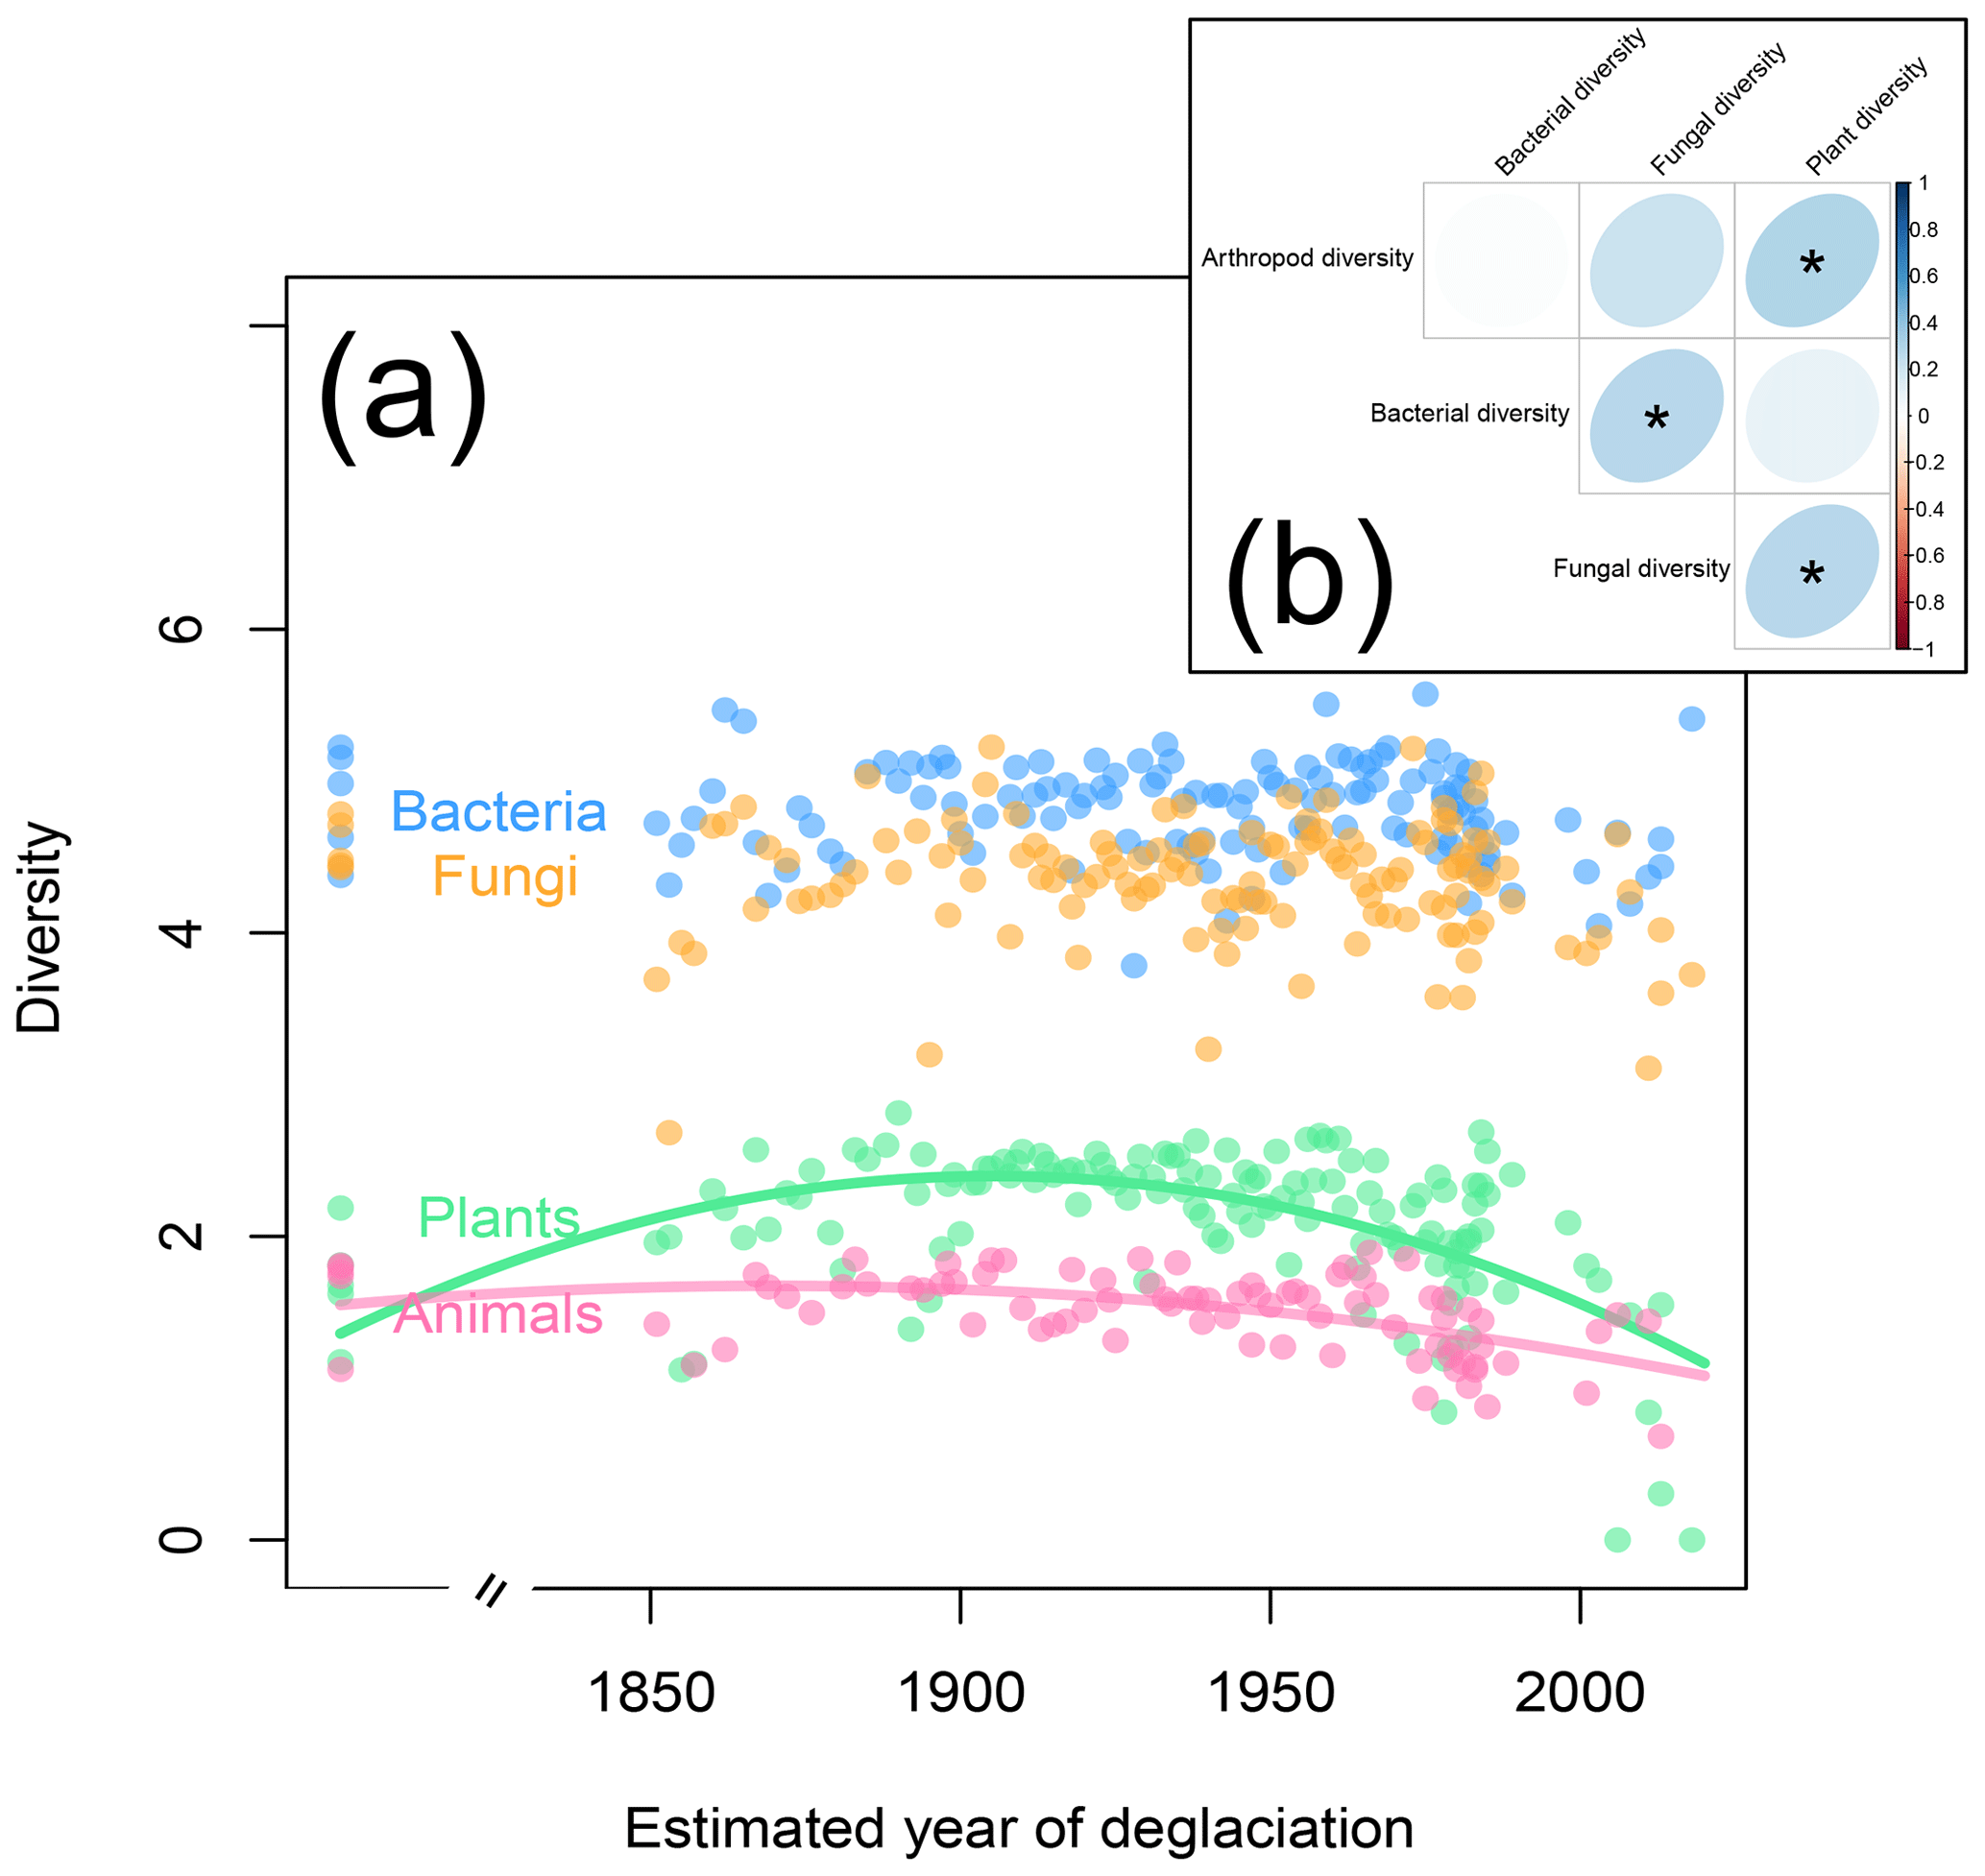
Figure 6Shannon diversity of plants, animals, fungi, and bacteria as a function of plot age. (a) As with plant diversity (see also Fig. 3b), animal diversity increases in the first years of the succession but slightly decreases on the oldest plots. In contrast, bacterial and fungal diversities vary independently of plot age. (b) Correlations between plant, animal, bacterial, and fungal diversity across the study plots. Significant correlations are marked by asterisks.
3.3 Spatial autocorrelation
As usual in many studies taking advantage of space-for-time substitution and environmental gradients (Baker and Barmuta, 2006; Pickett, 1989), we detected a strong spatial signal in the variation in abiotic (including lithology and geomorphic processes; mean Moran's ; p≤0.001) and biotic parameters (including bacteria diversity, fungi diversity, plant diversity, animal diversity, and plant cover; mean ± SD Moran's ; p≤0.01) that characterize the n= 140 plots. From a devil's advocate perspective, the reported patterns may therefore be attributed to the spatial distribution of the plots, reducing the impact of the ecologically relevant parameters. However, as spatial autocorrelation, i.e., the phenomenon that adjacent locations are more similar in biotic and abiotic parameters (Kühn and Dormann, 2012), usually affects only the few closest locations (Dormann, 2007), the trends observed across the n= 135 plots within the glacier forefield may be mostly attributed to successional changes in the biotic and abiotic environment and not merely to the spatial distribution. Nonetheless, the high spatial resolution of the plots may allow the discrimination between spatial, random, and ecological effects on community establishment in future analyses and experiments. The five plots outside of the glacier forefield represent potential outcomes of the community establishment, but given the close proximity of the five plots, spatial effects may be more pronounced. This spatial clustering should be kept in mind in future analysis, and the plots should potentially be supplemented by further sampling events in climax communities.
The glacier forefield of the Ödenwinkelkees features a largely linear increase in plot age and therefore also community age, with little covariation with elevation (119.6 m differences in elevation between the lowest and the highest plot) or other abiotic factors. Therefore, together with the excellent infrastructure that allows comparably effortless access to the glacier forefield, these characteristics make the glacier forefield of the Ödenwinkelkees an ideal study system to investigate the successional increase in multidiversity and ecosystem complexity. In the field campaign in summer 2019, where we performed a first inventory of plant, arthropod, bacteria, and fungi diversity and composition as well as a first geomorphological assessment of n= 140 plots, we built the foundation for future observational and experimental investigations using the Ödenwinkel platform. Furthermore, the exact documentation of the location of the plots and even the within-plot position of sampling events (traps, thermologgers, and soil samples) will allow a precise replication of the inventory in coming years to track the successional progress over years.
We are hoping that the research platform Ödenwinkel, with all the pre-existing knowledge on the plot level, will also be useful for colleagues in diverse disciplines who can use this platform to build upon existing data and contribute to the accumulation of data on multidiversity and ecosystem complexity along the successional gradient. The assessment of additional taxonomic groups such as viruses, protists, and lichens as well as a more detailed documentation of the geomorphology that shaped the plots and the whole glacier forefield to study biogeomorphic feedbacks at high temporal and spatial resolution is conceivable. Additionally, investigations on the population dynamics, phenotypic plasticity, or local adaptation of the intensively investigated plant species are conceivable to disentangle the biotic and abiotic contributions to these processes. Additionally, this research platform provides ideal conditions for long-term monitoring of biotic and abiotic processes and the responses of plant, animal, and microbe communities to climate warming and time since deglaciation. Thus, we invite colleagues to make use of the research platform Ödenwinkel for diverse research questions and offer assistance in the design of future studies.
The data used in this study are provided in the Supplement.
The supplement related to this article is available online at: https://doi.org/10.5194/we-20-95-2020-supplement.
RRJ conceived the platform; RRJ, MH, XH, VRH, JCO, SK, KB, FG, LMO, and WT designed the platform; MH, XH, VRH, and JCO performed field work; RRJ, MH, XH, VRH, JCO, and SK drafted the first version of the manuscript; all authors contributed to the final version.
The authors declare that they have no conflict of interest.
We thank the Hohe Tauern National Park Salzburg administration and the Rudolfshütte for organizational and logistic support, the governing authority Land Salzburg for the permit to conduct our research (permit no. 20507-96/45/7-2019), and Anna Vojtkó for help in the field. We also thank all participants of the symposium on interdisciplinary views on ecological complexity and biodiversity at Salzburg University in March 2019.
This research has been supported by the Austrian Science Fund (FWF), which provided funding to Robert R. Junker (grant no. Y1102).
This paper was edited by Sonja Knapp and reviewed by Mark Frenzel and one anonymous referee.
Albrecht, M., Riesen, M., and Schmid, B.: Plant-pollinator network assembly along the chronosequence of a glacier foreland, Oikos, 119, 1610–1624, https://doi.org/10.1111/j.1600-0706.2010.18376.x, 2010.
Allan, E., Bossdorf, O., Dormann, C. F., Prati, D., Gossner, M. M., Tscharntke, T., Blüthgen, N., Bellach, M., Birkhofer, K., Boch, S., Bohm, S., Borschig, C., Chatzinotas, A., Christ, S., Daniel, R., Diekotter, T., Fischer, C., Friedl, T., Glaser, K., Hallmann, C., Hodac, L., Holzel, N., Jung, K., Klein, A. M., Klaus, V. H., Kleinebecker, T., Krauss, J., Lange, M., Morris, E. K., Muller, J., Nacke, H., Pasalic, E., Rillig, M. C., Rothenwohrer, C., Schally, P., Scherber, C., Schulze, W., Socher, S. A., Steckel, J., Steffan-Dewenter, I., Turke, M., Weiner, C. N., Werner, M., Westphal, C., Wolters, V., Wubet, T., Gockel, S., Gorke, M., Hemp, A., Renner, S. C., Schoning, I., Pfeiffer, S., Konig-Ries, B., Buscot, F., Linsenmair, K. E., Schulze, E. D., Weisser, W. W., and Fischer, M.: Interannual variation in land-use intensity enhances grassland multidiversity, P. Natl. Acad. Sci. USA, 111, 308–313, https://doi.org/10.1073/pnas.1312213111, 2014.
Baker, S. C. and Barmuta, L. A.: Evaluating spatial autocorrelation and depletion in pitfall-trap studies of environmental gradients, J. Insect. Conserv., 10, 269–276, https://doi.org/10.1007/s10841-006-0016-8, 2006.
Benítez, E., Paredes, D., Rodríguez, E., Aldana, D., González, M., Nogales, R., Campos, M., and Moreno, B.: Bottom-up effects on herbivore-induced plant defences: a case study based on compositional patterns of rhizosphere microbial communities, Sci. Rep., 7, 6251, https://doi.org/10.1038/s41598-017-06714-x, 2017.
Bivand, R. S. and Wong, D. W. S.: Comparing implementations of global and local indicators of spatial association, Test.-Spain, 27, 716–748, https://doi.org/10.1007/s11749-018-0599-x, 2018.
Blüthgen, N., Menzel, F., and Blüthgen, N.: Measuring specialization in species interaction networks, BMC Ecol., 6, 9, https://doi.org/10.1186/1472-6785-6-9, 2006.
Borin, S., Ventura, S., Tambone, F., Mapelli, F., Schubotz, F., Brusetti, L., Scaglia, B., D'Acqui, L. P., Solheim, B., Turicchia, S., Marasco, R., Hinrichs, K. U., Baldi, F., Adani, F., and Daffonchio, D.: Rock weathering creates oases of life in a high Arctic desert, Environ. Microbiol., 12, 293–303, https://doi.org/10.1111/j.1462-2920.2009.02059.x, 2010.
Breiman, L.: Random forests, Mach. Learn., 45, 5–32, 2001.
Brown, S. P. and Jumpponen, A.: Contrasting primary successional trajectories of fungi and bacteria in retreating glacier soils, Mol. Ecol., 23, 481–497, https://doi.org/10.1111/mec.12487, 2014.
Connell, J. H.: Diversity in tropical rain forests and coral reefs, Science, 199, 1302–1310, https://doi.org/10.1126/science.199.4335.1302, 1978.
D'Amico, M. E., Freppaz, M., Filippa, G., and Zanini, E.: Vegetation influence on soil formation rate in a proglacial chronosequence (Lys Glacier, NW Italian Alps), Catena, 113, 122–137, 2014.
Diamond, J. M.: Laboratory, field and natural experiments, Nature, 304, 586–587, https://doi.org/10.1038/304586a0, 1983.
Doblas-Miranda, E., Wardle, D. A., Peltzer, D. A., and Yeates, G. W.: Changes in the community structure and diversity of soil invertebrates across the Franz Josef Glacier chronosequence, Soil Biol. Biochem., 40, 1069–1081, https://doi.org/10.1016/j.soilbio.2007.11.026, 2008.
Dormann, C. F.: Effects of incorporating spatial autocorrelation into the analysis of species distribution data, Global Ecol. Biogeogr., 16, 129–138, https://doi.org/10.1111/j.1466-8238.2006.00279.x, 2007.
Eichel, J., Krautblatter, M., Schmidtlein, S., and Dikau, R.: Biogeomorphic interactions in the Turtmann glacier forefield, Switzerland, Geomorphology, 201, 98–110, https://doi.org/10.1016/j.geomorph.2013.06.012, 2013.
Eichel, J.: Vegetation succession and biogeomorphic interactions in glacier forelands, in: Geomorphology of proglacial systems, Springer, 327–349, 2019.
Fierer, N., Nemergut, D., Knight, R., and Craine, J. M.: Changes through time: integrating microorganisms into the study of succession, Res. Microbiol., 161, 635–642, https://doi.org/10.1016/J.resmic.2010.06.002, 2010.
Fischer, M., Bossdorf, O., Gockel, S., Hansel, F., Hemp, A., Hessenmoller, D., Korte, G., Nieschulze, J., Pfeiffer, S., Prati, D., Renner, S., Schoning, I., Schumacher, U., Wells, K., Buscot, F., Kalko, E. K. V., Linsenmair, K. E., Schulze, E. D., and Weisser, W. W.: Implementing large-scale and long-term functional biodiversity research: The Biodiversity Exploratories, Basic Appl. Ecol., 11, 473–485, https://doi.org/10.1016/j.baae.2010.07.009, 2010.
Gascon, C., Brooks, T. M., Contreras-MacBeath, T., Heard, N., Konstant, W., Lamoreux, J., Launay, F., Maunder, M., Mittermeier, R. A., Molur, S., Al Mubarak, R. K., Parr, M. J., Rhodin, A. G. J., Rylands, A. B., Soorae, P., Sanderson, J. G., and Vie, J. C.: The importance and benefits of species, Curr. Biol., 25, R431–R438, https://doi.org/10.1016/j.cub.2015.03.041, 2015.
Gaston, K. J. and Spicer, J. I.: Biodiversity, Blckwell Science Ltd., Malden, 2004.
Hawkins, B. A.: Eight (and a half) deadly sins of spatial analysis, J. Biogeogr., 39, 1–9, https://doi.org/10.1111/j.1365-2699.2011.02637.x, 2012.
Humphrey, P. T., Nguyen, T. T., Villalobos, M. M., and Whiteman, N. K.: Diversity and abundance of phyllosphere bacteria are linked to insect herbivory, Mol. Ecol., 23, 1497–1515, https://doi.org/10.1111/mec.12657, 2014.
Junker, R. R., Lechleitner, M. H., Kuppler, J., and Ohler, L.-M.: Interconnectedness of the Grinnellian and Eltonian niche in regional and local plant-pollinator communities, Front Plant. Sci., 10, 1371, https://doi.org/10.3389/fpls.2019.01371, 2019.
Karamanoli, K., Kokalas, V., Koveos, D. S., Junker, R. R., and Farré-Armengol, G.: Bacteria affect plant-mite interactions via altered scent emissions, J. Chem. Ecol., 46, 1–11, 2020.
Klironomos, J. N.: Feedback with soil biota contributes to plant rarity and invasiveness in communities, Nature, 417, 67–70, https://doi.org/10.1038/417067a, 2002.
Kühn, I. and Dormann, C. F.: Less than eight (and a half) misconceptions of spatial analysis, J. Biogeogr., 39, 995–998, https://doi.org/10.1111/j.1365-2699.2012.02707.x, 2012.
Manning, P., Gossner, M. M., Bossdorf, O., Allan, E., Zhang, Y. Y., Prati, D., Bluthgen, N., Boch, S., Bohm, S., Borschig, C., Holzel, N., Jung, K., Klaus, V. H., Klein, A. M., Kleinebecker, T., Krauss, J., Lange, M., Muller, J., Pasalic, E., Socher, S. A., Tschapka, M., Turke, M., Weiner, C., Werner, M., Gockel, S., Hemp, A., Renner, S. C., Wells, K., Buscot, F., Kalko, E. K. V., Linsenmair, K. E., Weisser, W. W., and Fischer, M.: Grassland management intensification weakens the associations among the diversities of multiple plant and animal taxa, Ecology, 96, 1492–1501, https://doi.org/10.1890/14-1307.1, 2015.
Matthews, J. A.: The ecology of recently-deglaciated terrain: a geoecological approach to glacier forelands, Cambridge University Press, 1992.
Meiners, S. J., Cadotte, M. W., Fridley, J. D., Pickett, S. T. A., and Walker, L. R.: Is successional research nearing its climax? New approaches for understanding dynamic communities, Funct. Ecol., 29, 154–164, https://doi.org/10.1111/1365-2435.12391, 2015.
Mikkelson, K. M., Lozupone, C. A., and Sharp, J. O.: Altered edaphic parameters couple to shifts in terrestrial bacterial community structure associated with insect-induced tree mortality, Soil Biol. Biochem., 95, 19–29, https://doi.org/10.1016/j.soilbio.2015.12.001, 2016.
Milchunas, D. G. and Vandever, M. W.: Grazing effects on plant community succession of early- and mid-seral seeded grassland compared to shortgrass steppe, J. Veg. Sci., 25, 22–35, https://doi.org/10.1111/jvs.12049, 2014.
Miller, H. R. and Lane, S. N.: Biogeomorphic feedbacks and the ecosystem engineering of recently deglaciated terrain, Prog. Phys. Geog., 43, 24–45, https://doi.org/10.1177/0309133318816536, 2019.
Moran, P. A. P.: The Interpretation of Statistical Maps, J. R. Stat. Soc. B., 10, 243–251, 1948.
Mueller-Dombois, D.: Biological diversity and disturbance regimes in island ecosystems, in: Islands – Biological Diversity and Ecosystem Function, edited by: Vitousek, P., Loope, L. L., and Adsersen, H., Springer, Berlin, Heidelberg, 1995.
Ohler, L.-M., Lechleitner, M. H., and Junker, R. R.: Microclimatic effects on alpine plant communities and flower-visitor interactions, Sci. Rep., 10, 1366, https://doi.org/10.1038/s41598-020-58388-7, 2020.
Peters, B., Türke, M., and Junker, R.: Epiphytic bacteria on lettuce affect the feeding behavior of an invasive pest slug, Acta Agrobotanica, 70, 1708, https://doi.org/10.5586/aa.1708, 2017.
Pickett, S. T.: Space-for-time substitution as an alternative to long-term studies, in: Long-term studies in ecology, Springer, 110–135, 1989.
Raffl, C., Mallaun, M., Mayer, R., and Erschbamer, B.: Vegetation succession pattern and diversity changes in a glacier valley, Central Alps, Austria, Arct. Antarct. Alp. Res., 38, 421–428, 2006.
Samuni-Blank, M., Izhaki, I., Laviad, S., Bar-Massada, A., Gerchman, Y., and Halpern, M.: The role of abiotic environmental conditions and herbivory in shaping bacterial community composition in floral nectar, Plos One, 9, e99107, https://doi.org/10.1371/journal.pone.0099107, 2014.
Schmidt, S. K., Reed, S. C., Nemergut, D. R., Grandy, A. S., Cleveland, C. C., Weintraub, M. N., Hill, A. W., Costello, E. K., Meyer, A. F., Neff, J. C., and Martin, A. M.: The earliest stages of ecosystem succession in high-elevation (5000 metres above sea level), recently deglaciated soils, Proc. Biol. Sci., 275, 2793–2802, https://doi.org/10.1098/rspb.2008.0808, 2008.
Schneider, C. A., Rasband, W. S., and Eliceiri, K. W.: NIH Image to ImageJ: 25 years of image analysis, Nat. Methods, 9, 671–675, https://doi.org/10.1038/nmeth.2089, 2012.
Soliveres, S., van der Plas, F., Manning, P., Prati, D., Gossner, M. M., Renner, S. C., Alt, F., Arndt, H., Baumgartner, V., Binkenstein, J., Birkhofer, K., Blaser, S., Blüthgen, N., Boch, S., Böhm, S., Börschig, C., Buscot, F., Diekötter, T., Heinze, J., Hölzel, N., Jung, K., Klaus, V. H., Kleinebecker, T., Klemmer, S., Krauss, J., Lange, M., Morris, E. K., Müller, J., and Oelmann, Y.: Biodiversity at multiple trophic levels is needed for ecosystem multifunctionality, Nature, 536, 456–459, 2016.
Tscherko, D., Rustemeier, J., Richter, A., Wanek, W., and Kandeler, E.: Functional diversity of the soil microflora in primary succession across two glacier forelands in the Central Alps, Eur. J. Soil Sci., 54, 685–696, https://doi.org/10.1046/j.1351-0754.2003.0570.x, 2003.
Tscherko, D., Hammesfahr, U., Zeltner, G., Kandeler, E., and Bocker, R.: Plant succession and rhizosphere microbial communities in a recently deglaciated alpine terrain, Basic Appl. Ecol., 6, 367–383, https://doi.org/10.1016/j.baae.2005.02.004, 2005.