the Creative Commons Attribution 4.0 License.
the Creative Commons Attribution 4.0 License.
 | 05 Jul 2022
Ecological niche and potential geographic distributions of Dermacentor marginatus and Dermacentor reticulatus (Acari: Ixodidae) under current and future climate conditions
Abdelghafar Alkishe
Marlon E. Cobos
Luis Osorio-Olvera
A. Townsend Peterson
Dermacentor marginatus is a vector disease of both humans and animals and transmits the causative agents of Q fever (Coxiella burnetii) and the spotted fever group (Rickettsia raoultii and R. slovaca), as well as of Crimean–Congo hemorrhagic fever. Dermacentor reticulatus can transmit various pathogens such as Francisella tularensis, Babesia spp., tick encephalitis virus, Coxiella burnetii, Omsk hemorrhagic fever virus, and Rickettsia spp. and can cause serious skin lesions. Herein, ecological niche modeling (ENM) is used to characterize the niches of these two ticks and describe their potential distributional patterns under both current and future climate conditions, as a means of highlighting geographic distributional shifts that may be of public health importance. We assessed distributional implications of five general circulation models (GCMs), under two shared socio-economic pathways (SSP245 and SSP585) for the period 2041–2060. Predictions for D. marginatus showed broad suitable areas across western, central, and southern Europe, with potential for expansion in northern and eastern Europe. Dermacentor reticulatus has suitable areas across western, central, and northern Europe. Under future scenarios, new expansions were observed in parts of northern and eastern Europe and highland areas in central Europe. Despite broad overlap between the niches of the ticks, D. marginatus has a broader niche, which allows it to show greater stability in the face of the changing climate conditions. Areas of potential geographic distributional expansion for these species should be monitored for actual distributional shifts, which may have implications for public health in those regions.
- Article
(8557 KB) - Full-text XML
-
Supplement
(1174 KB) - BibTeX
- EndNote


Ticks are the second most dangerous disease vectors (after mosquitoes) for humans, but for animals, they are the first (Ahmed et al., 2007). They can cause various health problems for humans and considerable economic losses by transmitting different pathogens to livestock, including bacteria (Rickettsia spp.) (Parola and Raoult, 2001), viruses (tick-borne encephalitis virus) (Dumpis et al., 1999), and protozoa (Babesia divergens, B. microti, and Theileria parva) (Homer et al., 2000). More than a billion cattle (80% of the global population) are at risk of tick-borne diseases, and the global annual loss estimate is around USD 7 billion (Estrada-Peña and Salman, 2013).
The ixodid ticks Dermacentor marginatus (ornate sheep tick) and D. reticulatus (ornate cow tick) are two Eurasian tick species of veterinary and public health importance (Rubel et al., 2016). The two species have different geographic ranges except for some areas of overlap in central Europe (Buczek et al., 2015). The two species have similar life cycles that last 1–2 years; D. marginatus adults are active during spring and fall and can be active during winter in southern areas; D. reticulatus adults are active from late August through May, and only winter weather interrupts their questing activities (Dautel et al., 2006; Földvári et al., 2016).
Dermacentor marginatus is a vector of the causative agents of Q fever (Coxiella burnetii), spotted fevers (Rickettsia raoultii and R. slovaca) (Walter et al., 2016), and Crimean–Congo hemorrhagic fever (virus family Bunyaviridae) (Nuttall et al., 1994). Dermacentor marginatus uses a considerable variety of domestic animals (sheep, goats, horses, cattle, dogs) and wild animals (deer, wolf, hare, hedgehog, wild boar) as their main hosts (Masala et al., 2012). This tick species can be found in lowland, forest, alpine steppe, and semi-desert areas; its geographic distribution extends from Europe (Spain, Italy, Switzerland, France, Germany, Poland) to north Africa (Morocco, Tunisia) and western Asia (Iran, Kazakhstan) and includes much of central Asia (Walter et al., 2016; Rubel et al., 2015).
Dermacentor reticulatus transmits the causative agents of various diseases such as tularemia (Francisella tularensis), babesiosis (Babesia canis, B. caballi), tick-borne encephalitis virus, Q fever (Coxiella burnetii), Omsk hemorrhagic fever virus, and Rickettsia spp., and the bite of this species can cause extensive skin lesions in animals (Abdullah et al., 2016; Buczek et al., 2002; De Marco et al., 2017; Földvári et al., 2016; Jongejan et al., 2015; Wójcik-Fatla et al., 2011). This tick species uses more humid habitats in urban and suburban areas such as fallow land and parks (Rubel et al., 2016). Dermacentor reticulatus infests a broad range of mammal hosts (dog, cattle, deer) and bite humans only incidentally (Pfäffle et al., 2015). This tick species is well documented in central Europe and is distributed mostly in temperate and cooler regions (Rubel et al., 2016). Physiological experiments indicate that adults are cold-tolerant and can survive at temperatures of −10 ∘C for up to 150 d (Medlock et al., 2017).
Europe and the Mediterranean region are expecting to face considerable change in rainfall and temperature; the latter is forecasted to increase by 1.5–2.5 ∘C in coming decades (Gray et al., 2009; Eea, 2019). Those abiotic factors (temperature and precipitation) are crucial for ticks' survival on the ground (knowing that 99 % of tick life is off-host) (Sonenshine and Roe, 2013). Given the global warming impact on shaping the geographic distribution of D. marginatus and D. reticulatus, our aim here is to characterize their ecological niches and potential geographic distributions under climate change scenarios – understanding likely distributional changes in these species will be useful in guiding public health interventions as tick-borne disease risks evolve. We used ecological niche modeling tools to understand the species' niches in current environmental space and project them onto geography under two shared socio-economic pathways (SSP245 and SSP585), using five general circulation models (GCMs) in the period 2041–2060. This analysis has allowed us to explore these species' niches in environmental dimensions, to delineate their current potential geographic distributions, and to predict possible range expansions and reductions in the future.
2.1 Data preparation
We obtained occurrence data from various sources for D. marginatus and D. reticulatus: Global Biodiversity Information Facility (GBIF; http://www.gbif.org, last access: 15 January 2022; 190 and 514 (old data) and 2778 (new updated data)), VectorMap (http://vectormap.si.edu/, last access: 30 November 2020; 342 and 45), and the scientific literature (571 and 520) (sources summarized in Fig. S1 in the Supplement). We filtered the data to avoid duplicates, errors, localities with missing coordinates, and other georeferencing errors (Cobos et al., 2018). Based on the number of data points and environmental heterogeneity in the area and to avoid problems with spatial autocorrelation, we rarefied the data spatially based on a 50 km distance filter, considering the spatial resolution of the climate data (see below) of 10′ or ∼17 km using the spThin R package (Aiello-Lammens et al., 2015) – this spatial resolution was chosen in light of the rather imprecise spatial resolution of the input occurrence data available to us. After these data cleaning steps, we had 236 occurrence points for D. marginatus and 198 for D. reticulatus. We split the cleaned occurrence data randomly into two sets of equal size for model calibration and evaluation steps involved in model calibration and used the entire set for producing final models.
To avoid negative impacts of inappropriate background choices for model outcomes (Anderson and Raza, 2010), we used explicit hypothesis of accessible areas for calibrating models (M; Barve et al., 2011). That is, we assumed a symmetric, long-term dispersal away from known populations and assumed that dispersal would likely be mediated by movements of host animals. In this regard, M areas were delimited based on 200 km buffer areas around the occurrence records for each species (Fig. 1).
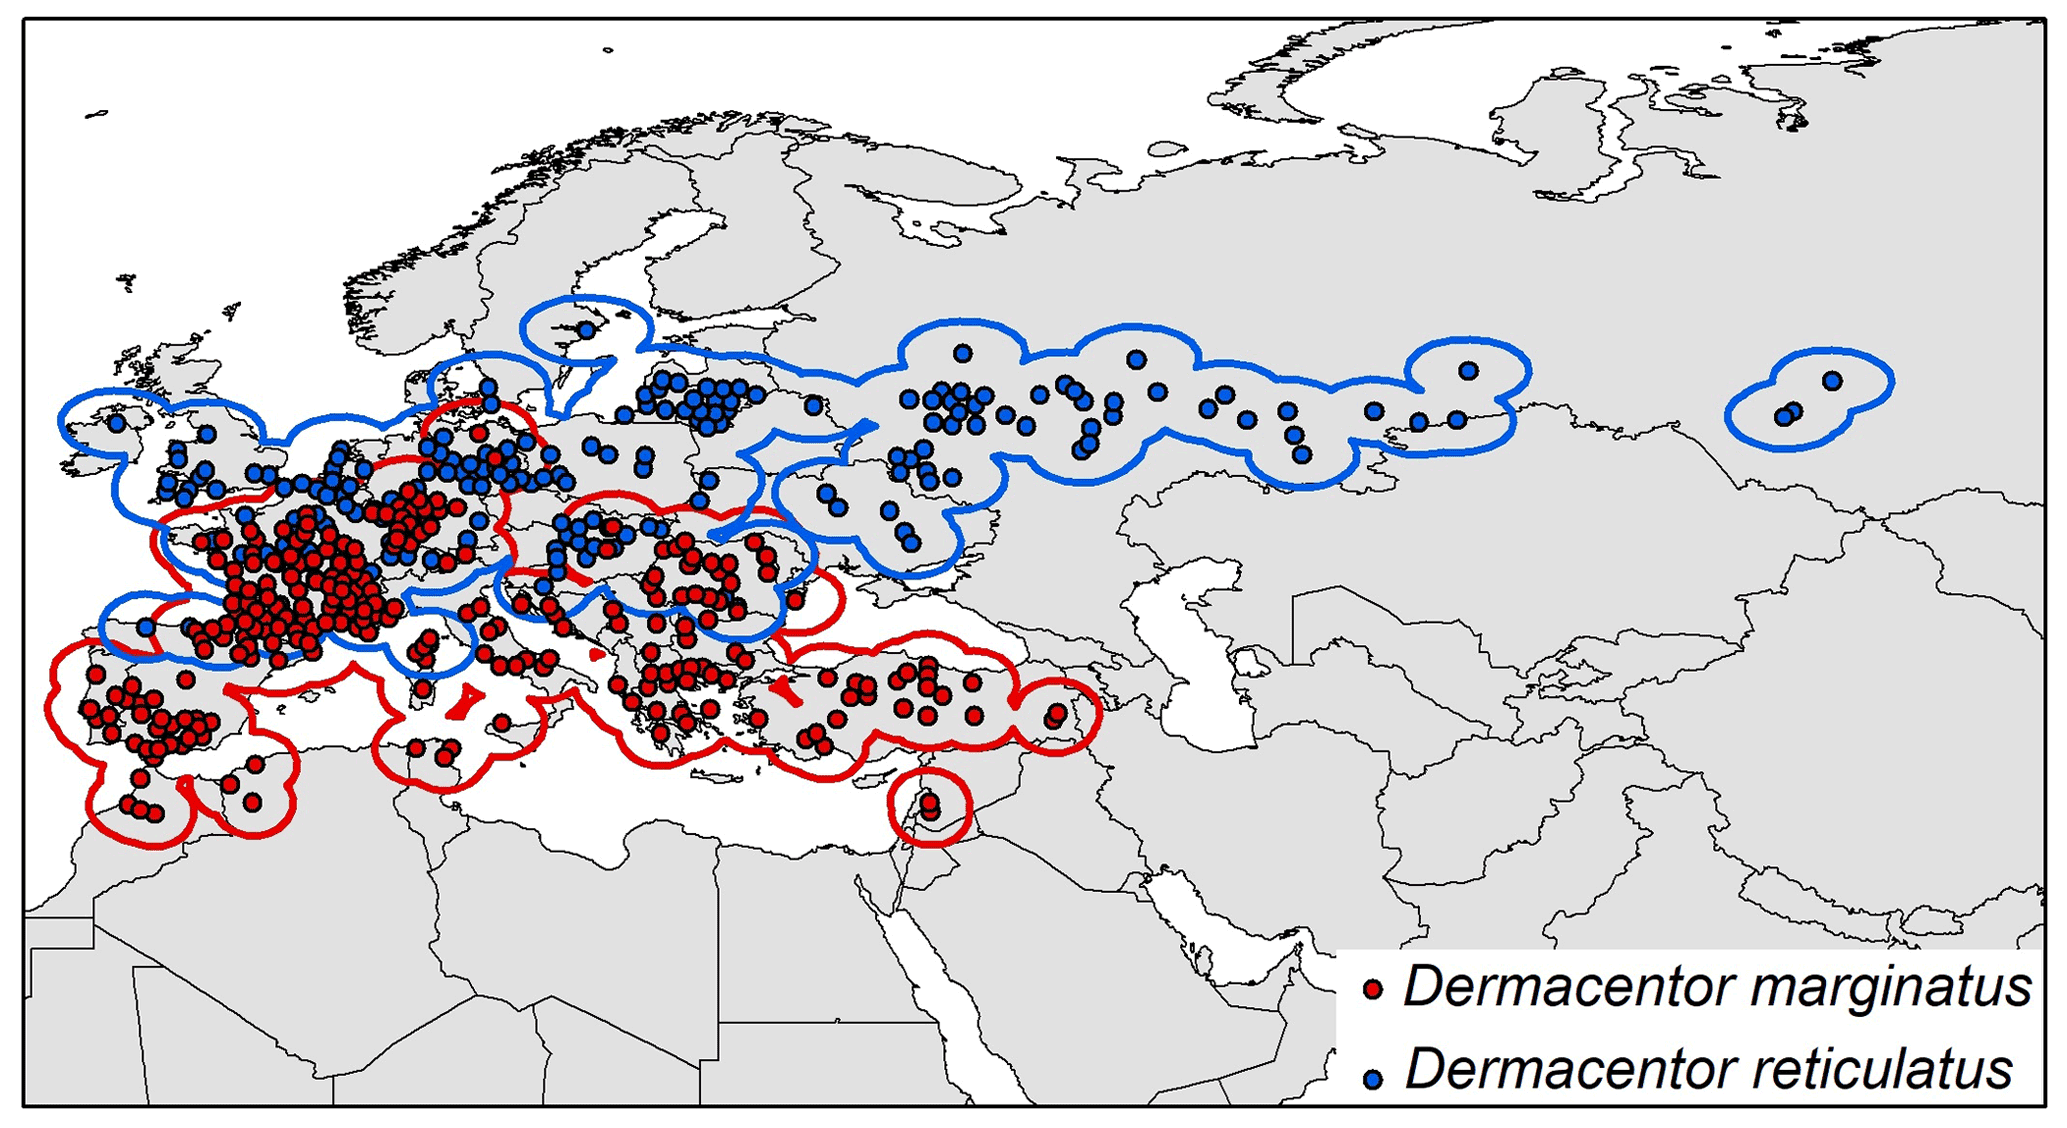
Figure 1Occurrence points and calibration areas for Dermacentor marginatus (red dots, red buffer), and D. reticulatus (blue dots, blue buffer).
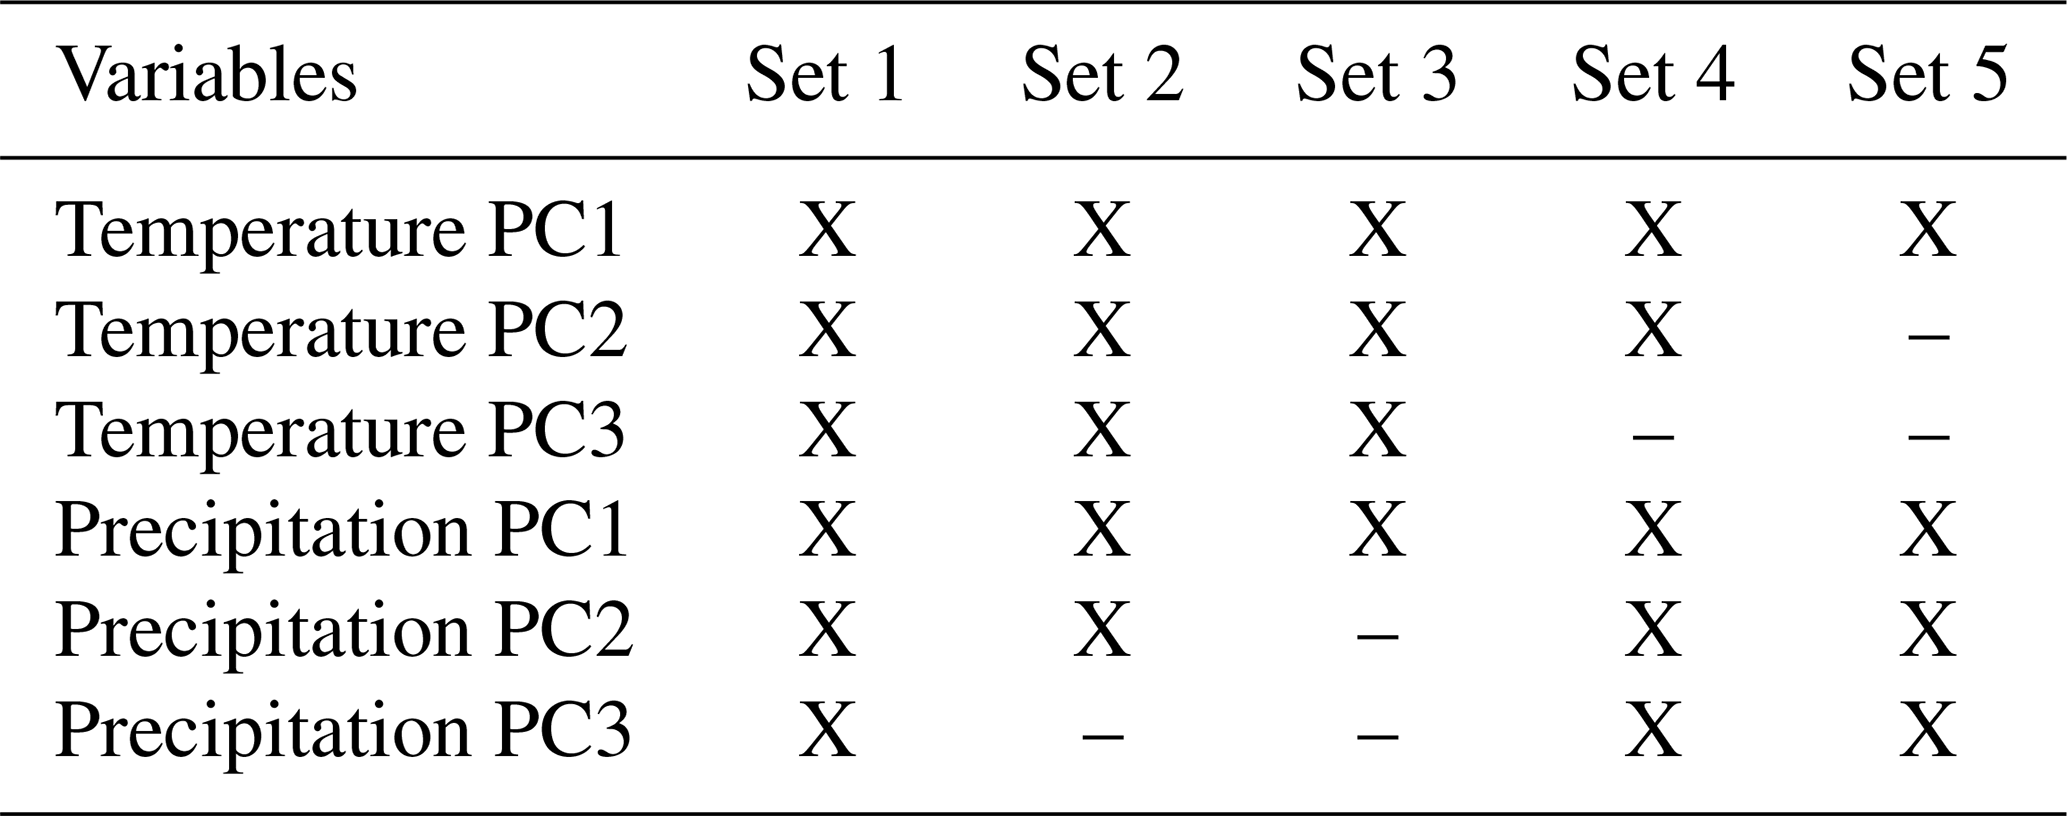
We used bioclimatic variables for current and future (2041–2060) scenarios from WorldClim version 2.1, at 10′ spatial resolution (Hijmans et al., 2005; available at http://www.worldclim.org, last access: 11 February 2022); variables 8, 9, 18, and 19 were removed because they are known to present abrupt discontinuities in areas not characterized by geographic breaks, which have been considered spatial artifacts (Escobar et al., 2014; Bede-Fazekas and Somodi, 2020). Variables were masked to fit the calibration areas (equivalent to the accessible area, M), and a principal component analysis (PCA) was used to reduce dimensionality and multicollinearity. PCAs were performed separately for temperature and precipitation variables to allow us to assess which factors contribute most to our models. We followed Cobos et al. (2019) in creating distinct sets of predictors (Table 1) and testing them in concert with other parameter settings to find the best models and sets of variables during model calibration (see below).
Table 1Variables included in the five sets of predictors tested during model calibration. X indicates using a principal component (PC) variable.
To represent future climatic conditions, we used bioclimatic variables from five general circulation models (GCMs) in the context of two shared socio-economic pathways (SSP245 and SSP585). For future climate data layers, the GCMs used were (1) the high-resolution version of the Beijing Climate Center Climate System Model (BCC-CSM2-HR), (2) a Centre National de Recherches Météorologiques model (CNRM-CM6-1), (3) the Model for Interdisciplinary Research on Climate (MIROC6), (4) an Institut Pierre-Simon Laplace model (IPSL-CM6A-LR), and (5) the Canadian Earth System Model version 5 (CanESM5). GCM choice was based on availability of data for both SSP scenarios and on frequency of use in other such research applications.
2.2 Ecological niche modeling and model transfers
The combination of five sets of environmental variables, 15 feature classes (all combinations of linear, L; quadratic, Q; product, P; hinge, H), and 15 regularization multiplier values (0.1 to 1 at intervals of 0.3 and 2 to 6 at intervals of 1) resulted in 1125 candidate models per species. We evaluated candidate models based first on statistical significance (partial ROC (receiver operating characteristic), pROC, p≤0.05; Peterson et al., 2008) and then based on predictive performance (omission rates < 5 %; Anderson et al., 2003). Finally, we applied a criterion of minimum complexity, the Akaike Information Criterion corrected for small sample sizes (AICc; Warren and Seifert, 2011); differences between particular AICc values and minimum values are referred to as ΔAICc, and candidate models with ΔAICc < 2 (Warren and Seifert, 2011) were selected to produce final models.
Final models were created using the complete set of occurrences and the parameterizations selected during model calibration. We performed 10 bootstrap replicates and transferred the models globally to current and future scenarios (representations of results were restricted to an area of direct influence that includes Europe, north Africa, and western Asia). We calculated medians of final predictions for each calibration area in which final models were produced to summarize model results. We binarized models using a threshold of the allowable omission error rate (E) of 5 %, assuming this value as a percentage of data that may have included errors that misrepresented environments used by the species. We calculated differences in suitable areas between current and the two future scenario SSPs (SSP245 and SSP585). To represent changes in suitable areas, we used the agreement of changes (stable, gain, and loss) among the five GCMs per SSP scenario. Specifically, for each SSP scenario, we compared all projections to future conditions based on distinct GCMs against the current projection and quantified the agreement of gain and loss of suitable areas, as well as the stability of suitable and unsuitable conditions (see Campbell et al., 2015). All modeling was done in R 4.2.1 (R Core Team, 2020) using Maxent 3.4.1 (Phillips et al., 2017) with the kuenm package (Cobos et al., 2019).
We assessed strict extrapolation risk using the mobility-oriented parity metric (MOP, considering the nearest 5 % of the reference point cloud of environmental space in the calibration areas compared to environmental conditions in projection areas; Owens et al., 2013). We estimated variance contributions from distinct sources (replicates, parameter settings, GCMs, and SSPs) in our model projections (Peterson et al., 2018). Variability is calculated as the variance in all layers that correspond to distinct groups considering the sources of variation mentioned above. MOP and model variability were represented geographically following Owens et al. (2013) and Cobos et al. (2019), respectively. Note that D. reticulatus does not present all sources of variation because only one set of parameters was selected for final models.
2.3 Ecological niche characterizations in environmental space
We characterized the ecological niches of the two species using three distinct approaches: (1) a niche similarity test (Schoener's D index) (Broennimann et al., 2012) and (2) a niche overlap test based on ellipsoids (e.g., Banks et al., 2021; Nuñez-Penichet et al., 2021), both to compare the two species' niches, and (3) a visualization of ellipsoidal niches and changes in suitability in a three-dimensional environmental space. Niche similarity tests were performed with 1000 replicates, using the test proposed by Broennimann et al. (2012) implemented in the ecospat R package (Di Cola et al., 2017). This test describes how similar the niches are considering the environmental values of occurrence records and areas that are relevant for the analyses for both species (i.e., our calibration areas). Environmental variables used for these analyses were the first PCA of temperature variables and the first PCA for precipitation variables.
We measured the overlap between ellipsoidal envelopes for the two species in two environmental spaces (precipitation and temperature) separately. We used the first three PCAs of temperature and precipitation in two distinct analyses to obtain the environmental information of the occurrence points for each species and fit three-dimensional minimum volume ellipsoids (Van Aelst and Rousseeuw, 2009; Osorio-Olvera et al., 2020). To measure overlap using these ellipsoids, we used two different approaches. First, we measured full overlap, which considered the whole set of environments that overlap between the two ellipsoids (note that some environments may not be observed in the M areas). To this end, a cloud of points uniformly distributed in the multi-dimensional environmental space that covers the two ellipsoids is used to detect how those envelopes overlap (Qiao et al., 2016). Additionally, we measured background overlap, which considers only the subset of the full overlap corresponding to environments manifested in the M areas of the two species of interest (Nuñez-Penichet et al., 2021). The overlap is measured using the Jaccard index (Mammola, 2019), where the value of overlap is the ratio between the number of points within the intersection of two ellipsoids (E1 ∩ E2) and the total number of points contained by two ellipsoids (E1 ⋃ E2): J = E1 ∩ E2E1 ⋃ E2. To measure full overlap between the ellipsoid envelopes, we used 106 uniformly distributed points. To perform analyses of overlap using the environmental combinations accessible to the species, we used the values of the PCs corresponding to the M of each species. To test statistical significance of our observed values of overlap, we compared the observed results to a null distribution of 1000 overlap values derived from comparing ellipsoid envelopes created from points randomly sampled from each species' M (N is the total number of occurrences for each species). The null hypothesis in this test is that the observed degree of niche overlap reflects M-area environmental similarity, versus an alternative hypothesis of niche differentiation, so it is key to consider the environments available to each species within its M. If the observed niche overlap value falls inside the upper 95 % of the null distribution, the null hypothesis cannot be rejected. As the full overlap analysis uses points that are uniformly distributed, significance tests (which rely on available conditions) were performed only for analyses of background overlap. Analyses of niche overlap were performed in R using the package ellipsenm (Cobos et al., 2020).
To understand the dynamics of changes in suitable areas in future scenarios, we used representations in three dimensions for precipitation and temperature variables. These plots were constructed to show the species' ecological niches as in ellipsoid envelope models and the environmental values in future conditions. Future conditions were classified as never suitable, always suitable (stable), gain, and loss to represent changes in the same way they were shown in geographic projections (Campbell et al., 2015). Plots for each GCM and SSP combination were produced instead of searching for an agreement of changes as in geographic projections because detecting such agreements is complicated in environmental space. Niche overlap analyses and three-dimensional representations of niches and future conditions of suitability were performed in R using the packages ellipsenm and rgl (Adler et al., 2019).
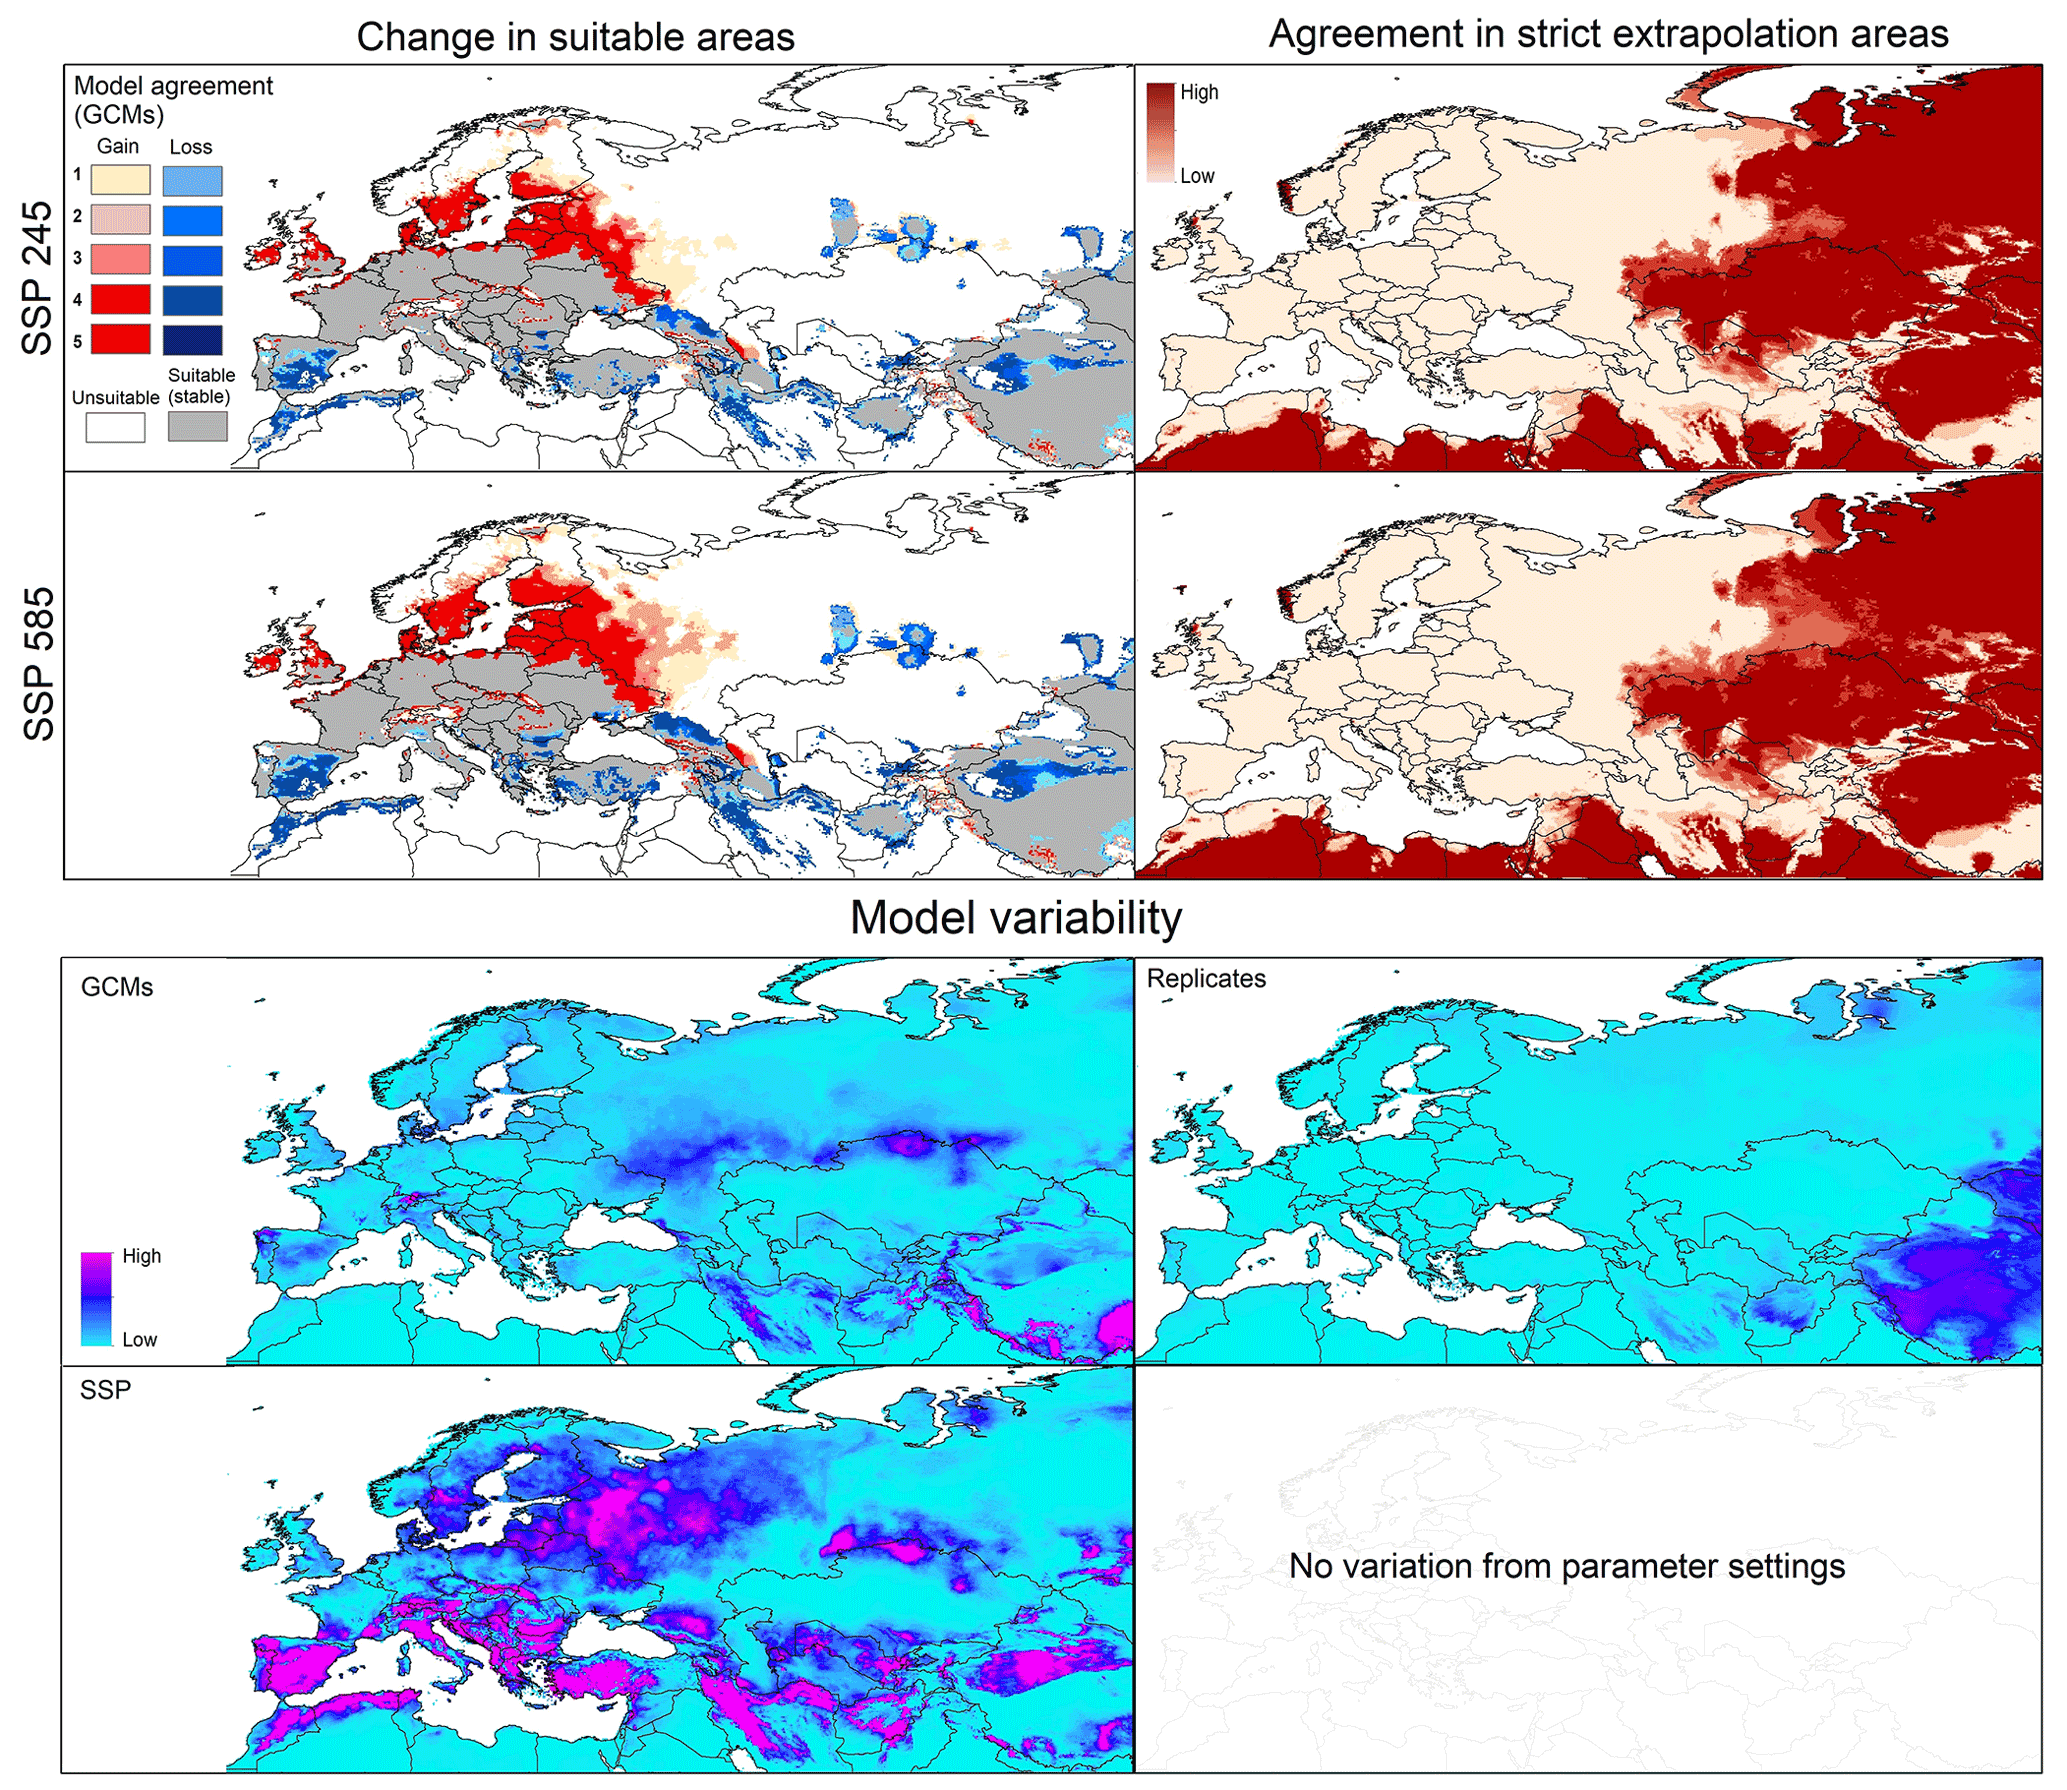
Figure 2Left panels: potential geographic distribution of Dermacentor marginatus based on current conditions (in blue and gray) and future conditions (blue denotes no longer suitable; red denotes newly suitable). Right panels: agreement in strict extrapolation areas among the five general circulation models. Model variability: median of variance coming from GCMs, replicates, and SSP in future projections.
3.1 Model calibration results
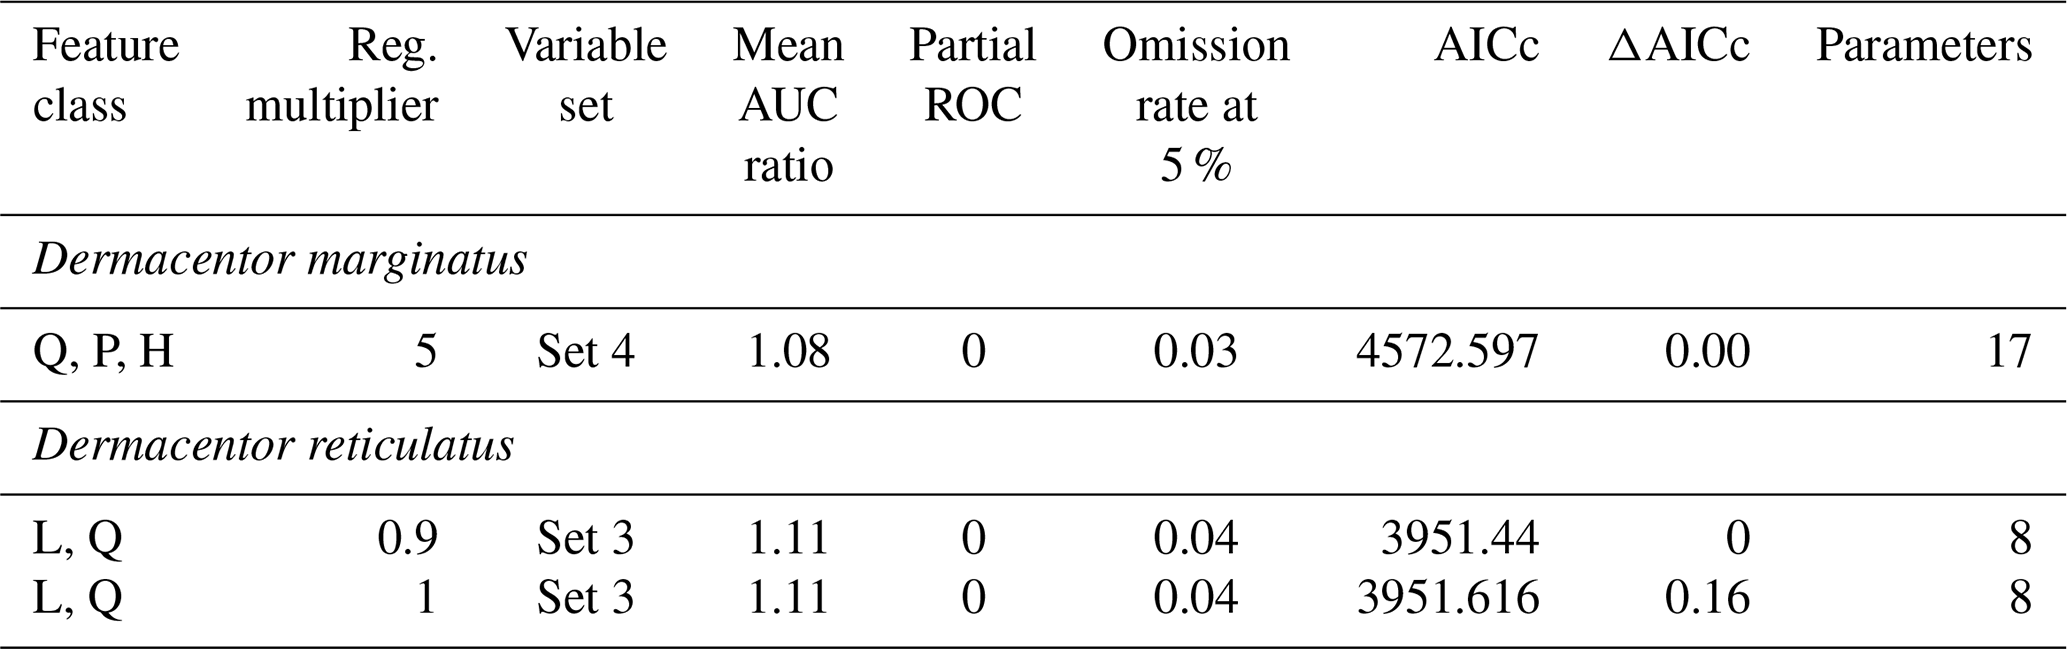
From 1125 candidate models for each species, D. marginatus and D. reticulatus, 996 and 1033 were significantly better than random expectations, respectively (pROC test, p≤0.05). Of these models, 17 and 81 met the omission rate (OR) criteria (i.e., OR ≤ 0.05), and only 1 and 2 models were selected as the best models for D. marginatus and D. reticulatus, respectively, based on AICc. For D. marginatus, models performed better with the variables in Set 4 (temperature PC1 and PC2 and precipitation PC1, PC2, and PC3), whereas for D. reticulatus variables in Set 3 (temperature PC1, PC2, and PC3 and precipitation PC1) were selected (Tables 1 and 2).
Table 2Parameter settings selected in the process of model calibration, to produce final models for Dermacentor marginatus and D. reticulatus. Reg. denotes regularization; AUC denotes area under the curve; ROC denotes receiver operating characteristic; AICc denotes Akaike information criterion corrected for small sample sizes.
3.2 Changes in potential geographic distribution
Current predictions for D. marginatus showed broad suitable areas across western, central, and southern Europe, including southern Great Britain, Germany, France, the Netherlands, Belgium, Italy, Greece, and Turkey. Some areas in northern Europe and north Africa were also predicted as suitable. However, these areas were small, including parts of southern Sweden, Morocco, Algeria, and Tunisia (Fig. 2).
The model transfer to future conditions showed stable suitable areas (i.e., suitable both now and in the future) across central Europe and in restricted areas of north Africa. Range reduction (loss) was observed in southern parts of the current suitable areas; gains were detected especially in northern Europe (Sweden, Denmark, Finland), eastern Europe (Russia), and northwestern Europe (Fig. 2). In general, more losses and fewer gains were detected in the SSP585 scenario compared to SSP245. MOP results showed high agreement in strict extrapolative areas among future scenarios, with most such areas concentrated in Asia (Fig. 2). Model variability results showed no variation coming from parameters, and low variation came from replicates and GCMs SSPs (Fig. 2), but there was high contribution to variation from SSP in different parts of Europe, Turkey, and northern Africa (Fig. 2).
Current predictions for D. reticulatus showed different suitable areas compared to those for D. marginatus: large parts of southern Europe were considered not suitable for this species. Suitable areas extended across western, central, eastern, and parts of southern Europe, including Great Britain, Germany, France, the Netherlands, Belgium, Italy, northern Spain, Turkey, and eastern Europe including Russia. Models also identified some areas of northern Europe, in southern Sweden, Finland, and Norway (Fig. 3).
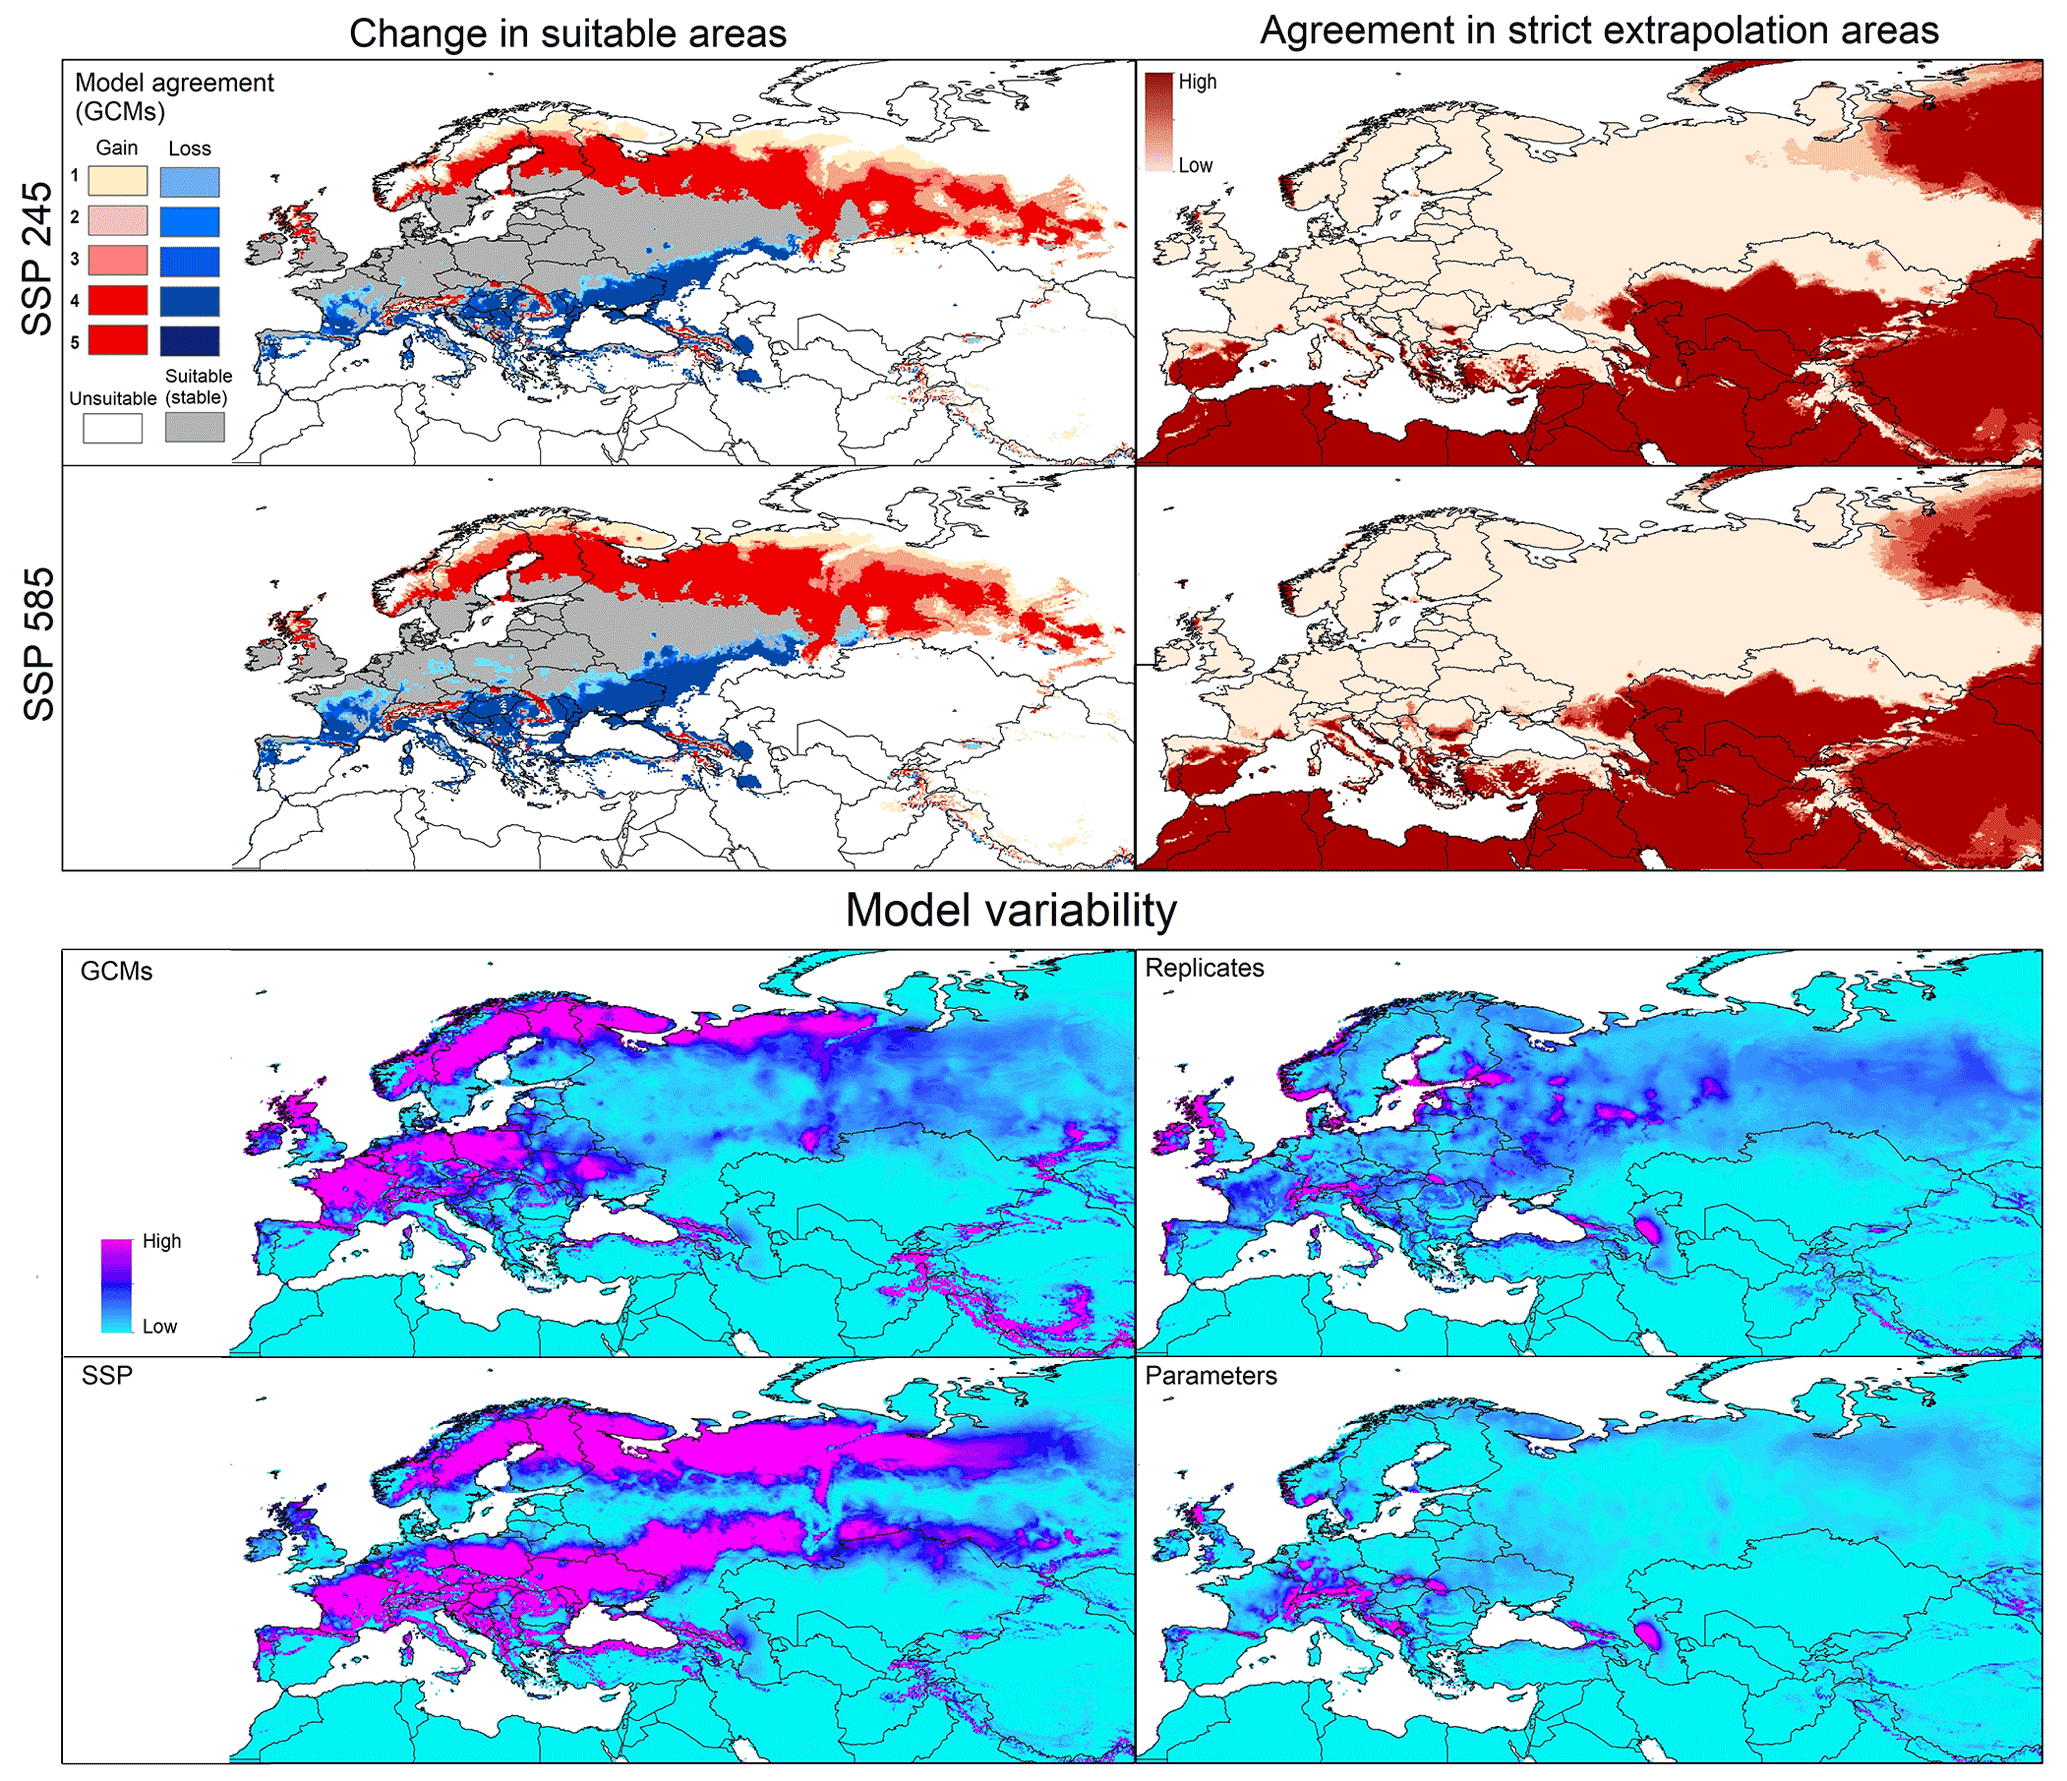
Figure 3Left panels: potential geographic distribution of Dermacentor reticulatus based on current (in blue and gray) and future (blue denotes no longer suitable; red denotes newly suitable) conditions. Right panels: agreement in strict extrapolation areas among the five general circulation models. Model variability: median of variance coming from GCMs, replicates, SSP, and parameters in future projections.
Under future conditions, predictions for the two SSP scenarios showed similar patterns of range stability, expansion, and contraction (Fig. 3). Stable suitable areas were distributed across western, central, and eastern Europe. Range reduction was anticipated across large areas of southern Russia, Ukraine, Moldova, Romania, Slovakia, Italy, France, Spain, and Portugal. Gains of suitable area were in northern Europe, mainly in Sweden, Denmark, Finland, Russia, and Great Britain, and in highland areas across central Europe (Fig. 3). Strict extrapolative areas were found in both southern and northern Europe, as well as in parts of Asia and north Africa, in both scenarios (Fig. 3). Model variability came mainly from GCMs and SSPs and was concentrated in central and northern Europe; variation deriving from GCMs and SSPs was low (Fig. 3).
Global projections showed higher potential of D. marginatus to invade new areas outside its native range, compared to D. reticulatus. Suitable areas for D. marginatus were mainly in North America, South America, sub-Saharan countries, and Asia; only a few were in South America and Australia (Fig. S1). For D. reticulatus, in contrast, few suitable areas were detected in North America and China (Fig. S2). However, areas such as sub-Saharan countries, South America, and northern Asia were detected as strict extrapolation areas by MOP analysis for the species D. marginatus, whereas strict extrapolation areas were detected in areas that are not predicted as suitable for D. reticulatus (Figs. S1 and S2).
3.3 Characteristics of ecological niches
The niche similarity test showed a value of Schoener's D of 0.268 and a p value of 0.389, so we could not reject the null hypothesis of niche similarity (Fig. S7). The volume of the ellipsoidal ecological niche for D. marginatus was larger than that for D. reticulatus (41.5 against 7.4 units using precipitation PCs, 101.3 versus 33.0 units using temperature PCs). Considering precipitation, the full overlap between two ellipsoidal niches was 0.22 and the overlap using available environments was 0.76 (Fig. 4). As regards temperature variables, full overlap resulted in 0.21 and the overlap using available conditions resulted in 0.39 (Fig. 4). The null hypothesis of niche overlap (using the background) was rejected for both precipitation and temperature dimensions (Fig. 4). The change in conditions seen in environmental space showed that temperature had a larger impact in terms of changes in suitability compared to precipitation, for both species (Figs. 5 and S3–S6). Changes in suitability in environmental space also showed a unidirectional pattern of changes.
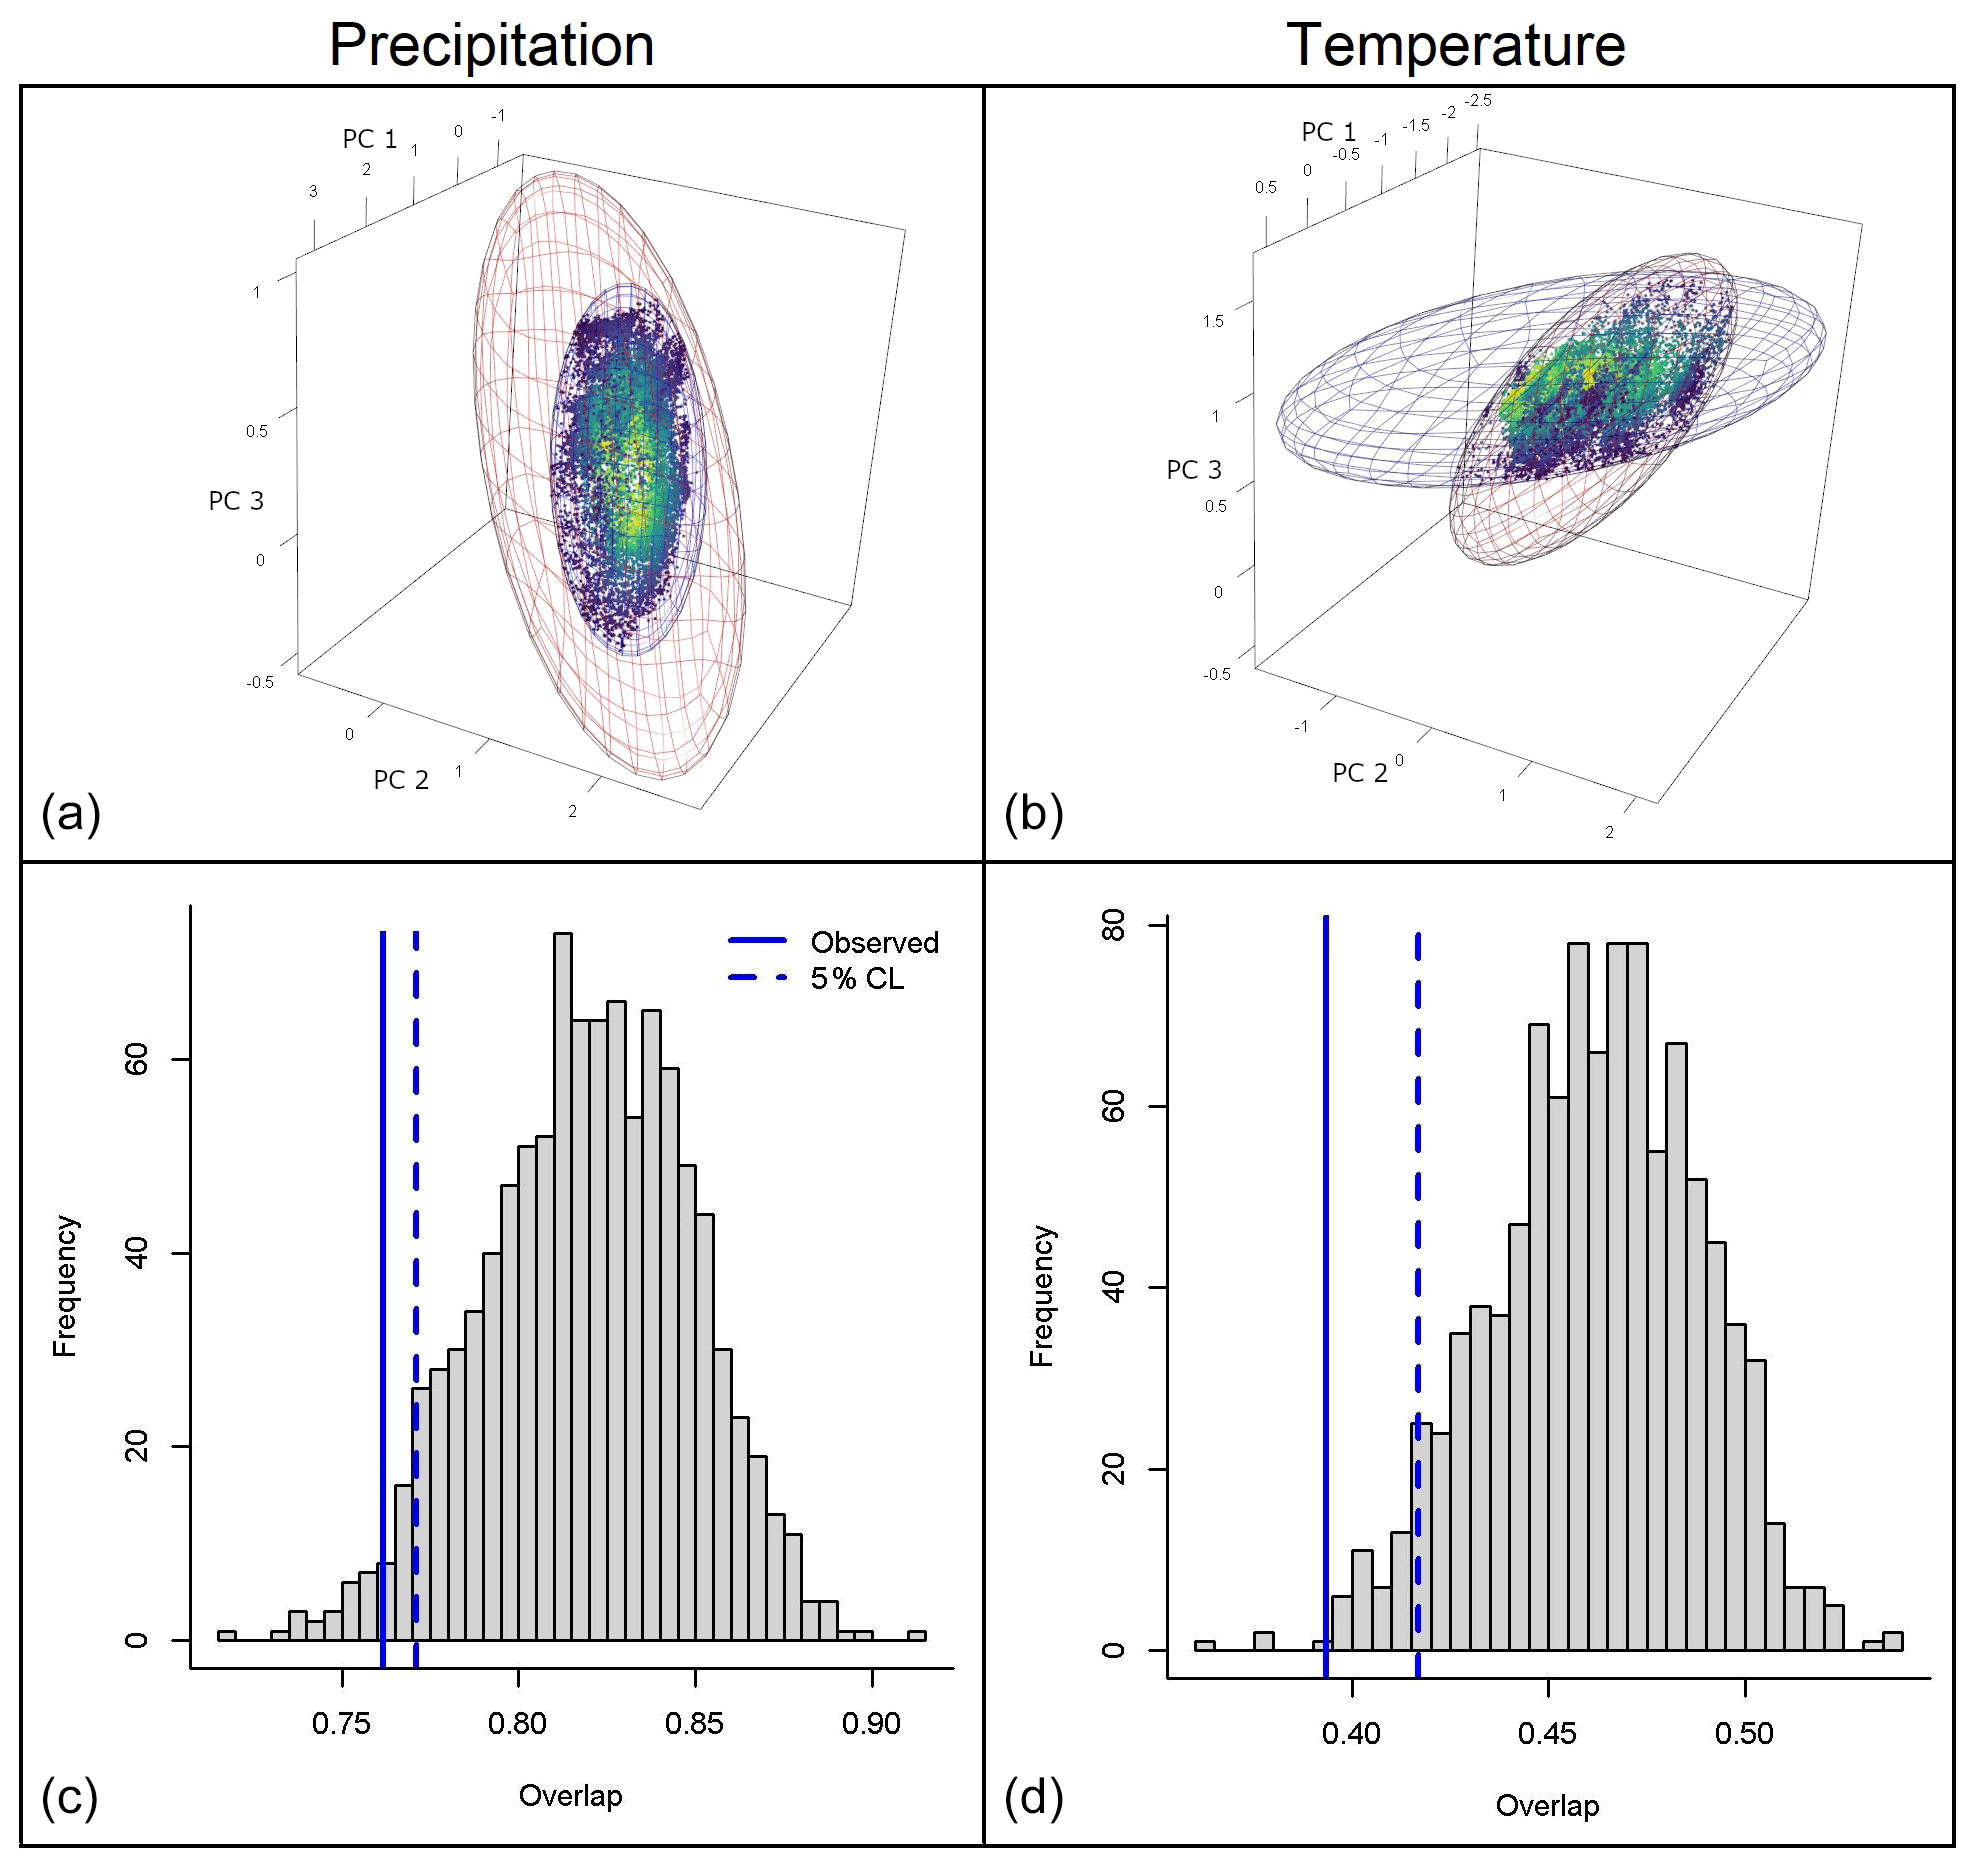
Figure 4(a, b) Species niche overlap based on ellipsoid envelope models (background overlap). Blue and red ellipsoids represent ecological niches of D. marginatus and D. reticulatus, respectively. Warmer colors indicate conditions that are closer to the centroid of D. marginatus. (c, d) Comparison of observed values of niche overlap against the null distribution of 1000 overlap values of random ellipsoids. Solid blue lines show observed values. Dashed blue lines show the 5 % confidence interval.
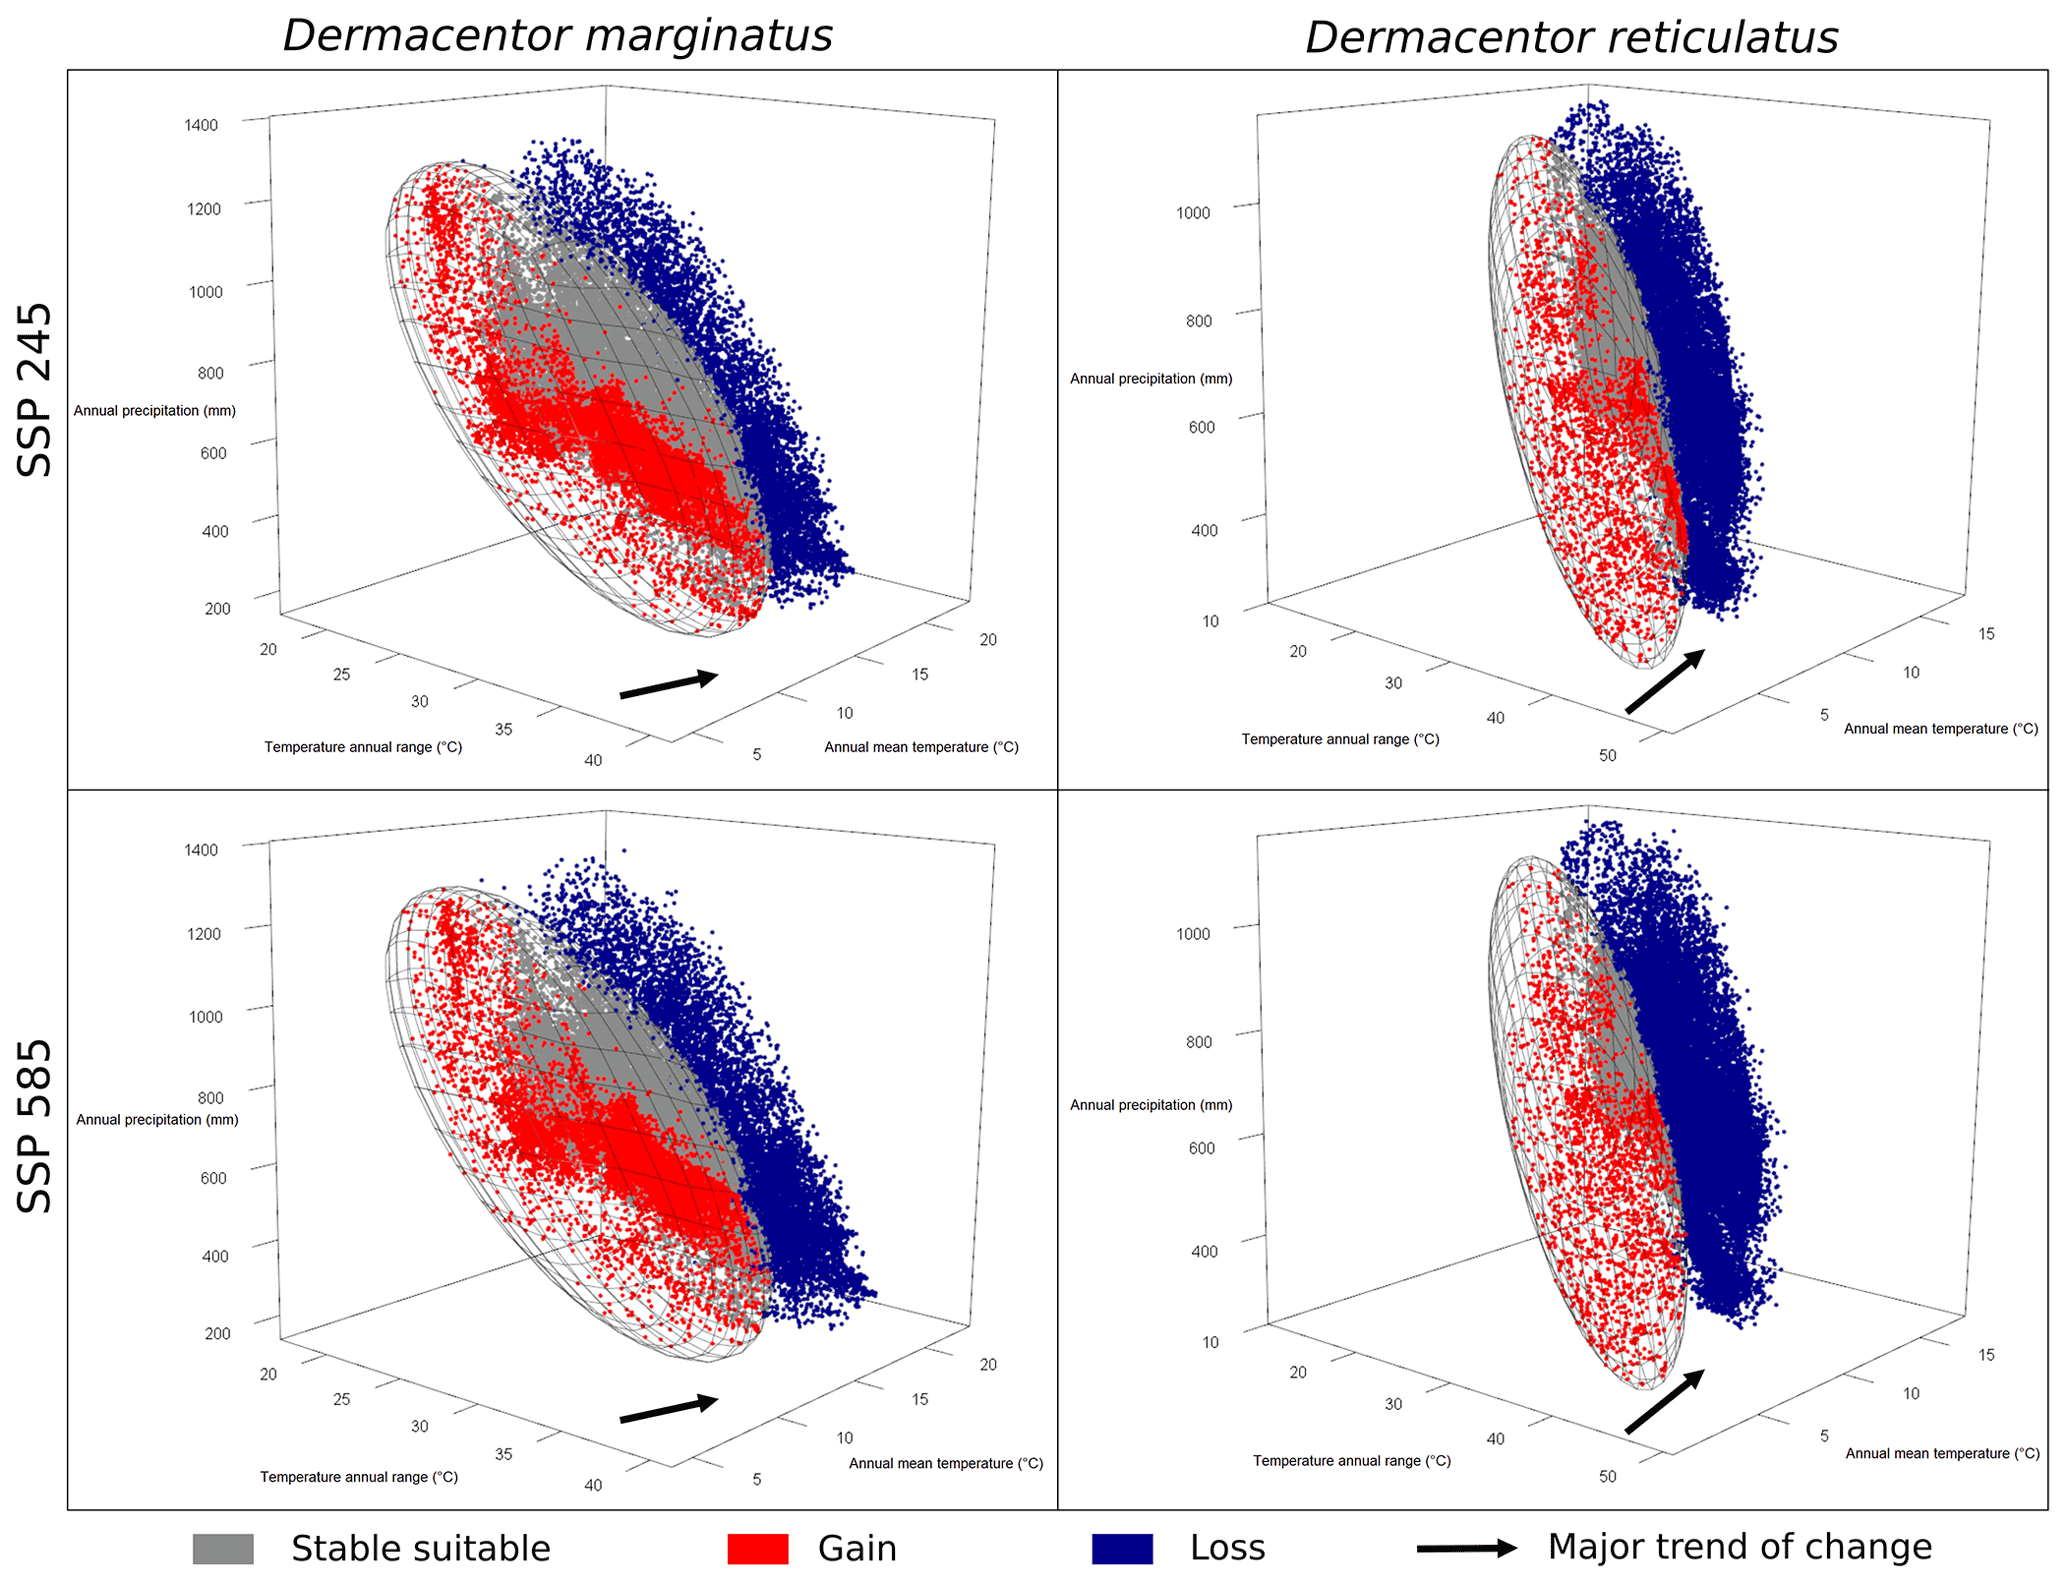
Figure 5Changes in environmental conditions from the species niches' perspective, shown for one GCM (CanESM5). Blue dots indicate sites losing suitability. Red dots indicate sites gaining suitability. Gray dots indicate stable suitable sites.
This study perforce focused on data points available to us, which were concentrated in Europe and parts of western Asia and north Africa (e.g., D. marginatus). Recently, updated GBIF data served to include more occurrence points for D. reticulatus, including parts of eastern Europe and Russia, thanks to iNaturalist becoming a new data contributor to GBIF. In this regard, this study is the first in terms of characterizing ecological niches and modeling the potential geographic distributions of D. marginatus and D. reticulatus under current and future climate conditions and provides a comparison between older data and a broad set of occurrence points for D. reticulatus. In this way, our results highlight the importance of data sharing and having a complete a set of data as possible with which to assess the potential geographic distribution of a species.
Characterizations in environmental and geographic spaces showed that D. marginatus has a broader niche than D. reticulatus. Although niche similarity could not be rejected using the test from Broennimann et al. (2012), the rejection of similarity using the overlap analysis in terms of precipitation and temperature dimensions and the broader niche of D. marginatus could indicate the higher stability of suitable areas for this species under future conditions (Figs. 2–4). We included detailed assessments of model uncertainty to detect areas with strict extrapolation and variation from different sources in model projections. Those two manifestations of model uncertainty are crucial to identifying areas that may lead to misinterpretations of the potential geographic distribution of those tick vectors (Alkishe et al., 2020). For instance, in future projections, areas of strict extrapolation are places with non-analogous conditions to those of the current period; therefore, whether suitability was detected or not in such areas depends entirely on the way the model extrapolates. Variability in our results plays yet another critical role, allowing us to detect areas where predictions can be more safely trusted (i.e., variability is low).
The study by Rubel et al. (2016) discussed the geographic distributions of Dermacentor species, assessed the ranges of the two species treated herein based on georeferenced sampling sites, and found that the limited distribution ranges for D. marginatus and D. reticulatus are 33–51∘ N in latitude and 41–57∘ N in latitude, respectively. A recent study by Okely et al. (2020) showed similar results for D. marginatus under current climate conditions, where models showed potential geographic distributional areas across Europe, north Africa, and Asia. For D. reticulatus, our initial results showed a more restricted potential geographic distribution across central and northern Europe before incorporating newer data from iNaturalist that represented more eastern areas more completely (Figs. 2 and 6d). However, these results changed to include broader areas in eastern Europe and Russia when we used new occurrences (Fig. 6b and c).
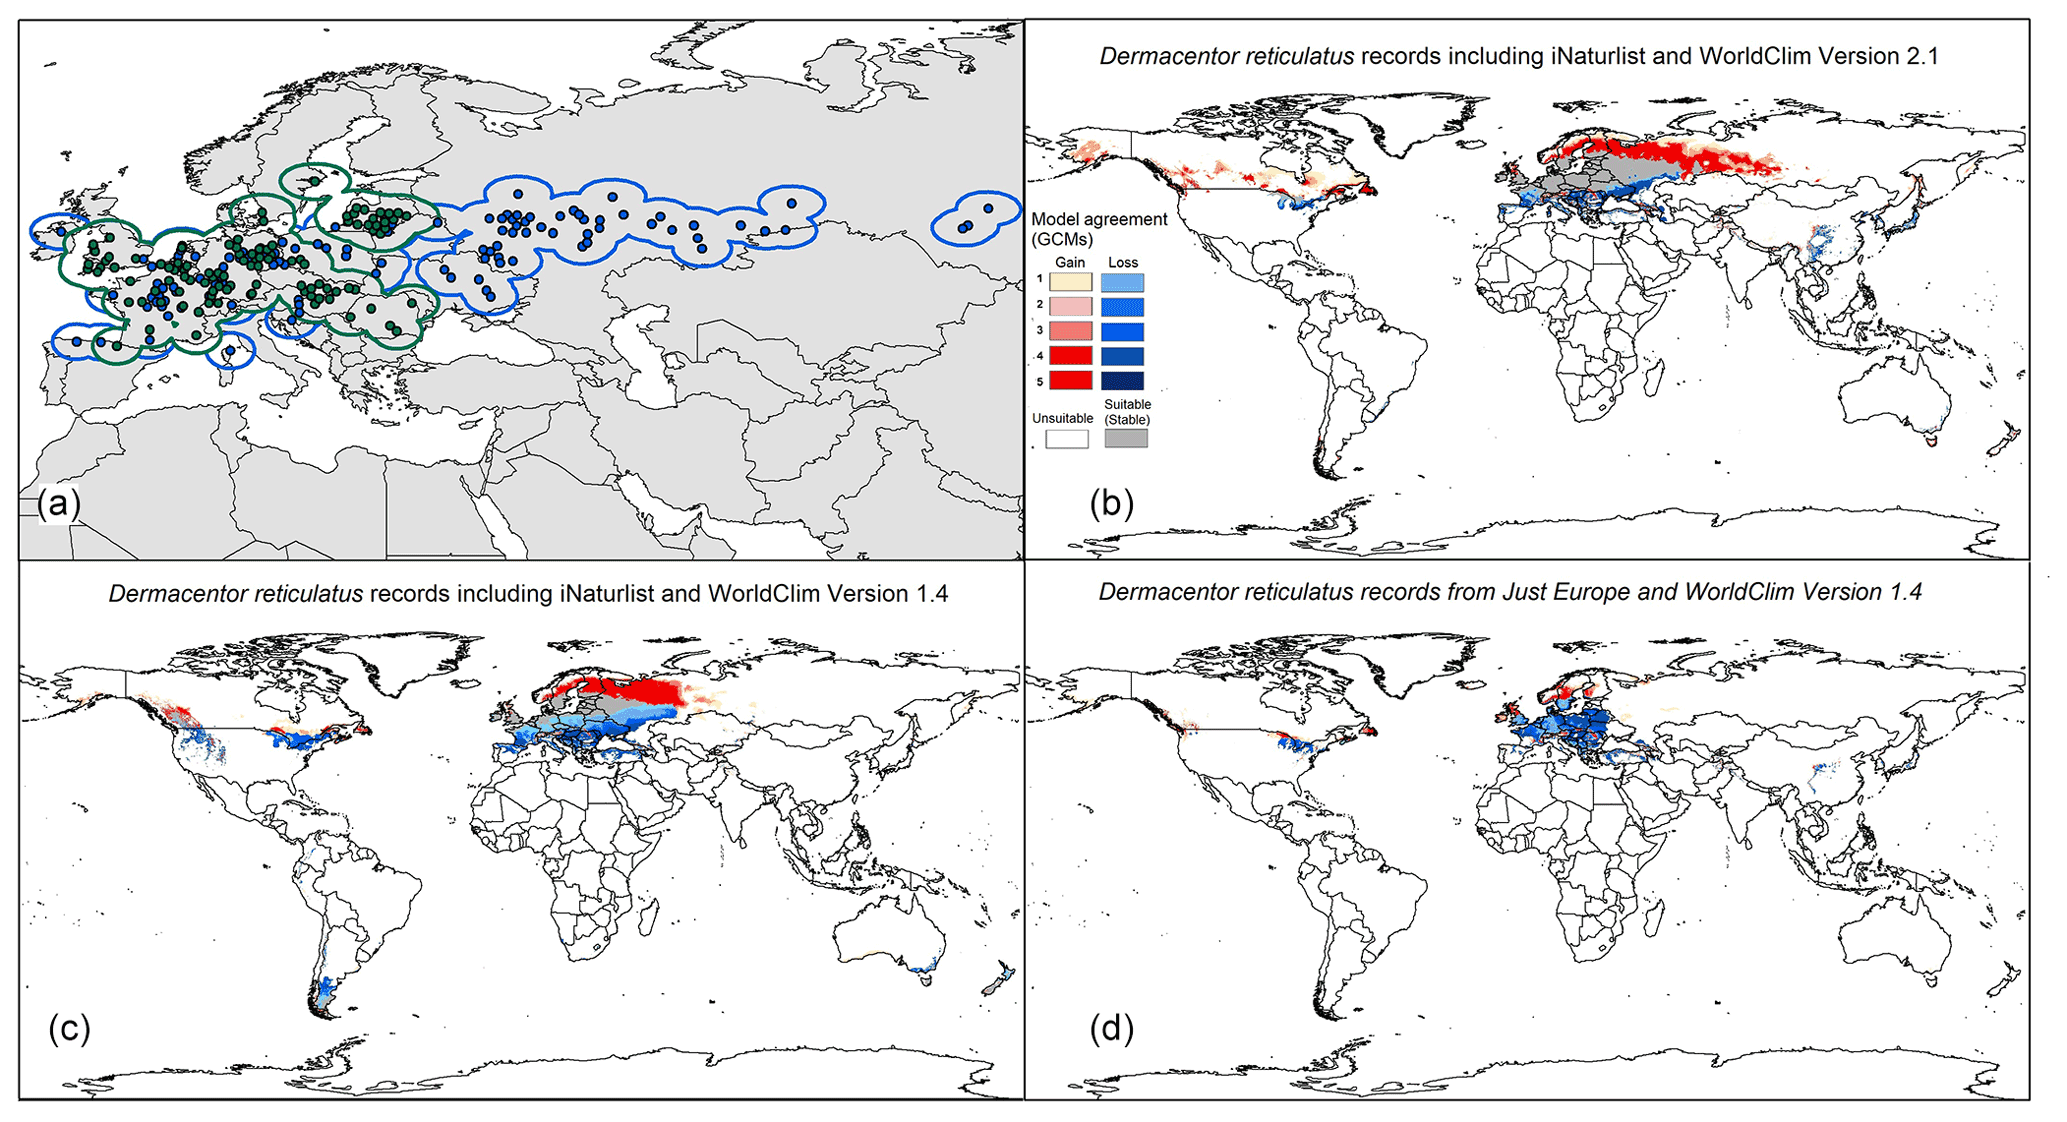
Figure 6Comparison among three different models for Dermacentor reticulatus. (a) Old occurrence points in green dots and new occurrence points in blue. (b) Model transfer globally under current and future conditions using WorldClim version 2.1 and iNaturalist data from GBIF. (c) Model transfer globally under current and future conditions using WorldClim version 1.4 and iNaturalist data from GBIF. (d) Model transfer globally under current and future conditions using WorldClim version 1.4 and old data from GBIF (without iNaturalist data).
Our results added more detail about suitable areas under current conditions and allowed us to anticipate potential changes in suitable areas in the future by projecting models globally. The trend of gains seen for these tick species concurs with previous findings, obtained with similar methods, for other species in Europe (Dermacentor marginatus, Haemaphysalis punctata, Hyalomma marginatum, Rhipicephalus annulatus, R. bursa, and Ixodes ricinus) (Williams et al., 2015; Alkishe et al., 2017) and other parts of the world (James et al., 2015; Raghavan et al., 2019). Our global model showed fewer suitable areas in North America, compared to the species' native distributional area in Europe and Asia for D. marginatus, whereas D. reticulatus showed more restricted suitable areas (Figs. S1 and S2).
Major changes in suitable areas were associated with changes in temperature variables, especially for D. reticulatus, which coincides with the ecological niche differentiation of the two species in these dimensions. Our analyses and representations allowed us to detect that increases in temperatures will likely lead to significant losses and gains of suitable areas (Figs. 5 and S3–S6). These results support the findings of other studies, in which changes in the distribution of species have been mainly associated with changes in temperature (Buczek et al., 2015; Földvári et al., 2016; Walter et al., 2016). Although temperature conditions will change more or less evenly across the region, D. reticulatus is anticipated to see more losses of suitable areas (due to more areas becoming warmer) than D. marginatus in view of its narrower ecological niche that restricts it to higher latitudes and elevations. This idea has been previously suggested by Thuiller et al. (2005) and can be appreciated clearly when exploring the two species' niches and distributions in environmental space.
Our models help in reconstructing potential geographic-scale distributions of species based on environmental factors but do so without considering important factors of microenvironments for the ticks. Biological rhythms for ticks corresponding to daily and seasonal cycles (Belozerov, 1982) and the complexities related to distinct life stages, for instance, are among the most important factors that we do not consider. Temperature and relative humidity have strong influences on tick survival and development rates (Mehlhorn, 2012). Given direct impacts of climate change, particularly in the form of milder winters, new distributional patterns for some Ixodes ticks and tick-borne diseases have been observed, including new latitudinal and elevational records in the Northern Hemisphere in different temperate and boreal regions (Caminade et al., 2019).
Ticks depend on hosts, and physiological features of these hosts can affect their behavior and activity (e.g., feeding and attachment period) (Carroll, 2003; McCoy et al., 2013). In other words, tick population dynamics also depend on the impacts of environmental changes on their host, with potentially complex interactions (Perret et al., 2004; Wikel, 2018). Animal hosts also play an important role by facilitating tick dispersal into new regions (Randolph, 2004; Medlock et al., 2013). In lab experiments, competition between D. marginatus and D. reticulatus could also determine survival, where female D. marginatus show more intensive blood feeding than female D. reticulatus (Buczek et al., 2015). Although we did not include those biotic factors in our models, given the diffuse, one-to-many nature of tick–host interactions in these two species, these aspects may be highly relevant to understanding future scenarios of distribution and interactions of the two ticks studied here (Estrada-Peña et al., 2016). It is worth mentioning that our predictions do not represent estimated densities of species in areas but rather just an approximation of the suitable areas. We believe that these predictions will support public health organizations in anticipating geographic expansions and reductions and help them to take the appropriate steps to investigate and control the spread of those ticks in new areas.
Code is available at https://doi.org/10.5281/zenodo.6785582 (Alkishe, 2022).
Data sources are available at https://doi.org/10.6084/m9.figshare.16918186 (Alkishe et al., 2021). GBIF occurrence downloads are at https://doi.org/10.15468/dl.zkph6s (GBIF.org, 2020) and https://doi.org/10.15468/dl.4zbvk5 (GBIF.org, 2022).
The supplement related to this article is available online at: https://doi.org/10.5194/we-22-33-2022-supplement.
AA, MEC, LOO, and ATP conceived and designed the experiments, performed the experiments, analyzed the data, prepared figures and/or tables, authored or reviewed drafts of the paper, and approved the final draft.
The contact author has declared that neither they nor their co-authors have any competing interests.
Publisher's note: Copernicus Publications remains neutral with regard to jurisdictional claims in published maps and institutional affiliations.
Abdelghafar Alkishe and Marlon E. Cobos would like to thank Amel Dwebi and Claudia Nuñez-Penichet for their support and understanding during working sessions after hours. Luis Osorio-Olvera acknowledges being partially supported by Consejo Nacional de Ciencia y Tecnología (CONACYT; postdoctoral fellowship number 740751; CVU 368747 and project FORDECYT 273646) and PAPIIT IA203922. We thank Jorge Soberón for his advice in performing niche overlap analyses and his constant support.
Luis Osorio-Olvera was partially supported by Consejo Nacional de Ciencia y Tecnología (CONACyT; postdoctoral fellowship number 740751; CVU 368747 and project FORDECyT 273646) and PAPIIT IA203922. The funders had no role in study design, data collection and analysis, decision to publish, or preparation of the manuscript.
This paper was edited by Roland Brandl and reviewed by Stefan Pinkert and two anonymous referees.
Abdullah, S., Helps, C., Tasker, S., Newbury, H., and Wall, R.: Ticks infesting domestic dogs in the UK: a large-scale surveillance programme, Parasit. Vect., 9, 1–9, https://doi.org/10.1186/s13071-016-1673-4, 2016.
Adler, D., Murdoch, D., Nenadic, O., Urbanek, S., Chen, M., Gebhardt, A., and Senger, A.: rgl: 3D Visualization Using OpenGL, R package version 0.100.30, https://CRAN.R-project.org/package=rgl (last access: 15 March 2022), 2019.
Ahmed, J., Alp, H., Aksin, M., and Seitzer, U.: Current status of ticks in Asia, Parasitol. Res., 101, 159–162, 2007.
Aiello-Lammens, M. E., Boria, R. A., Radosavljevic, A., Vilela, B., and Anderson, R. P.: spThin: an R package for spatial thinning of species occurrence records for use in ecological niche models, Ecography, 38, 541–545, https://doi.org/10.1111/ecog.01132, 2015.
Alkishe, A.: Abduelkeesh/Dermacentor-species: Ecological niche modeling of Dermancentor species in Europe (1.1.1), Zenodo [code], https://doi.org/10.5281/zenodo.6785582, 2022.
Alkishe, A., Cobos, M. E., Peterson, A. T., and Samy, A. M.: Recognizing sources of uncertainty in disease vector ecological niche models: an example with the tick Rhipicephalus sanguineus sensu lato, Perspect. Ecol. Conserv., 18, 91–102, https://doi.org/10.1016/j.pecon.2020.03.002, 2020.
Alkishe, A., Cobos, M. E., Peterson, A. T., and Osorio-Olvera, L.: occurence points (Dermacentor marginatus and Dermacentor reticulatus), figshare [data set], https://doi.org/10.6084/m9.figshare.16918186.v1, 2021.
Alkishe, A. A., Peterson, A. T., and Samy, A. M.: Climate change influences on the potential geographic distribution of the disease vector tick Ixodes ricinus, PloS ONE, 12, e0189092, https://doi.org/10.1371/journal.pone.0189092, 2017.
Anderson, R. P. and Raza, A.: The effect of the extent of the study region on GIS models of species geographic distributions and estimates of niche evolution: preliminary tests with montane rodents (genus Nephelomys) in Venezuela, J. Biogeogr., 37, 1378–1393, 2010.
Anderson, R. P., Lew, D., and Peterson, A. T.: Evaluating predictive models of species' distributions: criteria for selecting optimal models, Ecol. Model., 162, 211–232, 2003.
Banks, W. E., Moncel, M.-H., Raynal, J.-P., Cobos, M. E., Romero-Alvarez, D., Woillez, M.-N., Faivre, J.-P., Gravina, B., d'Errico, F., and Locht, J.-L.: An ecological niche shift for Neanderthal populations in Western Europe 70,000 years ago, Scient. Rep., 11, 1–11, 2021.
Barve, N., Barve, V., Jiménez-Valverde, A., Lira-Noriega, A., Maher, S. P., Peterson, A. T., Soberón, J., and Villalobos, F.: The crucial role of the accessible area in ecological niche modeling and species distribution modeling, Ecol. Model., 222, 1810–1819, https://doi.org/10.1016/j.ecolmodel.2011.02.011, 2011.
Bede-Fazekas, Á. and Somodi, I.: The way bioclimatic variables are calculated has impact on potential distribution models, Meth. Ecol. Evol., 11, 1559–1570, 2020.
Belozerov, V.: Diapause and biological rhythms in ticks, in: Physiology of Ticks, Pergamon Press, Oxford, 469–500, https://doi.org/10.1016/B978-0-08-024937-7.50018-4, 1982.
Broennimann, O., Fitzpatrick, M. C., Pearman, P. B., Petitpierre, B., Pellissier, L., Yoccoz, N. G., Thuiller, W., Fortin, M. J., Randin, C., and Zimmermann, N. E.: Measuring ecological niche overlap from occurrence and spatial environmental data, Global Ecol. Biogeogr., 21, 481–497, 2012.
Buczek, A., Kusmierz, A., Olszewski, K., Buczek, L., Czerny, K., and Lancut, M.: Comparison of rabbit skin changes after feeding of Ixodes ricinus (L) and Dermacentor reticulatus (Fabr.), in: Acarid Phylogeny and Evolution: Adaptation in Mites and Ticks, Kluwer Acadmic Publishers, Dordrecht, 419–424, https://doi.org/10.1007/978-94-017-0611-7_42, 2002.
Buczek, A., Bartosik, K., Zając, Z., and Stanko, M.: Host-feeding behaviour of Dermacentor reticulatus and Dermacentor marginatus in mono-specific and inter-specific infestations, Parasit. Vect., 8, 470, https://doi.org/10.1186/s13071-015-1078-9, 2015.
Caminade, C., McIntyre, K. M., and Jones, A. E.: Impact of recent and future climate change on vector-borne diseases, Ann. NY. Acad. Sci., 1436, 157, https://doi.org/10.1111/nyas.13950, 2019.
Campbell, L. P., Luther, C., Moo-Llanes, D., Ramsey, J. M., Danis-Lozano, R., and Peterson, A. T.: Climate change influences on global distributions of dengue and chikungunya virus vectors, Philos. T. Roy. Soc. B, 370, 20140135, https://doi.org/10.1098/rstb.2014.0135, 2015.
Carroll, J. F.: How specific are host-produced kairomones to host-seeking ixodid ticks?. Ticks and Tick-Borne Pathogens, edited by: Jongejan, F. K. W. R., Springer, Dordrecht, https://doi.org/10.1007/978-94-017-3526-1_13, 2003.
Cobos, M. E., Jiménez, L., Nuñez-Penichet, C., Romero-Alvarez, D., and Simoes, M.: Sample data and training modules for cleaning biodiversity information, Biodivers. Inform., 13, 49–50, https://doi.org/10.17161/bi.v13i0.7600, 2018.
Cobos, M. E., Peterson, A. T., Barve, N., and Osorio-Olvera, L.: kuenm: an R package for detailed development of ecological niche models using Maxent, Peer J., 7, e6281, https://doi.org/10.7717/peerj.6281, 2019.
Cobos, M. E., Osorio-Olvera, L., Soberón, J., Peterson, A. T., Barve, V., and Barve, N.: ellipsenm: ecological niche's characterizations using ellipsoids, R package, GitHub [code], https://github.com/marlonecobos/ellipsenm, 2020.
Dautel, H., Dippel, C., Oehme, R., Hartelt, K., and Schettler, E.: Evidence for an increased geographical distribution of Dermacentor reticulatus in Germany and detection of Rickettsia sp. RpA4, Int. J. Med. Microbiol., 296, 149–156, 2006.
De Marco, M. D. M. F., Hernández-Triana, L. M., Phipps, L. P., Hansford, K., Mitchell, E. S., Cull, B., Clive S. Swainsbury, C. S., Fooks, A. R., Medlock, J. M. and Johnson, N.: Emergence of Babesia canis in southern England, Parasit. Vect., 10, 1–9, https://doi.org/10.1186/s13071-017-2178-5, 2017.
Di Cola, V., Broennimann, O., Petitpierre, B., Breiner, F. T., D'amen, M., Randin, C., Engler, R., Pottier, J., Pio, D., and Dubuis, A.: ecospat: an R package to support spatial analyses and modeling of species niches and distributions, Ecography, 40, 774–787, 2017.
Dumpis, U., Crook, D., and Oksi, J.: Tick-borne encephalitis, Clin. Infect. Diseas., 28, 882–890, 1999.
Eea: Global and European Temperature, https://www.eea.europa.eu/data-and-maps/indicators/global-and-european-temperature-9/assessment, (last access: 28 June 2022), 2019.
Escobar, L. E., Lira-Noriega, A., Medina-Vogel, G., and Peterson, A. T.: Potential for spread of the white-nose fungus (Pseudogymnoascus destructans) in the Americas: use of Maxent and NicheA to assure strict model transference, Geospat. Health, 9, 221–229, https://doi.org/10.4081/gh.2014.19, 2014.
Estrada-Peña, A. and Salman, M.: Current limitations in the control and spread of ticks that affect livestock: a review, Agriculture, 3, 221–235, 2013.
Estrada-Peña, A., Alexander, N., and Wint, G. R.: Perspectives on modelling the distribution of ticks for large areas: so far so good?, Parasit. Vect., 9, 1–10, 2016.
Földvári, G., Široký, P., Szekeres, S., Majoros, G., and Sprong, H.: Dermacentor reticulatus: a vector on the rise, Parasit. Vect., 9, 314, https://doi.org/10.1186/s13071-016-1599-x, 2016.
GBIF.org: 21 September 2020 GBIF Occurrence Download, GBIF.org [data set], https://doi.org/10.15468/dl.zkph6s, 2020.
GBIF.org: 15 January 2022 GBIF Occurrence Download, GBIF.org [data set], https://doi.org/10.15468/dl.4zbvk5, 2022.
Gray, J., Dautel, H., Estrada-Peña, A., Kahl, O., and Lindgren, E.: Effects of climate change on ticks and tick-borne diseases in Europe, Interdisciplin. Perspect. Infect. Diseas., 2009, 593232, https://doi.org/10.1155/2009/593232, 2009.
Hijmans, R. J., Cameron, S. E., Parra, J. L., Jones, P. G., and Jarvis, A.: Very high resolution interpolated climate surfaces for global land areas, Int. J. Climatol., 25, 1965–1978, https://doi.org/10.1002/joc.1276, 2005.
Homer, M., Aguilar-Delfin, I., Telford, S. R., Krause, P. J., and Town, P.: Babesiosis, Clin. Microbiol. Rev., 13, 451–469, 2000.
James, A., Burdett, C., McCool, M., Fox, A., and Riggs, P.: The geographic distribution and ecological preferences of the American dog tick, Dermacentor variabilis (Say), in the USA, Med. Veterin. Entomol., 29, 178–188, 2015.
Jongejan, F., Ringenier, M., Putting, M., Berger, L., Burgers, S., Kortekaas, R., Lenssen, J., Van Roessel, M., Wijnveld, M. and Madder, M.: Novel foci of Dermacentor reticulatus ticks infected with Babesia canis and Babesia caballi in the Netherlands and in Belgium, Parasit. Vect., 8, 1–10, https://doi.org/10.1186/s13071-015-0841-2, 2015.
Mammola, S.: Assessing similarity of n-dimensional hypervolumes: Which metric to use?, J. Biogeogr., 46, 2012–2023, https://doi.org/10.1111/jbi.13618, 2019.
Masala, G., Chisu, V., Satta, G., Socolovschi, C., Raoult, D., and Parola, P.: Rickettsia slovaca from Dermacentor marginatus ticks in Sardinia, Italy, Ticks Tick-Born. Diseas., 3, 393–395, 2012.
McCoy, K. D., Léger, E., and Dietrich, M.: Host specialization in ticks and transmission of tick-borne diseases: a review, Front. Cell. Infect. Microbiol., 3, 57, https://doi.org/10.3389/fcimb.2013.00057, 2013.
Medlock, J. M., Hansford, K. M., Bormane, A., Derdakova, M., Estrada-Peña, A., George, J.-C., Golovljova, I., Jaenson, T. G., Jensen, J.-K., and Jensen, P. M.: Driving forces for changes in geographical distribution of Ixodes ricinus ticks in Europe, Parasit. Vect., 6, 1, https://doi.org/10.1186/1756-3305-6-1, 2013.
Medlock, J. M., Hansford, K., Vaux, A., Cull, B., Abdullah, S., Pietzsch, M., Wall, R., Johnson, N., and Phipps, L.: Distribution of the tick Dermacentor reticulatus in the United Kingdom, Med. Veterin. Entomol., 31, 281–288, 2017.
Mehlhorn, H.: Arthropods as vectors of emerging diseases, Springer, Heidelberg, https://doi.org/10.1007/978-3-642-28842-5_1, 2012.
Nuñez-Penichet, C., Cobos, M. E., and Soberon, J.: Non-overlapping climatic niches and biogeographic barriers explain disjunct distributions of continental Urania moths, Front. Biogeogr., 13, e52142, https://doi.org/10.21425/F5FBG52142, 2021.
Nuttall, P. A., Jones, L. D., Labuda, M., and Kaufman, W. R.: Adaptations of arboviruses to ticks, J. Med. Entomol., 31, 1–9, 1994.
Okely, M., Anan, R., Gad-Allah, S., and Samy, A. M.: Mapping the environmental suitablity of etiological agent and tick vectors of Crimean-Congo hemorrhagic fever, Acta Tropica, 203, 105319, https://doi.org/10.1016/j.actatropica.2019.105319, 2020.
Osorio-Olvera, L., Yañez-Arenas, C., Martínez-Meyer, E., and Peterson, A. T. Relationships between population densities and niche-centroid distances in North American birds, Ecol. Lett., 23, 555–564, https://doi.org/10.1111/ele.13453, 2020.
Owens, H. L., Campbell, L. P., Dornak, L. L., Saupe, E. E., Barve, N., Soberón, J., Ingenloff, K., Lira-Noriega, A., Hensz, C. M., and Myers, C. E.: Constraints on interpretation of ecological niche models by limited environmental ranges on calibration areas, Ecol. Model., 263, 10–18, 2013.
Parola, P. and Raoult, D.: Ticks and tickborne bacterial diseases in humans: an emerging infectious threat, Clin. Infect. Diseas., 32, 897–928, 2001.
Perret, J.-L., Rais, O., and Gern, L.: Influence of climate on the proportion of Ixodes ricinus nymphs and adults questing in a tick population, J. Med. Entomol., 41, 361–365, 2004.
Peterson, A. T., Papeş, M., and Soberón, J.: Rethinking receiver operating characteristic analysis applications in ecological niche modeling, Ecol. Model., 213, 63–72, 2008.
Peterson, A. T., Cobos, M. E., and Jiménez-García, D.: Major challenges for correlational ecological niche model projections to future climate conditions, Ann. NY. Acad. Sci., 1429, 66–77, 2018.
Pfäffle, M., Littwin, N., and Petney, T.: Host preferences of immature Dermacentor reticulatus (Acari: Ixodidae) in a forest habitat in Germany, Ticks Tick-Born. Diseas., 6, 508–515, 2015.
Phillips, S. J., Anderson, R. P., Dudík, M., Schapire, R. E., and Blair, M. E.: Opening the black box: an open-source release of Maxent, Ecography, 40, 887–893, https://doi.org/10.1111/ecog.03049, 2017.
Qiao, H., Peterson, A. T., Campbell, L. P., Soberón, J., Ji, L., and Escobar, L. E.: NicheA: Creating virtual species and ecological niches in multivariate environmental scenarios, Ecography, 39, 805–813, https://doi.org/10.1111/ecog.01961, 2016.
Raghavan, R. K., Peterson, A. T., Cobos, M. E., Ganta, R., and Foley, D.: Current and future distribution of the lone star tick, Amblyomma americanum (L.) (Acari: Ixodidae) in North America, PLoS ONE, 14, e0209082, https://doi.org/10.1371/journal.pone.0209082, 2019.
Randolph, S. E.: Evidence that climate change has caused `emergence' of tick-borne diseases in Europe?, Int. J. Med. Microbiol. Suppl., 293, 5–15, 2004.
R Core Team: R: A language and environment for statistical computing, R Foundation for Statistical Computing, Vienna, Austria, https://www.R-project.org/ (last access: 28 June 2022), 2020.
Rubel, F., Brugger, K., Pfeffer, M., Chitimia-Dobler, L., Didyk, Y. M., Leverenz, S., Dautel, H., and Kahl, O.: Geographical distribution of Dermacentor marginatus and Dermacentor reticulatus in Europe, Ticks Tick-Born. Diseas., 7, 224–233, 2016.
Sonenshine, D. E. and Roe, R. M.: Biology of Ticks, Oxford University Press, ISBN 978-0-19-974405-3, 2013.
Thuiller, W., Lavorel, S., and Araújo, M. B.: Niche properties and geographical extent as predictors of species sensitivity to climate change, Global Ecol. Biogeogr., 14, 347–357, https://doi.org/10.1111/j.1466-822X.2005.00162.x, 2005.
Van Aelst, S. and Rousseeuw, P.: Minimum volume ellipsoid, Wiley Interdisciplin. Rev.: Comput. Stat., 1, 71–82, https://doi.org/10.1002/wics.19, 2009.
Walter, M., Brugger, K., and Rubel, F.: The ecological niche of Dermacentor marginatus in Germany, Parasitol. Res., 115, 2165–2174, 2016.
Warren, D. L. and Seifert, S. N.: Ecological niche modeling in Maxent: the importance of model complexity and the performance of model selection criteria, Ecol. Appl., 21, 335–342, https://doi.org/10.1890/10-1171.1, 2011.
Wikel, S. K.: Ticks and tick-borne infections: complex ecology, agents, and host interactions, Veterin. Sci., 5, 60, https://doi.org/10.3390/vetsci5020060, 2018.
Williams, H. W., Cross, D. E., Crump, H. L., Drost, C. J., and Thomas, C. J.: Climate suitability for European ticks: assessing species distribution models against null models and projection under AR5 climate, Parasit. Vect., 8, 440, https://doi.org/10.1186/s13071-015-1046-4, 2015.
Wójcik-Fatla, A., Cisak, E., Zając, V., Zwoliński, J., and Dutkiewicz, J.: Prevalence of tick-borne encephalitis virus in Ixodes ricinus and Dermacentor reticulatus ticks collected from the Lublin region (eastern Poland), Ticks Tick-Born. Diseas., 2, 16–19, 2011.