the Creative Commons Attribution 4.0 License.
the Creative Commons Attribution 4.0 License.
 | 13 Jul 2022
Lengthening of the growth season, not increased water availability, increased growth of Picea likiangensis var. rubescens plantations on eastern Tibetan Plateau due to climate change
Songlin Shi
Peihao Peng
Qiang Zhou
Haijun Wang
Xiubin Liu
On the eastern Tibetan Plateau, the growth of trees is strongly affected by climate change. Previous researchers have found that climate warming changes thermal and hydraulic conditions, lengthening the growing season and promoting tree growth. Some studies have analyzed the effects of drought, precipitation, and temperature on tree growth. However, previous studies have mainly focused on natural forests, with few studies on the response of plantations to climate change. Therefore, we studied the relationship between dendrochronology (basal area increment, BAI), normalized difference vegetation index (NDVI), and climate factors to explore the response of Picea likiangensis var. rubescens plantations to climate change. The results showed that from 1990 to 2018, the temperature in the study area increased significantly; the rate of increase was 0.39∘ per decade. Among the climate factors, self-calibrated Palmer drought severity index (scPDSI) had the most significant impact on BAI. From P_May (P_ represents the month of the previous year) to December, BAI was always negatively correlated with the scPDSI, with 9 months being significantly negatively correlated. BAI was significantly positively correlated with the minimum 2 m temperature (TMN) in P_July, P_September, July, and September. BAI was significantly positively correlated with the maximum 2 m temperature (TMX) in P_October, P_December, and July. BAI was significantly positively correlated with the mean 2 m temperature (TMP) in P_July, P_December, and July. There is a significant positive correlation between BAI and annual NDVI (NDVIa), which means that NDVI can be used to study the response of plantations to climate change. Our study contributes to a better understanding of the response of plantation growth in high-altitude areas to climate change, which is needed by forest managers.
- Article
(4240 KB) - Full-text XML
- BibTeX
- EndNote


Vegetation not only has the ability of carbon fixation, oxygen release, and climate regulation (Shi et al., 2019a; Zhou et al., 2020) but also is sensitive to climate change (Gao et al., 2018; Liu et al., 2021). On the one hand, plants can convert carbon dioxide and water in the environment into organic matter and store them in tree trunks through photosynthesis (Seftigen et al., 2018; Zhou et al., 2020). This can consume carbon dioxide in the atmosphere and alleviate the greenhouse effect (Tei and Sugimoto, 2018; Zhang et al., 2013; Zhang et al., 2011; Bousquet, 2000). On the other hand, climate change alters thermal and hydraulic conditions, leading to changes in plant growth (Keyimu et al., 2020). Some studies have shown that a warming climate will extend the growing season of vegetation, increase the rate of photosynthesis, and make forest growth faster (Lindner et al., 2010; Pretzsch et al., 2014; Mcmahon et al., 2010). However, climate warming increases evapotranspiration, leading to drought stress on tree growth (Worrall et al., 2013; Hogg et al., 2017; Chen et al., 2017). Therefore, observing and studying forest growth dynamics and understanding their relationship with climate change are essential for forest management and sustainable development (Anderegg et al., 2012; Wang et al., 2021).
The dendroecological analysis is considered to be one of the most effective methods to study the impact of climate change on vegetation growth (Tei et al., 2017; Nikolaev et al., 2009; Tei and Sugimoto, 2018). Tree rings reflect how much wood was formed in a year, and this may be associated with increased biomass as well as carbon uptake (Vicente-Serrano et al., 2016; Van Breugel et al., 2011). In recent decades, dendroecological approaches have been widely used to study the response of forest growth to climate change (Shestakova et al., 2016; Williams et al., 2010). Although dendroecology has many advantages, such as high time continuity, sensitivity to climate change, and accurate results (Sun et al., 2020; St. George, 2014; Zheng et al., 2019), the compilation of tree-ring chronologies also involves time-consuming fieldwork and laboratory work such as tree-ring sample collection, width measurement, and cross-dating (Bhuyan et al., 2017; Vicente-Serrano et al., 2016). These shortcomings limit dendroecological methods for real-time monitoring of forest growth in a wider area (Camarero et al., 2010; Wang et al., 2021; Xu et al., 2019).
Plant leaves have different absorption and reflectance of red and near-infrared light wavelengths (Xu et al., 2019). Multispectral sensors have spectral bands of visible and infrared wavelengths combined to produce vegetation indices (Brown et al., 2006; Wang et al., 2003). Normalized difference vegetation index (NDVI) values range from −1.0 to +1.0, with negative values corresponding to surfaces without vegetation cover and positive values corresponding to surfaces with vegetation cover (Brehaut and Danby, 2018). Compared to dendrochronological methods, NDVI can reflect the density of green vegetation, changes in the tree structure, and the productivity and growth of vegetation and is often used to study the response of vegetation growth to climate change (Hashimoto et al., 2009; Zhou et al., 2020; Wang et al., 2021; Goetz et al., 2005; Lambert et al., 2013; Pettorelli et al., 2005). However, the relationship between NDVI and tree growth (BAI) in Picea likiangensis var. rubescens (hereafter P. likiangensis) plantations has not been tested yet.
Daofu County is located at a high altitude on the eastern Tibetan Plateau (ETP). The forests in this region are sensitive to climate change (Keyimu et al., 2020). P. likiangensis is one of the dominant tree species in this area and is also a common afforestation tree. However, instrumental records of climate change are limited in high-altitude forests (Correa-Díaz et al., 2019). Therefore, the combination of dendrochronology and NDVI is widely used to study forest growth dynamics and their relationship with climate change in this area (Brehaut and Danby, 2018; Dorman et al., 2015). Some studies have shown that climate warming has a positive impact on forest growth in the region (Li et al., 2017; Shi et al., 2019a, 2019b), and some researchers have come to different conclusions (Keyimu et al., 2020; Mou et al., 2019). Most of these studies are focused on natural forests, and there is little research on the response of plantation growth to climate change. Therefore, it is of great significance to understand the relationship between the growth of P. likiangensis plantations and climate change on the ETP for regional ecological security and forest management.
In this study, we sampled tree-ring cores and established basal area increment (BAI) chronology for four sampling sites on the ETP to explore the growth dynamics and response to climate change in P. likiangensis plantations. For this purpose, we used correlation analyses to test the relationship of BAI as well as NDVI with climate factors. The results will provide insights for future forest management and help answer the question of whether the NDVI time series can contribute to our understanding of climate effects on plantation growth.
2.1 Study region and sampling sites
The study region is located in the Muru forest farm (32∘21′–30∘32′ N, 100∘32′–101∘44′ E) of Daofu County, Ganzi Prefecture, which is located on the ETP (Fig. 1). According to data from the nearest Daofu meteorological station (30.98333∘ N, 101.11667∘ E; 2957.2 m a.s.l.; 1982–2018; locations in Fig. 1, downloaded from https://www.resdc.cn/data.aspx?DATAID=230, last access: 13 February 2020), the average annual temperature is 8.23 ∘C, July is the warmest month, with an average temperature of 16.12 ∘C, and January is the coldest month, with an average temperature of −1.51 ∘C. The mean annual precipitation is 633.17 mm, mainly concentrated from June to September, accounting for 74.89 % of the total annual precipitation. The soil type is brown mountain soil, and the vegetation type is typical subalpine coniferous forests. Four sample plots (30 m × 30 m) were set up in P. likiangensis plantations (altitude 3688–3740 m) and were planted at the same time (the 1990s). Trees that were not injured or diseased were selected, and tree-ring samples were collected at a height of 1.3 m from the trunk using a 5 mm diameter incremental borer. At each sample plot, we selected 25–35 trees, extracted 2 cores from different directions of each tree, and collected a total of 240 tree-ring cores.

Figure 1(a, b) Location map of sampling site (fuchsia triangle) in the eastern Tibetan Plateau. The red dot is the location of the Daofu meteorological station, and the gray diagonal grid represents the CRU cell. (c) The growth status of the P. likiangensis plantations in the study area (photo taken in July 2019). The map is reproduced from Tianditu (http://www.tianditu.gov.cn, last access: 2 March 2022).
2.2 Tree-ring data
The samples collected in the field were taken back to the laboratory and treated with standard chronological techniques (Stokes and Smiley, 1968). The samples were fixed in the wooden holders with latex to dry and polished with coarse to fine sandpaper (180, 360, 600, and 1000 grit) until all rings could be distinguished under the microscope. Each sample was measured using the LINTAB 6.0 measuring system (Rinntech, Heidelberg, Germany) to an accuracy of 0.001 mm. Cross-dating involves marking the sample with a pencil under a microscope and verifying it with the COFECHA program (Grissino-Mayer, 2001). Samples with low correlations with the main chronology were excluded from the final chronology. This study focused on the growth of P. likiangensis plantations, so the time series were relatively short (23–25 years). Therefore, basal area increment (BAI), which was more related to tree productivity, was used as an index to measure tree growth (Girardin et al., 2016). BAI was calculated using the formula
where Rt and Rt−1 are the cumulative stem radial increment (in centimeters) at the end and beginning of a given tree-ring increment, respectively. For this step, we used the “dplR” package (Dendrochronology Program Library) in R (Bunn, 2008, 2010).
2.3 NDVI data
For the past several decades, NDVI has been widely used to monitor vegetation productivity (Running et al., 2000), Moderate Resolution Imaging Spectroradiometer (MODIS) and Global Inventory Modeling and Mapping Studies 3G (GIMMS3g) being the most commonly used products. Although the GIMMS3g NDVI product has a long recording time, its spatial resolution (approximately 8 km grid cells) is relatively low (Coulthard et al., 2017). Therefore, for the monthly NDVI (NDVIm) we used the MODIS NDVI product (MOD13A3; http://modis.gsfc.nasa.gov/, last access: 17 May 2021), which is a monthly product dataset with a spatial resolution of 1000 m (Xu et al., 2018). The MOD13A3 record began in February 2000, and we analyzed data from 2000 until 2018 (the last year's tree-ring dataset is 2018). The annual NDVI (NDVIa) was obtained from the China annual vegetation index (NDVI) spatial distribution dataset (spatial resolution: 1000 m; 1998–2018; http://www.resdc.cn/DOI, last access: 17 May 2021), which was composited by taking the maximum value of NDVI during the whole year (maximum-value composite, MVC) (Xu, 2018). The latitude and longitude of each of the tree-ring sites were used to select the corresponding pixel from the NDVIm and NDVIa.
2.4 Climate data
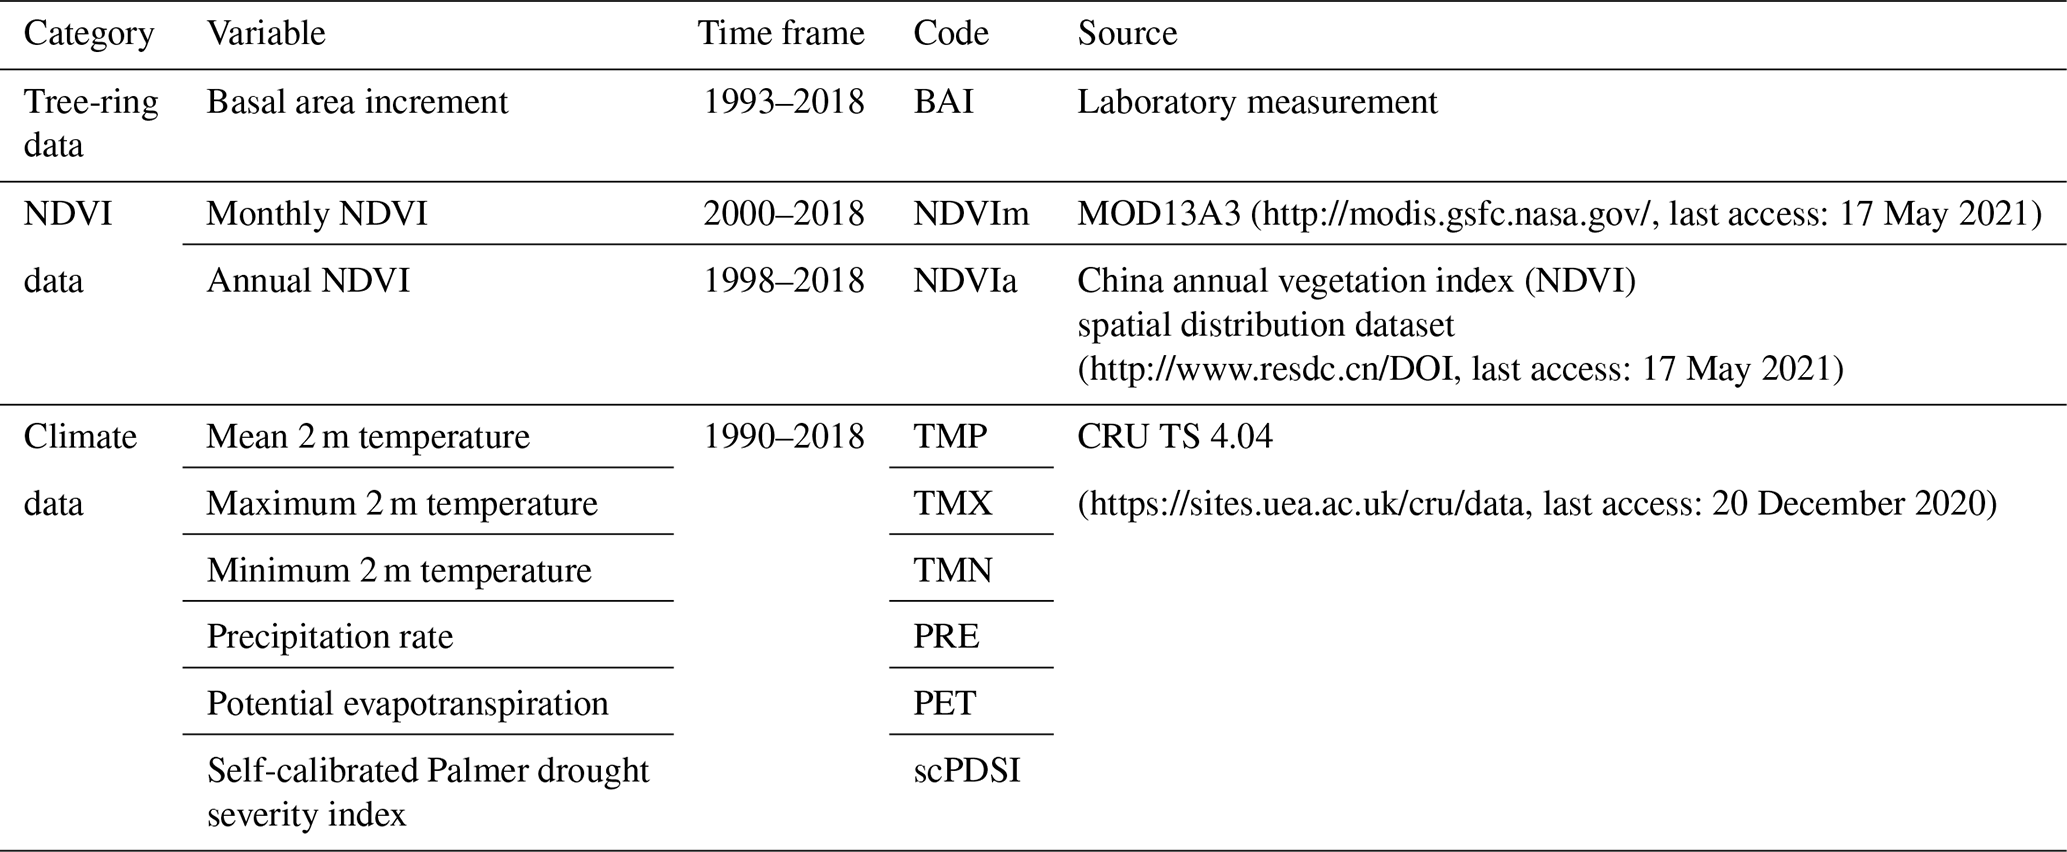
There is no meteorological station in the study region. The nearest Daofu meteorological station (30.98333∘ N, 101.11667∘ E) is 35 km away from the sampling site, and there is an elevation difference of about 1000 m. Therefore, we use the Climatic Research Unit gridded Time Series dataset (https://sites.uea.ac.uk/cru/datalast access: 20 December 2020; CRU TS 4.04; 0.5∘ × 0.5∘ grid), our tree-ring sampling site in the center of the CRU grid (Fig. 1). CRU TS provides a high-resolution monthly grid of land-based (excluding Antarctica) observations since 1901, composed of 10 observed variables and derived variables (Harris et al., 2020). We used mean 2 m temperature (TMP), maximum 2 m temperature (TMX), minimum 2 m temperature (TMN), precipitation rate (PRE), potential evapotranspiration (PET), and self-calibrated Palmer drought severity index (scPDSI) (Table 1). We downloaded the CRU TS grid (30.5–31.0∘ N, 101.0–101.5∘ E) corresponding to the tree-ring sampling site. Since the tree-ring data first began in 1993, we truncated CRU data before 1990, so the length of the climate record is 29 years (1990 to 2018). The scPDSI greater than 0.5 means wet, 0.5 to −0.5 means near normal, and less than 0.5 means drought (Van Der Schrier et al., 2013).
2.5 Statistical analyses
To explore the relationship between tree-ring, NDVI data, and climate variables, we analyzed Pearson correlations of BAI, NDVIa, NDVIm, and climate variables using SPPSAU (https://spssau.com/en/index.html, last access: 21 May 2022). The analysis results and data were visualized using the “ggplot2” package in R (Wickham, 2016) and Hiplot (https://hiplot.com.cn/basic?lang=en, last access: 21 May 2022) for ease of observation.
3.1 Climate variations in the study area
To clarify the pattern of climate change in the study area in recent decades, we analyzed the TMP, PRE, PET, and scPDSI change trends from 1990 to 2018 based on CRU data (Fig. 2). We found a significant increase in TMP from 1990 to 2018 (R2=0.4649, p<0.001); the rate of increase was 0.39∘ per decade and has slowed down since 2010 (Fig. 2a). Though the slope of the regression of PRE shows a low decrease, it was not significant (Fig. 2b). Changes in PET indicate changes in the surface of the study area, with a significant increase in PET over the past decades (R2=0.534, p<0.001), but there has been a decline since 2010 (Fig. 2c). From 1990 to 2018, the study area was mostly drought (scPDSI < 0.5), with scPDSI rebounding from 2010, indicating a decrease in drought (Fig. 2d). In conclusion, the climate change in the study region in the past 29 years is significant, which may significantly affect the growth of P. likiangensis plantations in the area.

Figure 2Change trends in climate factors: (a) mean 2 m temperature (TMP), (b) precipitation rate (PRE), (c) potential evapotranspiration (PET), and (d) self-calibrated Palmer drought severity index (scPDSI). The red line represents the linear trend of climate variables.
3.2 Tree growth trends reflected by BAI and NDVI
To clarify the growth dynamics of P. likiangensis plantations, BAI trends were analyzed at four sampling sites (Fig. 3). BAI for S1, S2, S3, and S4 began in 1994, 1993, 1995, and 1994, respectively. The four sampling sites showed a similar pattern of change trends with a significant increase in BAI: S1 (R2=0.9437, p<0.001), S2 (R2=0.9389, p<0.001), S3 (R2=0.9098, p<0.001), and S4 (R2=0.9077, p<0.001). The rate of increase was 300.21 to 451.04 mm2 per decade. Pearson correlation analysis showed significant and very high correlations (r>0.93, p<0.01) between BAI at all four sites. This also indicates that the BAI chronology of the four sampling sites has a similar trend.

Figure 3Variation trend of basal area increment (BAI) at four sampling sites: (a) S1 (1994–2018), (b) S2 (1993–2018), (c) S3 (1995–2018), (d) S4 (1994–2018). The red lines indicate linear trends.
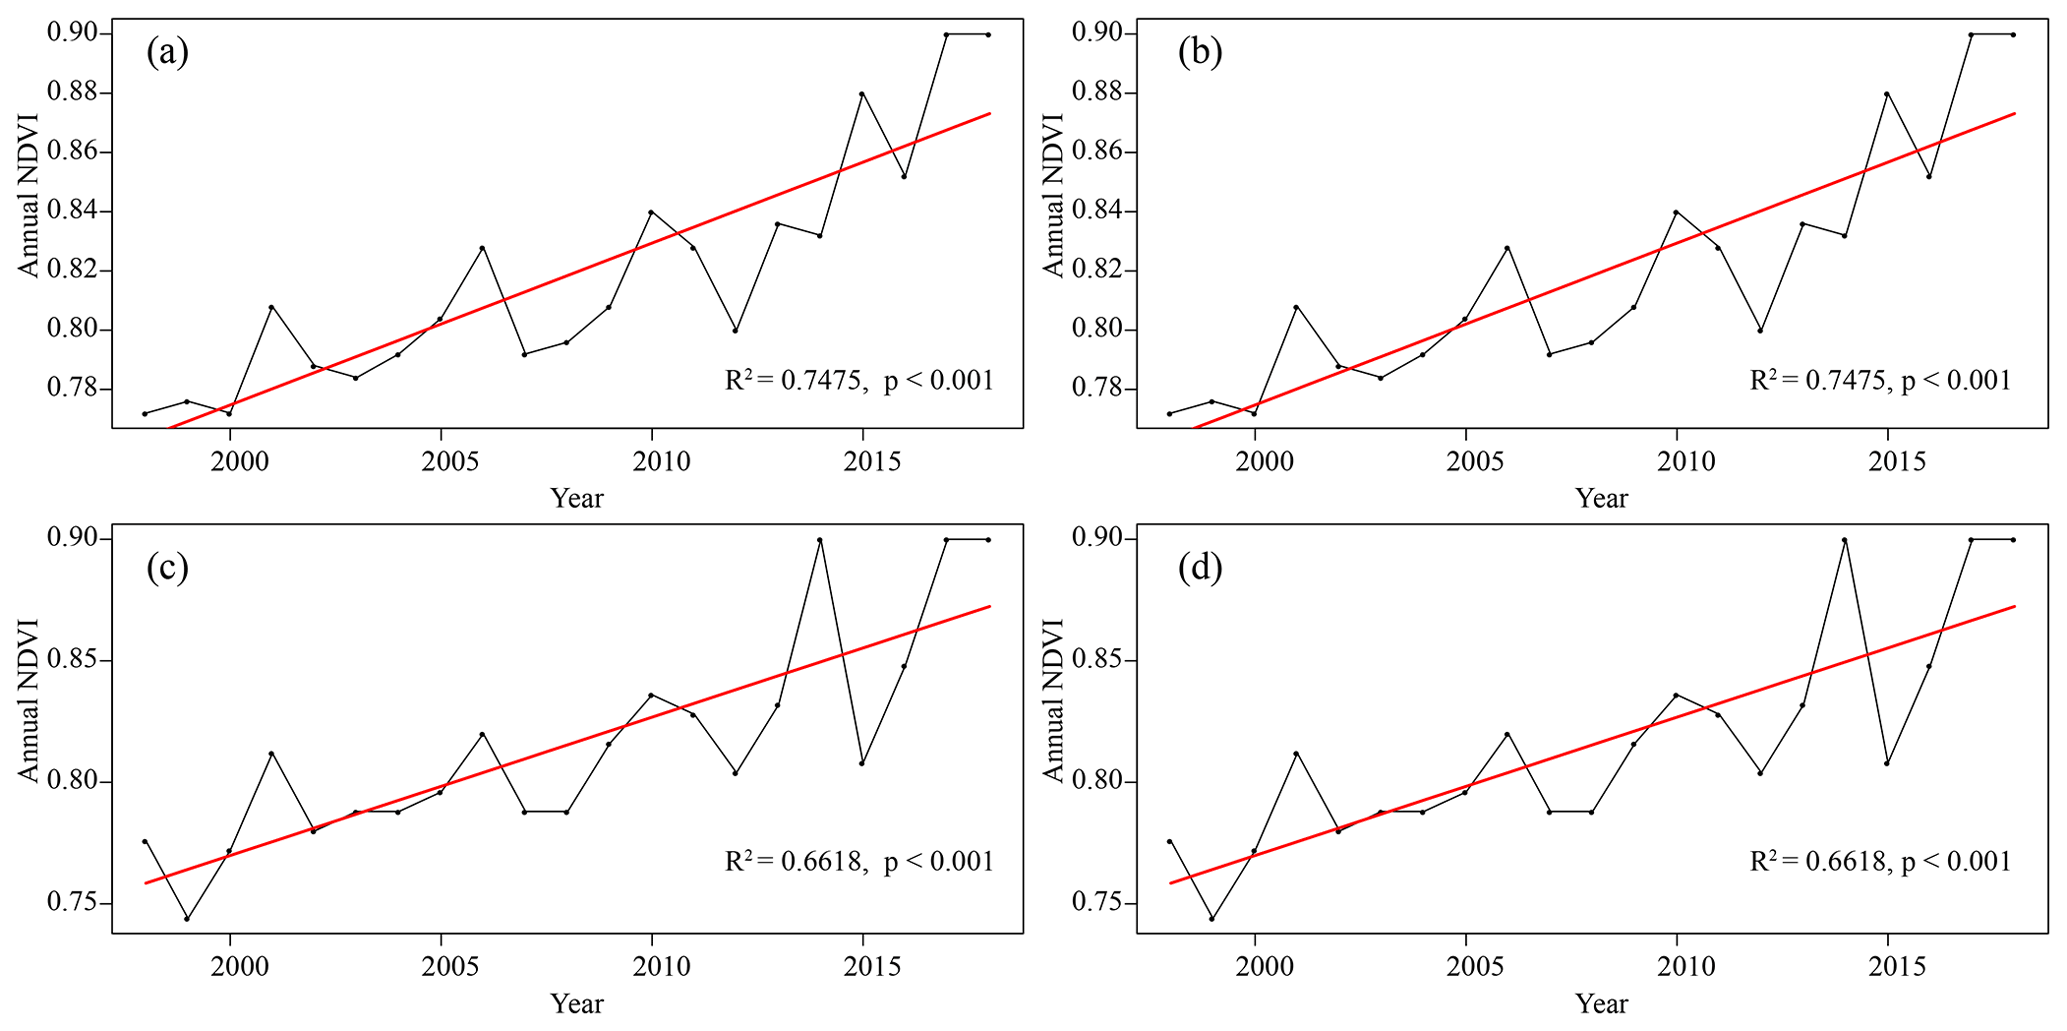
Figure 4Variation trend of annual NDVI (NDVIa) at four sampling sites: (a) S1, (b) S2, (c) S3, and (d) S4. The black dots represent the value of NDVIa; red lines indicate linear trends.
To explore the availability of NDVI for tree growth monitoring, NDVI trends at the four sampling sites were also analyzed (Fig. 4). From 1998 to 2018, the NDVIa of four sampling sites showed the same trend as BAI, and the NDVIa increased significantly (R2>0.66, p<0.05). The rate of increase was 0.055 to 0.057 per decade. According to the pattern of monthly NDVI changes (Fig. 5), the four sampling sites had higher NDVIm values from May to October and lower NDVIm values from January to April, November, and December, indicating that the vegetation growing season in the study area was from May to October. From 2000 to 2018, the duration of high NDVIm values tended to increase, and NDVIm in January to April, November, and December also showed an increasing trend.
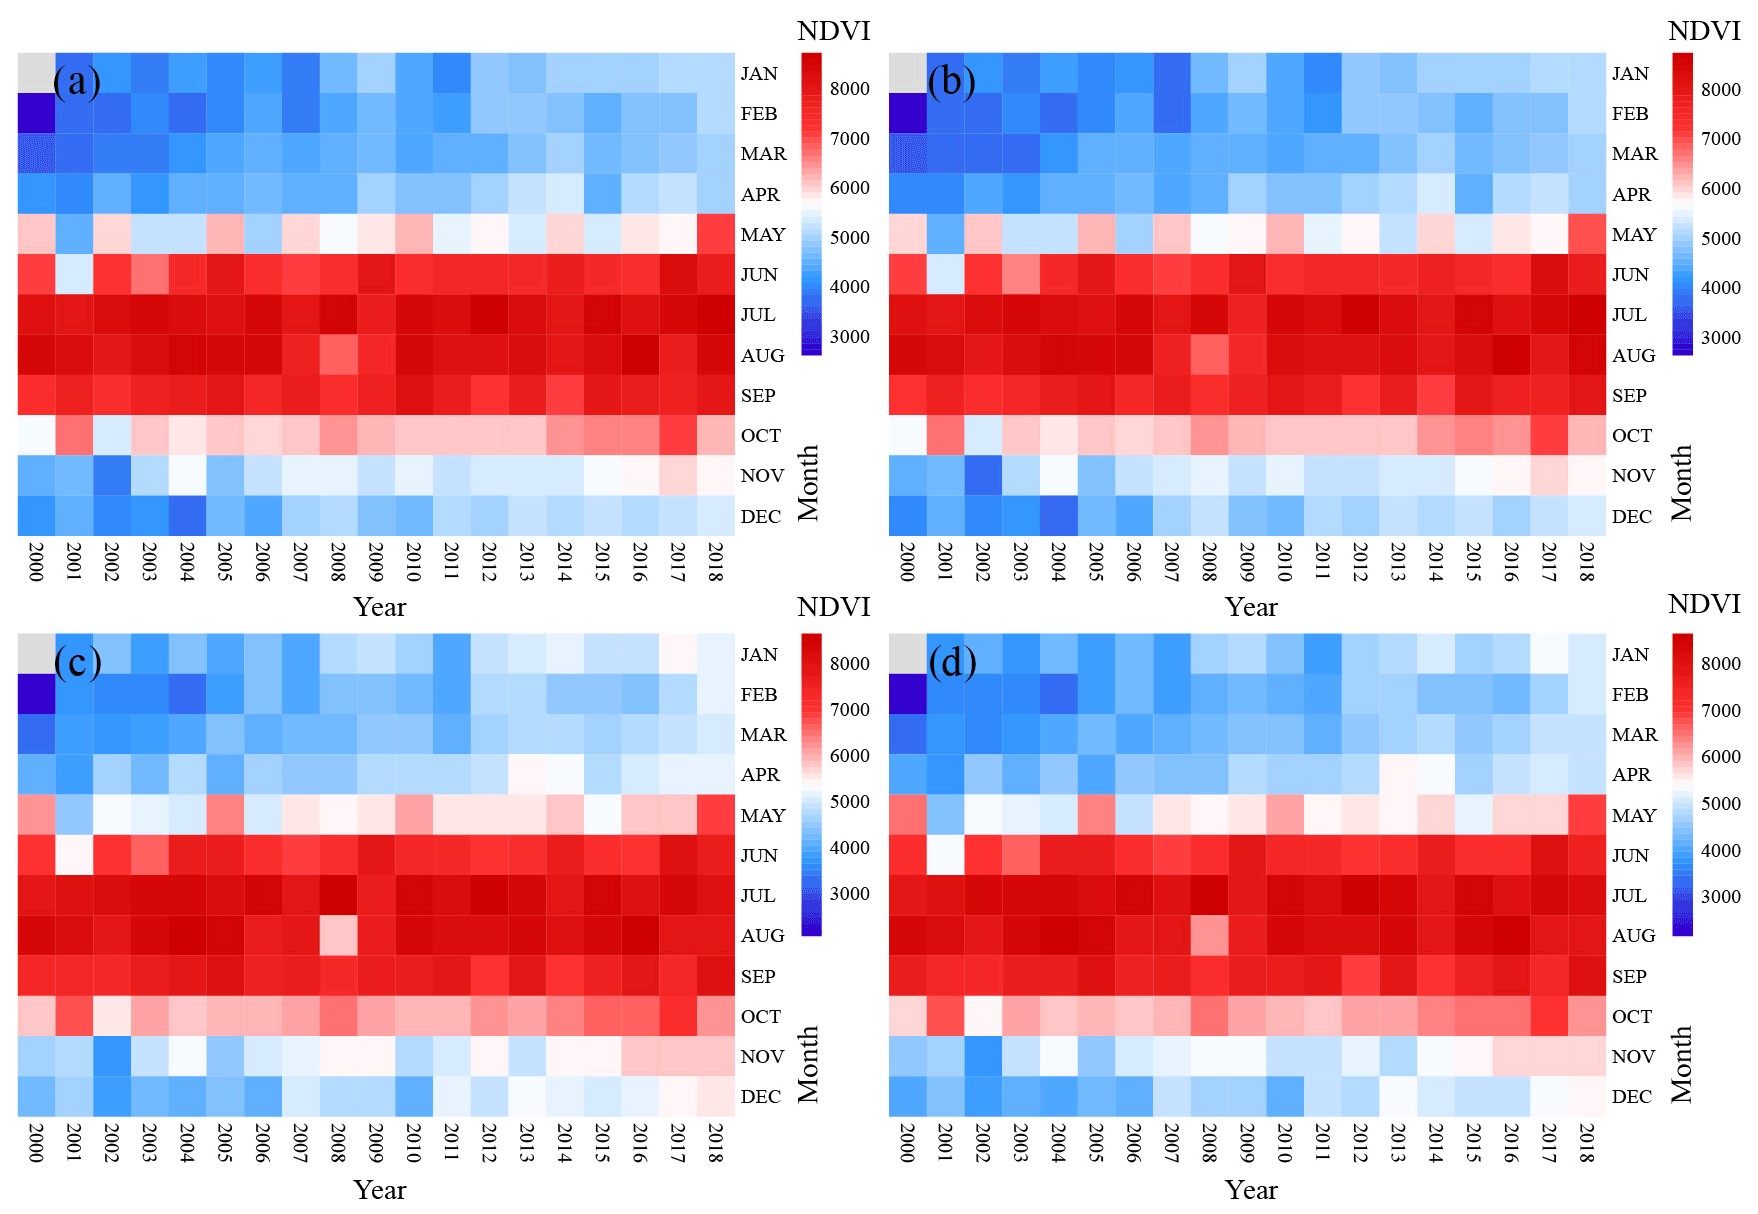
Figure 5The variations in monthly NDVI (NDVIm) in S1 (a), S2 (b), S3 (c), and S4 (d). The NDVIm record began in February 2000, and there were no data for January 2000. The value of NDVIm was magnified 10 000×.
3.3 Impacts of climate change on tree growth
To explore the main climatic factors affecting the growth of P. likiangensis plantations, the Pearson correlation between tree growth (BAI, NDVIa) and climatic factors was calculated. Figure 6 shows that for the four sampling sites, the results of the correlation analysis between BAI and climate factors showed a similar pattern to the results for NDVIa and climate factors. In most cases, both NDVIa and BAI showed the same positive or negative correlations with climate factors in the same months. However, the correlation between NDVIa and climate factors was not as significant as that between BAI and climate factors, and NDVIa was only significantly correlated with climate factors in a few months. Among the climate factors, BAI was significantly correlated (r>0.42, p<0.05) with PET in P_November (P_ represents the month of the previous year), P_December, February, November, and December. The average correlation coefficients were 0.519, 0.487, 0.451, 0.440, and 0.486, respectively. There was no significant correlation between PRE and BAI, except for S3 in P_November (, p<0.05). The scPDSI had the most significant impact on BAI in the study area. From P_May to December, BAI showed a significant correlation (r<−0.40, p<0.05) with scPDSI for 9 months, and the correlation coefficients of all months were negative. The highest average correlation coefficient was in P_July, and the average correlation coefficient was −0.489. In addition, BAI was significantly correlated (r>0.40, p<0.05) with TMN in P_July, P_September, July, and September, with average correlation coefficients of 0.434, 0.419, 0.533, and 0.451, respectively. BAI was significantly correlated (r>0.40, p<0.05) with TMX in P_October, P_December, and July, and the average correlation coefficients were 0.442, 0.408, and 0.457, respectively. There was a significant correlation (r>0.40, p<0.05) between TMP and BAI in P_July, P_December, and July, and the average correlation coefficients were 0.489, 0.417, and 0.567, respectively. The above analysis indicated that scPDSI was the most important climatic factor affecting the growth of P. likiangensis plantations.
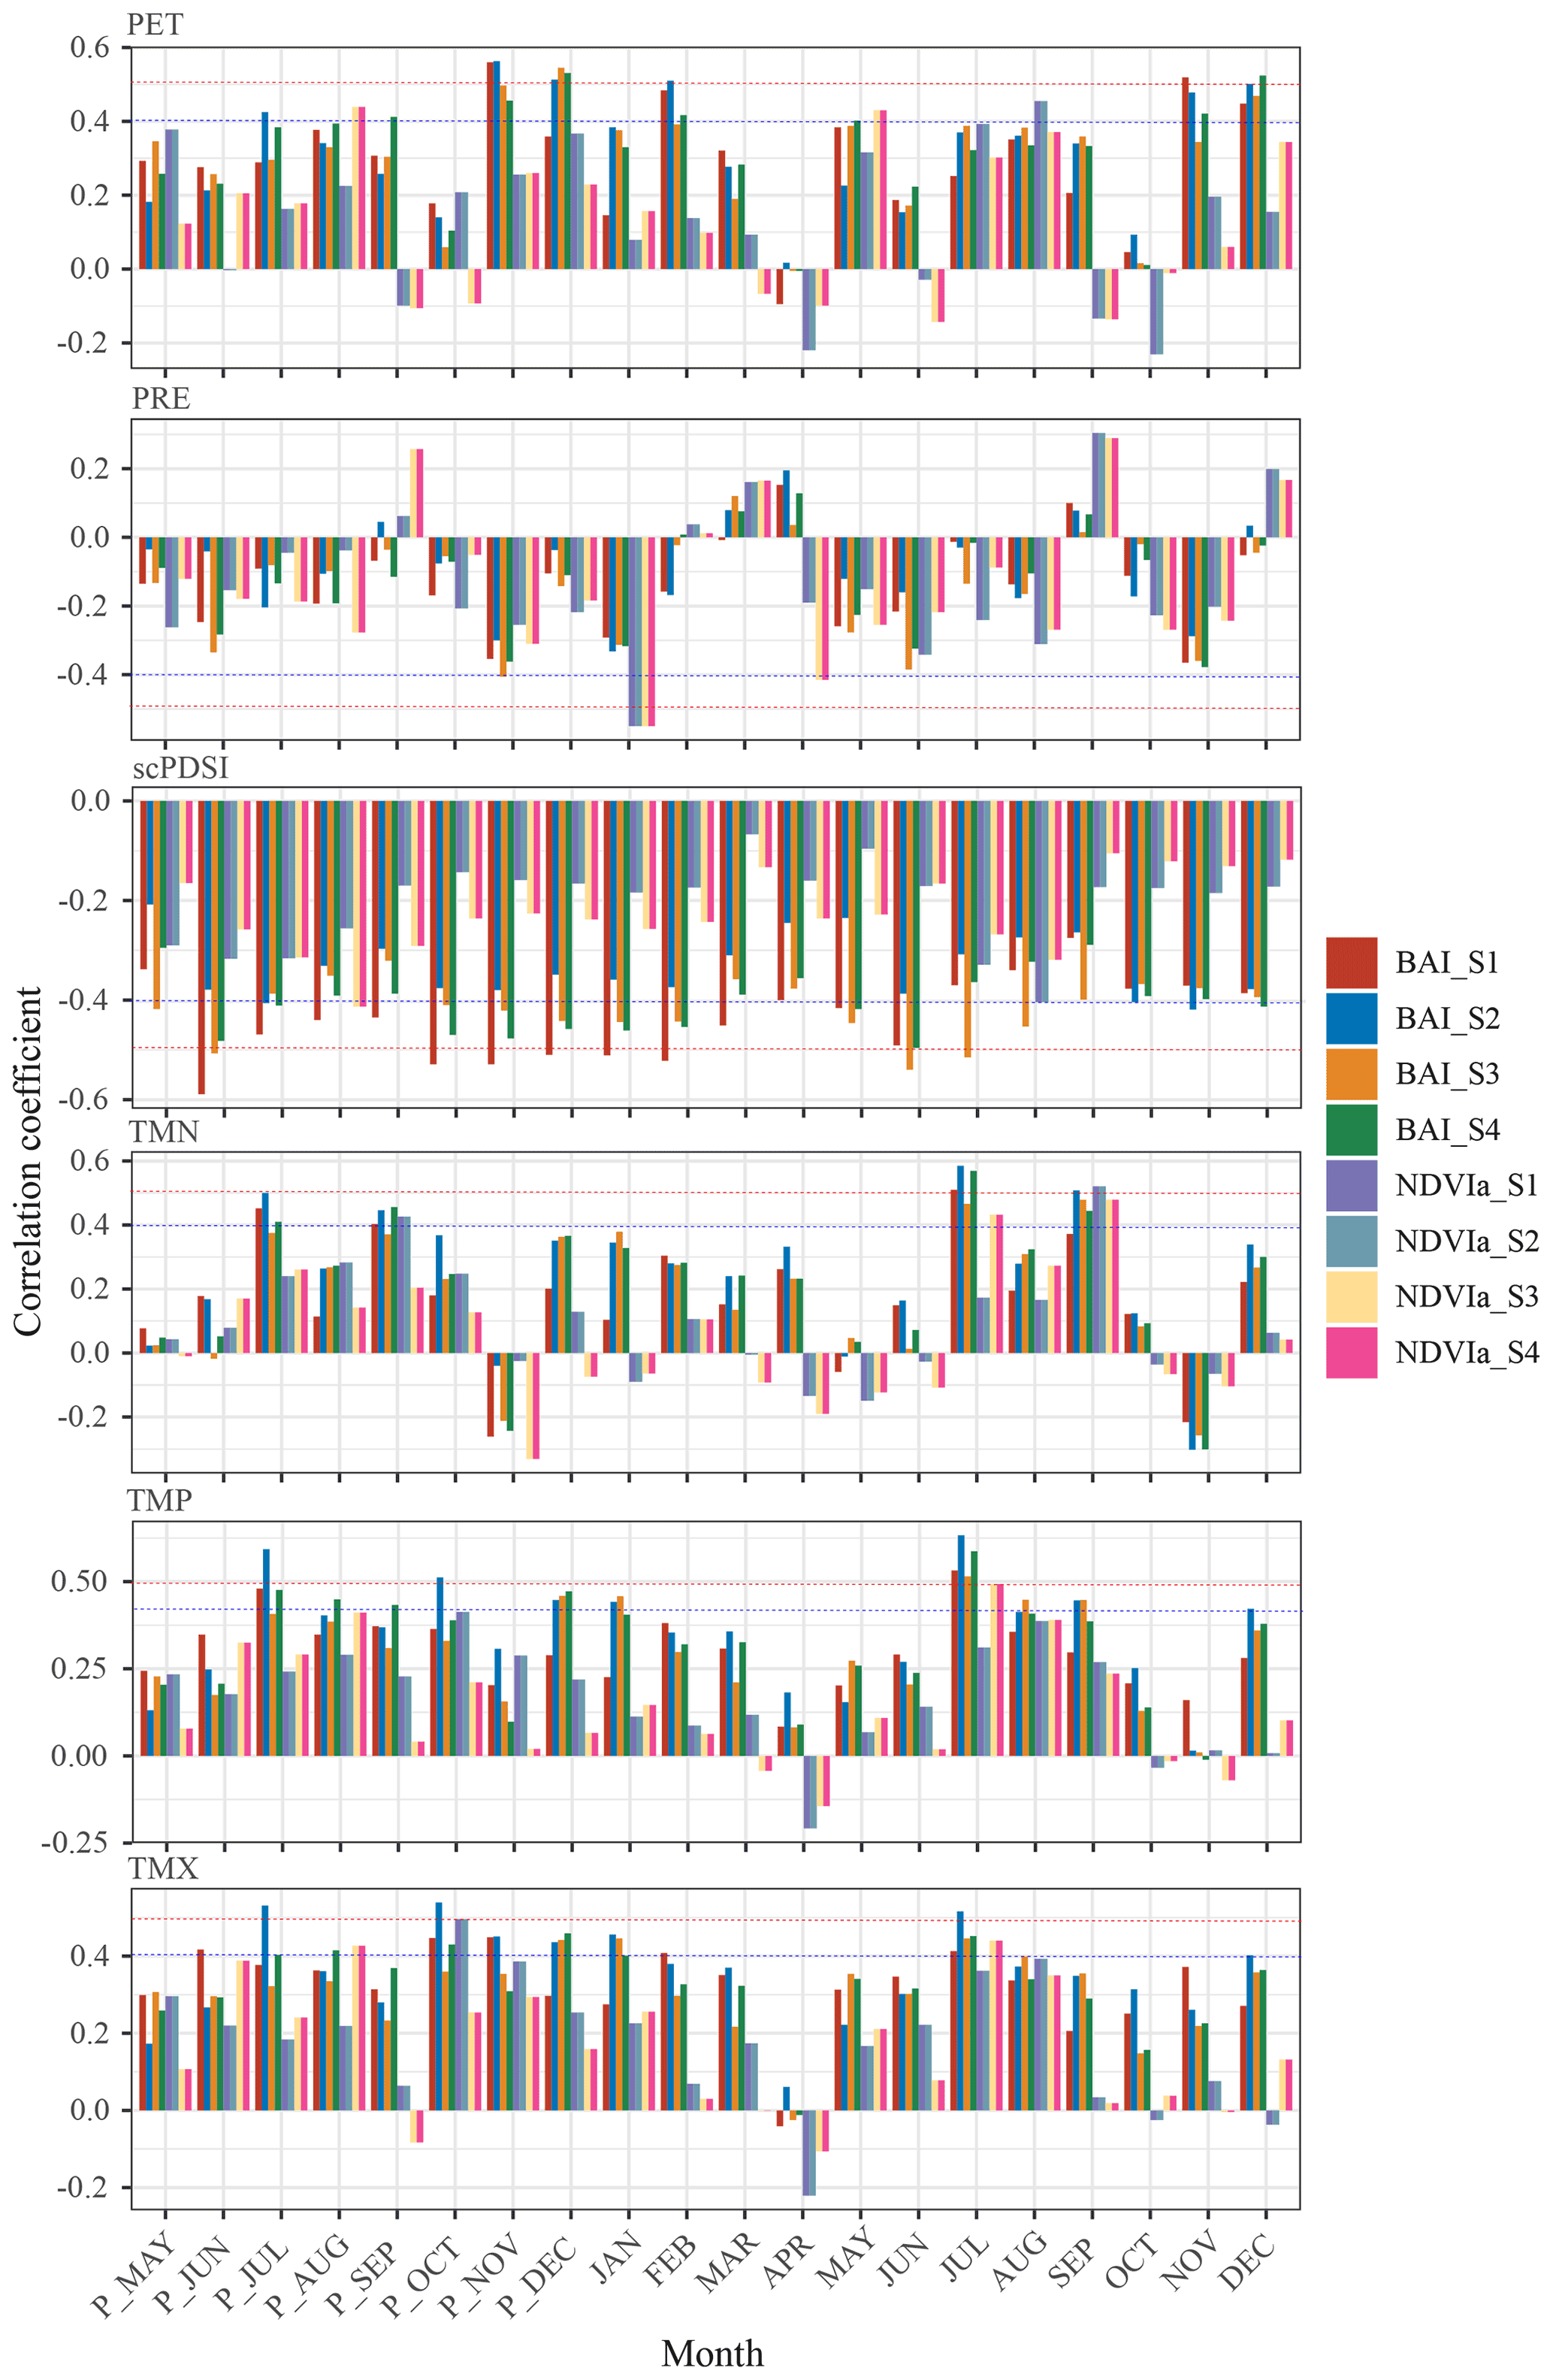
Figure 6Pearson correlation between tree growth (BAI, NDVIa) and PET, PRE, SCPDSI, TMN, TMX, and TMP at four sampling sites. “P_” represents the month of the previous year. The horizontal dotted blue and red lines represent 95 % and 99 % significant correlation levels, respectively. “BAI_*” indicates the BAI of each sampling site, and “NDVIa_*” indicates the NDVIa of each sampling site. BAI: basal area increment; NDVIa: annual NDVI; PET: potential evapotranspiration; PRE: precipitation rate; scPDSI: self-calibrated Palmer drought severity index; TMN: minimum 2 m temperature; TMX: maximum 2 m temperature; TMP: mean 2 m temperature.
3.4 Relationship between BAI and NDVI
To explore whether NDVI can replace BAI in monitoring tree growth, correlation analysis was used to study the correlation between BAI and NDVI, and the Pearson correlation coefficient was used to indicate the strength of the correlation (Fig. 7). The results showed that BAI was significantly correlated (r>0.47, p<0.05) with NDVIa and NDVIm for most months at the four sampling sites. There was a significant positive correlation between BAI and NDVIa (r>0.79, p<0.01), and the maximum correlation coefficient was 0.828. Except for May and July to September, NDVIm of other months was significantly correlated with BAI (r>0.47, p<0.05). The correlation between BAI and NDVIm in March was the best, with the highest average correlation coefficient (r=0.902, p<0.01), followed by February (r=0.853, p<0.01), January (r=0.812, p<0.01), April (r=0.805, p<0.01), December (r=0.7615, p<0.01), and November (r=0.722, p<0.01). The month with the worst correlation was August, and the correlation coefficient was close to zero, indicating that monthly NDVI in August has not correlated with tree-ring BAI.
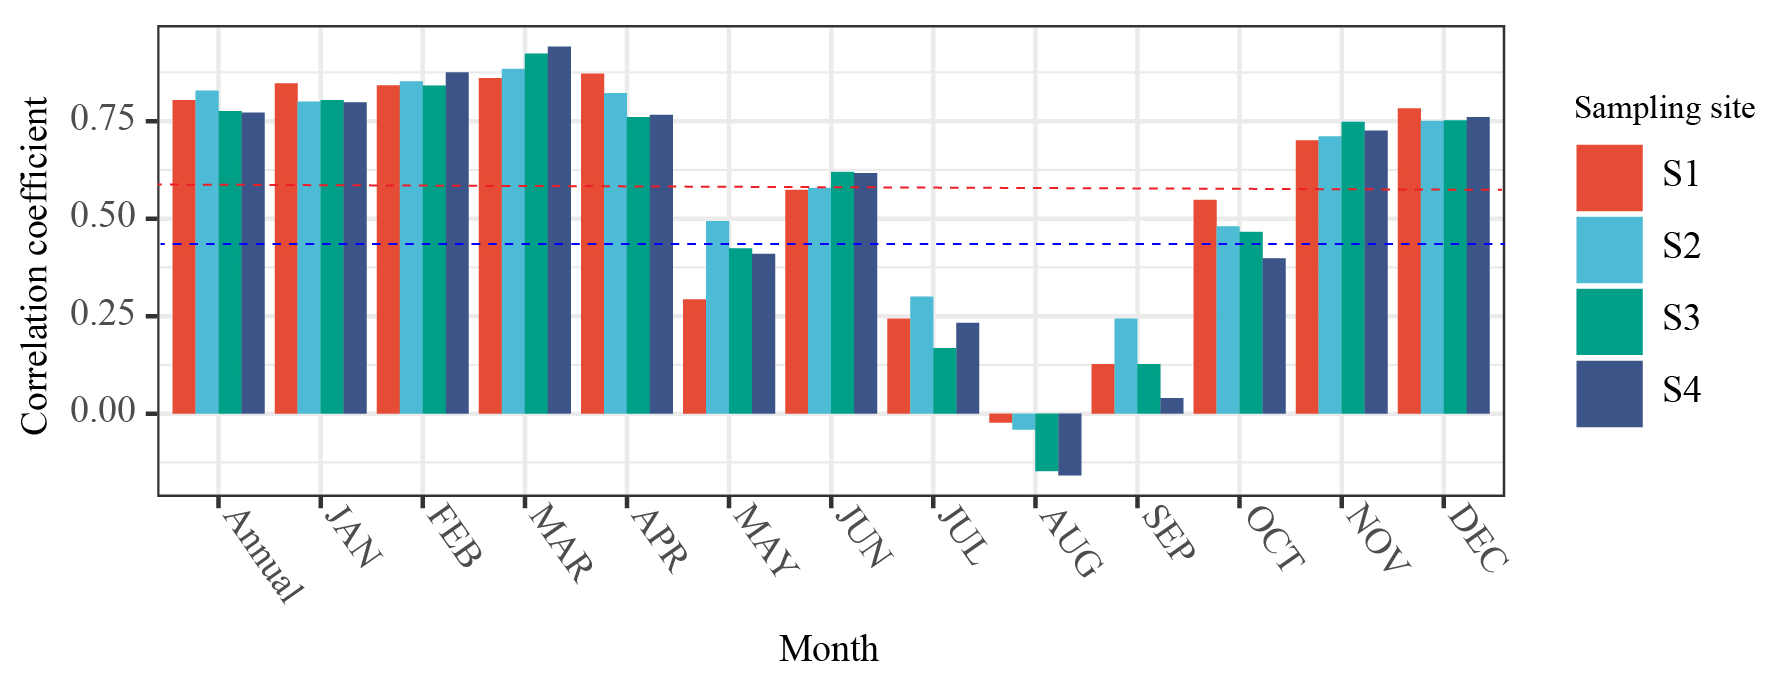
Figure 7Pearson correlations of basal area increment (BAI) with annual NDVI (NDVIa) and monthly NDVI (NDVIm). The NDVI data come from the grid cell nearest to each sample site. The horizontal dotted blue and red lines represent 95 % and 99 % significant correlation levels, respectively.
Our results indicate that the growth of P. likiangensis plantations on the ETP has increased significantly since the 1990s, with BAI increasing at rates of 300.21 to 451.04 mm2 per decade and annual NDVI increasing at rates of 0.055 to 0.057 per decade. Previous studies on dendrochronology and dendroclimatology on the ETP have focused on natural forests that are almost unaffected by human activities (Shi et al., 2019a; Li et al., 2017; Keyimu et al., 2020). Although P. likiangensis is one of the main afforestation species in this region, the P. likiangensis plantation has received less attention. According to CRU data (Fig. 4a), the average temperature in the study area increased significantly from 1990 to 2018. At high elevations such as the ETP, where forests are subject to strong temperature constraints, temperature effects are also more pronounced as temperature increases are expected to promote tree growth and vitality (Correa-Díaz et al., 2019). Therefore, the current climate warming will be conducive to the growth of P. likiangensis plantations.
Since the 1990s, the increase in tree-ring growth of P. likiangensis plantations has been closely related to climate change on the ETP. From 1990 to 2018, the temperature increased significantly in the study area, triggering tree cambium activity, xylem cell differentiation, and photosynthesis at high altitudes (Correa-Díaz et al., 2019; Li et al., 2017). The analysis results of monthly NDVI in the study area from 2000 to 2018 also found (Fig. 7) that the duration of high monthly NDVI values was increased in the four P. likiangensis plantations studied in our study area (high value of monthly NDVI was spreading to November and December; Fig. 5). The start time of the vegetation growing season was advanced, and the end time was delayed. The duration of the vegetation growing season becomes longer in this region. Many studies have shown that tree growth is closely related to the length of the growing season in high-altitude areas, and an extension of the growing season will accelerate tree growth (Gao et al., 2018; Jochner et al., 2018). In general, the warming trend promoted photosynthesis of P. likiangensis plantations and extended the length of the regional growing season.
According to the correlation analysis of BAI and climate factors, we found that P. likiangensis plantations are more sensitive to the response of hydraulic conditions because at high altitudes, the soil is usually shallow and coarse, making the trees more susceptible to water and nutrients (Correa-Díaz et al., 2019). The results showed that the potential evapotranspiration (PET) in winter and spring had a significant influence on the growth of P. likiangensis plantations. The temperature rise in winter and spring was the key to the increase in evapotranspiration (Anderegg et al., 2015); warm winter would lead to the early start of the next growing season, which reduces the probability of frost damage to trees (Astudillo-Sanchez et al., 2017). In addition, monthly precipitation (PRE) had little effect on the growth of P. likiangensis plantations in the study area, and the effect was almost negative. The scPDSI is an important limiting factor for the growth of P. likiangensis plantations. The growth of trees is mainly determined by the rate of photosynthesis (Liu et al., 2021). Wet means more cloudy or rainy weather in the region, which will harm the photosynthesis of vegetation (Tei and Sugimoto, 2018). Therefore, there is a general negative correlation between the growth of P. likiangensis plantations and scPDSI.
In terms of temperature, TMX had the most significant effect on the growth of the P. likiangensis plantation. This is similar to the conclusion of some previous studies that TMX has a regulatory effect on the growth of conifer species at high altitudes (Li et al., 2015; Keyimu – Märdan Keyum et al., 2020). The results showed that TMX had the most critical effect on plantation growth in spring (January). A higher spring TMX can not only promote tree growth and start xylem growth but also melt the permafrost to provide moisture for tree growth (Keyimu et al., 2020). In addition, TMX also had a significant effect on the growth of the P. likiangensis plantation in the study area in the summer (July). Summer is the season with the most concentrated rainfall in the study area. Insufficient precipitation and summer warmth can ensure a higher rate of photosynthesis and thus increase the accumulation of biomass.
We also found a general positive correlation between NDVI and P. likiangensis plantation growth in the study area, and the correlation between NDVI and BAI in most periods was significant. NDVI and tree growth are closely related to photosynthetic activity. When climate factors affect vegetation, they will influence the photosynthetic rate of plant leaves and thus control tree rings and NDVI (Liu et al., 2021). NDVI is a good proxy for forest net primary productivity (Vicente-Serrano et al., 2020), and a positive and significant relationship between NDVI and tree growth has been identified. However, August is a period of concentrated precipitation in the study area, and the quality of satellite imagery during this time is vulnerable to clouds and fog, which results in no significant correlation between BAI and NDVI in August. Therefore, we can use NDVI instead of the tree-ring method (BAI) to monitor the growth of P. likiangensis plantations in this area while ensuring the quality of satellite imagery and more convenience for forest management to provide advice. However, how NDVI responds to climate in these plantations needs to be further investigated.
In this study, dendroecology (BAI) and remote sensing (NDVI) were used to study the growth dynamics of P. likiangensis plantations on the ETP. In the past 29 years, P. likiangensis plantations in the study area showed similar growth patterns. Analyses of the relationship between BAI and climatic factors at four sampling sites showed that warming temperatures have accelerated the growth of P. likiangensis plantations since the 1990s. Correlation analysis between BAI and scPDSI showed that water availability is not conducive to the growth of P. likiangensis plantations. Water availability means more overcast and rainy days, which reduces the efficiency of photosynthesis. In most periods, the BAI was positively correlated with NDVI, suggesting that the NDVI can be used as an indicator for BAI in future studies to help forest managers quickly understand how the plantation will respond to future climate change.
The “ggplot2” package is available at https://cran.hafro.is/web/packages/ggplot2/index.html (Wickham, 2016).
Meteorological station data are downloaded from https://www.resdc.cn/data.aspx?DATAID=230 (Resource and Environmental Sciences and Data Centre, 2020). MOD13A3 data are downloaded from http://modis.gsfc.nasa.gov (NASA, 2021). The annual NDVIs are available at https://doi.org/10.12078/2018060601 (Xu, 2018). CRU TS 4.04 data are downloaded from https://sites.uea.ac.uk/cru/data (Climatic Research Unit, 2020).
YF and SS conceived and designed the experiments, performed the experiments, analyzed the data, prepared figures and/or tables, and approved the final draft. PP and HW conceived and designed the experiments, analyzed the data, prepared figures and/or tables, and approved the final draft. QZ and XL performed the experiments, analyzed the data, and approved the final draft.
The contact author has declared that none of the authors has any competing interests.
Publisher's note: Copernicus Publications remains neutral with regard to jurisdictional claims in published maps and institutional affiliations.
We thank the openbiox community and Hiplot team (https://hiplot.com.cn/basic?lang=en, last access: 21 May 2022) for providing technical assistance and valuable tools for data analysis and visualization. This research was funded by the National Key Research and Development Program of China, grant number 2017YFC0505001.
This research has been supported by the National Key Research and Development Program of China (grant no. 2017YFC0505001).
This paper was edited by Jutta Stadler and reviewed by two anonymous referees.
Anderegg, W., Flint, A., Huang, C.-y., Flint, L., Berry, J., Davis, F., Sperry, J., and Field, C.: Tree mortality predicted from drought-induced vascular damage, Nat. Geosci., 8, 367–371, https://doi.org/10.1038/NGEO2400, 2015.
Anderegg, W. R. L., Kane, J. M., and Anderegg, L. D. L.: Consequences of widespread tree mortality triggered by drought and temperature stress, Nat. Clim. Change, 3, 30–36, https://doi.org/10.1038/nclimate1635, 2012.
Astudillo-Sanchez, C., Villanueva-Díaz, J., Agramont, A., Nava-Bernal, G., and Gómez Albores, M.: Climatic variability at the treeline of Monte Tlaloc, Mexico: a dendrochronological approach, Trees, 31, 441–453, https://doi.org/10.1007/s00468-016-1460-z, 2017.
Bhuyan, U., Zang, C., Vicente-Serrano, S., and Menzel, A.: Exploring Relationships among Tree-Ring Growth, Climate Variability, and Seasonal Leaf Activity on Varying Timescales and Spatial Resolutions, Remote Sens., 9, e526, https://doi.org/10.3390/rs9060526, 2017.
Bousquet, P.: Regional Changes in Carbon Dioxide Fluxes of Land and Oceans Since 1980, Science, 290, 1342–1346, https://doi.org/10.1126/science.290.5495.1342, 2000.
Brehaut, L. and Danby, R. K.: Inconsistent relationships between annual tree ring-widths and satellite-measured NDVI in a mountainous subarctic environment, Ecol. Indic., 91, 698–711, https://doi.org/10.1016/j.ecolind.2018.04.052, 2018.
Brown, M. E., Pinzon, J. E., Didan, K., Morisette, J. T., and Tucker, C. J.: Evaluation of the consistency of long-term NDVI time series derived from AVHRR,SPOT-vegetation, SeaWiFS, MODIS, and Landsat ETM+ sensors, IEEE T. Geosci. Remote, 44, 1787–1793, https://doi.org/10.1109/tgrs.2005.860205, 2006.
Bunn, A. G.: A dendrochronology program library in R (dplR), Dendrochronologia, 26, 115–124, https://doi.org/10.1016/j.dendro.2008.01.002, 2008.
Bunn, A. G.: Statistical and visual crossdating in R using the dplR library, Dendrochronologia, 28, 251–258, https://doi.org/10.1016/j.dendro.2009.12.001, 2010.
Camarero, J. J., Albuixech, J., López-Lozano, R., Casterad, M. A., and Montserrat-Martí, G.: An increase in canopy cover leads to masting in Quercus ilex, Trees, 24, 909–918, https://doi.org/10.1007/s00468-010-0462-5, 2010.
Chen, L., Huang, J.-G., Stadt, K. J., Comeau, P. G., Zhai, L., Dawson, A., and Alam, S. A.: Drought explains variation in the radial growth of white spruce in western Canada, Agr. Forest Meteorol., 233, 133–142, https://doi.org/10.1016/j.agrformet.2016.11.012, 2017.
Climatic Research Unit (CRU): CRU TS 4.04, UEA [data set], https://sites.uea.ac.uk/cru/data, last access: 20 December 2020.
Correa-Díaz, A., Silva, L. C. R., Horwath, W. R., Gómez-Guerrero, A., Vargas-Hernández, J., Villanueva-Díaz, J., Velázquez-Martínez, A., and Suárez-Espinoza, J.: Linking Remote Sensing and Dendrochronology to Quantify Climate-Induced Shifts in High-Elevation Forests Over Space and Time, J. Geophys. Res.-Biogeo., 124, 166–183, https://doi.org/10.1029/2018jg004687, 2019.
Coulthard, B. L., Touchan, R., Anchukaitis, K. J., Meko, D. M., and Sivrikaya, F.: Tree growth and vegetation activity at the ecosystem-scale in the eastern Mediterranean, Environ. Res. Lett., 12, e084008, https://doi.org/10.1088/1748-9326/aa7b26, 2017.
Dorman, M., Svoray, T., Perevolotsky, A., Moshe, Y., and Sarris, D.: What determines tree mortality in dry environments? A multi-perspective approach, Ecol. Appl., 25, 1054–1071, https://doi.org/10.1890/14-0698.1, 2015.
Gao, L., Gou, X., Deng, Y., Wang, Z., Gu, F., and Wang, F.: Increased growth of Qinghai spruce in northwestern China during the recent warming hiatus, Agr. Forest Meteorol., 260–261, 9–16, https://doi.org/10.1016/j.agrformet.2018.05.025, 2018.
Girardin, M. P., Bouriaud, O., Hogg, E. H., Kurz, W., Zimmermann, N. E., Metsaranta, J. M., de Jong, R., Frank, D. C., Esper, J., Buntgen, U., Guo, X. J., and Bhatti, J.: No growth stimulation of Canada's boreal forest under half-century of combined warming and CO2 fertilization, P. Natl. Acad. Sci. USA, 113, E8406–E8414, https://doi.org/10.1073/pnas.1610156113, 2016.
Goetz, S. J., Bunn, A. G., Fiske, G. J., and Houghton, R. A.: Satellite-observed photosynthetic trends across boreal North America associated with climate and fire disturbance, P. Natl. Acad. Sci. USA, 102, 13521–13525, https://doi.org/10.1073/pnas.0506179102, 2005.
Grissino-Mayer, H. D.: Evaluating Crossdating Accuracy: A Manual and Tutorial for the Computer Program COFECHA, Tree-Ring Res., 57, 205–221, https://doi.org/10150/251654, 2001.
Harris, I., Osborn, T. J., Jones, P., and Lister, D.: Version 4 of the CRU TS monthly high-resolution gridded multivariate climate dataset, Scientific Data, 7, e109, https://doi.org/10.1038/s41597-020-0453-3, 2020.
Hashimoto, H., Melton, F., Ichii, K., Cristina, M., Wang, W., and Nemani, R.: Evaluating the impacts of climate and elevated carbon dioxide on tropical rainforests of the western Amazon basin using ecosystem models and satellite data, Glob. Change Biol., 16, 255–271, https://doi.org/10.1111/j.1365-2486.2009.01921.x, 2009.
Hogg, E. H., Michaelian, M., Hook, T. I., and Undershultz, M. E.: Recent climatic drying leads to age-independent growth reductions of white spruce stands in western Canada, Glob. Change Biol., 23, 5297–5308, https://doi.org/10.1111/gcb.13795, 2017.
Jochner, M., Bugmann, H., Nötzli, M., and Bigler, C.: Tree growth responses to changing temperatures across space and time: a fine-scale analysis at the treeline in the Swiss Alps, Trees, 32, 645–660, https://doi.org/10.1007/s00468-017-1648-x, 2018.
Keyimu, M., Li, Z., Zhang, G., Fan, Z.-X., Wang, X., and Fu, B.-J.: Tree ring–based minimum temperature reconstruction in the central Hengduan Mountains, China, Theor. Appl. Climatol., 141, 359–370, https://doi.org/10.1007/s00704-020-03169-5, 2020.
Keyimu, M., Li, Z., Wu, X., Fu, B., Liu, G., Shi, S., Fan, Z., and Wang, X.: Recent decline of high altitude coniferous growth due to thermo-hydraulic constrains: evidence from the Miyaluo Forest Reserve, Western Sichuan Plateau of China, Dendrochronologia, 63, e125751, https://doi.org/10.1016/j.dendro.2020.125751, 2020.
Lambert, J., Drenou, C., Denux, J.-P., Balent, G., and Cheret, V.: Monitoring forest decline through remote sensing time series analysis, Gisci. Remote Sens., 50, 437–457, https://doi.org/10.1080/15481603.2013.820070, 2013.
Li, X., Liang, E., Gričar, J., Rossi, S., Čufar, K., and Ellison, A. M.: Critical minimum temperature limits xylogenesis and maintains treelines on the southeastern Tibetan Plateau, Sci. Bull., 62, 804–812, https://doi.org/10.1016/j.scib.2017.04.025, 2017.
Li, Z. S., Liu, G. H., Gong, L., Wang, M., and Wang, X. C.: Tree ring-based temperature reconstruction over the past 186 years for the Miyaluo Natural Reserve, western Sichuan Province of China, Theor. Appl. Climatol., 120, 495–506, https://doi.org/10.1007/s00704-014-1184-1, 2015.
Lindner, M., Maroschek, M., Netherer, S., Kremer, A., Barbati, A., Garcia-Gonzalo, J., Seidl, R., Delzon, S., Corona, P., Kolström, M., Lexer, M. J., and Marchetti, M.: Climate change impacts, adaptive capacity, and vulnerability of European forest ecosystems, Forest Ecol. Manag., 259, 698–709, https://doi.org/10.1016/j.foreco.2009.09.023, 2010.
Liu, R., Song, Y., Liu, Y., Li, X., Song, H., Sun, C., Li, Q., Cai, Q., Ren, M., and Wang, L.: Changes in the Tree-Ring Width-Derived Cumulative Normalized Difference Vegetation Index over Northeast China during 1825 to 2013 CE, Forests, 12, e241, https://doi.org/10.3390/f12020241, 2021.
McMahon, S. M., Parker, G. G., and Miller, D. R.: Evidence for a recent increase in forest growth, P. Natl. Acad. Sci. USA, 107, 3611–3615, https://doi.org/10.1073/pnas.0912376107, 2010.
Mou, Y.-M., Fang, O., Cheng, X., and Qiu, H.: Recent tree growth decline unprecedented over the last four centuries in a Tibetan juniper forest, J. Forestry., 30, 1429–1436, https://doi.org/10.1007/s11676-018-0856-6, 2019.
NASA: MOD13A3, NASA [data set], http://modis.gsfc.nasa.gov, last access: 17 May 2021.
Nikolaev, A. N., Fedorov, P. P., and Desyatkin, A. R.: Influence of climate and soil hydrothermal regime on radial growth of Larix cajanderi and Pinus sylvestris in Central Yakutia, Russia, Scand. J. Forest Res., 24, 217–226, https://doi.org/10.1080/02827580902971181, 2009.
Pettorelli, N., Vik, J. O., Mysterud, A., Gaillard, J.-M., Tucker, C. J., and Stenseth, N. C.: Using the satellite-derived NDVI to assess ecological responses to environmental change, Trends Ecol. Evol., 20, 503–510, https://doi.org/10.1016/j.tree.2005.05.011, 2005.
Pretzsch, H., Biber, P., Schütze, G., Uhl, E., and Rötzer, T.: Forest stand growth dynamics in Central Europe have accelerated since 1870, Nat. Commun., 5, e4967, https://doi.org/10.1038/ncomms5967, 2014.
Resource and Environmental Sciences and Data Centre: Daily dataset of meteorological element station observations in China, RESDC [data set], https://www.resdc.cn/data.aspx?DATAID=230, last access: 13 February 2020.
Running, S. W., Thornton, P. E., Nemani, R., and Glassy, J. M.: Global Terrestrial Gross and Net Primary Productivity from the Earth Observing System, in: Methods in Ecosystem Science, edited by: Sala, O. E., Jackson, R. B., Mooney, H. A., and Howarth, R. W., Springer New York, New York, NY, USA, 44–57, https://doi.org/10.1007/978-1-4612-1224-9_4, 2000.
Seftigen, K., Frank, D. C., Björklund, J., Babst, F., and Poulter, B.: The climatic drivers of normalized difference vegetation index and tree-ring-based estimates of forest productivity are spatially coherent but temporally decoupled in Northern Hemispheric forests, Global Ecol. Biogeogr., 27, 1352–1365, https://doi.org/10.1111/geb.12802, 2018.
Shestakova, T. A., Gutierrez, E., Kirdyanov, A. V., Camarero, J. J., Genova, M., Knorre, A. A., Linares, J. C., Resco de Dios, V., Sanchez-Salguero, R., and Voltas, J.: Forests synchronize their growth in contrasting Eurasian regions in response to climate warming, P. Natl. Acad. Sci. USA, 113, 662–667, https://doi.org/10.1073/pnas.1514717113, 2016.
Shi, C., Shen, M., Wu, X., Cheng, X., Li, X., Fan, T., Li, Z., Zhang, Y., Fan, Z., Shi, F., and Wu, G.: Growth response of alpine treeline forests to a warmer and drier climate on the southeastern Tibetan Plateau, Agr. Forest Meteorol., 264, 73–79, 2019a.
Shi, F., Wu, X., Li, X., Wang, P., Yang, X., Li, Y., Jiang, X., Pei, T., Bai, Y., Hao, B., Zhang, C., and Tong, Y.: Seasonal Divergent Tree Growth Trends and Growth Variability along Drought Gradient over Northeastern China, Forests, 10, e39, https://doi.org/10.3390/f10010039, 2019b.
St. George, S.: An overview of tree-ring width records across the Northern Hemisphere, Quaternary Sci. Rev., 95, 132–150, https://doi.org/10.1016/j.quascirev.2014.04.029, 2014.
Stokes, M. A. and Smiley, T. L.: An Introduction to Tree-Ring Dating, University of Arizona Press, Arizona, USA, ISBN 9780816516803, 1968.
Sun, C., Liu, Y., Song, H., Li, Q., Cai, Q., Wang, L., Fang, C., and Liu, R.: Tree-ring evidence of the impacts of climate change and agricultural cultivation on vegetation coverage in the upper reaches of the Weihe River, northwest China, Sci. Total Environ., 707, e136160, https://doi.org/10.1016/j.scitotenv.2019.136160, 2020.
Tei, S. and Sugimoto, A.: Time lag and negative responses of forest greenness and tree growth to warming over circumboreal forests, Glob. Change Biol., 24, 4225–4237, https://doi.org/10.1111/gcb.14135, 2018.
Tei, S., Sugimoto, A., Yonenobu, H., Matsuura, Y., Osawa, A., Sato, H., Fujinuma, J., and Maximov, T.: Tree-ring analysis and modeling approaches yield contrary response of circumboreal forest productivity to climate change, Glob. Change Biol., 23, 5179–5188, https://doi.org/10.1111/gcb.13780, 2017.
van Breugel, M., Ransijn, J., Craven, D., Bongers, F., and Hall, J. S.: Estimating carbon stock in secondary forests: Decisions and uncertainties associated with allometric biomass models, Forest Ecol. Manag., 262, 1648–1657, https://doi.org/10.1016/j.foreco.2011.07.018, 2011.
Van Der Schrier, G., Barichivich, J., Briffa, K. R., and Jones, P. D.: A scPDSI-based global data set of dry and wet spells for 1901–2009, J. Geophys. Res.-Atmos., 118, 4025–4048, https://doi.org/10.1002/jgrd.50355, 2013.
Vicente-Serrano, S. M., Camarero, J. J., Olano, J. M., Martín-Hernández, N., Peña-Gallardo, M., Tomás-Burguera, M., Gazol, A., Azorin-Molina, C., Bhuyan, U., and El Kenawy, A.: Diverse relationships between forest growth and the Normalized Difference Vegetation Index at a global scale, Remote Sens. Environ., 187, 14–29, https://doi.org/10.1016/j.rse.2016.10.001, 2016.
Vicente-Serrano, S. M., Martín-Hernández, N., Camarero, J. J., Gazol, A., Sánchez-Salguero, R., Peña-Gallardo, M., El Kenawy, A., Domínguez-Castro, F., Tomas-Burguera, M., Gutiérrez, E., de Luis, M., Sangüesa-Barreda, G., Novak, K., Rozas, V., Tíscar, P. A., Linares, J. C., del Castillo, E. M., Ribas, M., García-González, I., Silla, F., Camisón, A., Génova, M., Olano, J. M., Longares, L. A., Hevia, A., and Diego Galván, J.: Linking tree-ring growth and satellite-derived gross primary growth in multiple forest biomes. Temporal-scale matters, Ecol. Indic., 108, e105753, https://doi.org/10.1016/j.ecolind.2019.105753, 2020.
Wang, Z., Liu, C., and Huete, A.: From AVHRR-NDVI to MODIS-EVI: Advances in vegetation index research, Acta Ecologica Sinica, 23, 979–987, 2003.
Wang, Z., Lyu, L., Liu, W., Liang, H., Huang, J., and Zhang, Q.-B.: Topographic patterns of forest decline as detected from tree rings and NDVI, Catena, 198, e105011, https://doi.org/10.1016/j.catena.2020.105011, 2021.
Wickham, H.: ggplot2, https://doi.org/10.1007/978-3-319-24277-4, data available at: Elegant Graphics for Data Analysis, Springer New York, New York, USA, hafro [code], https://cran.hafro.is/web/packages/ggplot2/index.html (last access: 17 October 2021), 2016.
Williams, A. P., Allen, C. D., Millar, C. I., Swetnam, T. W., Michaelsen, J., Still, C. J., and Leavitt, S. W.: Forest responses to increasing aridity and warmth in the southwestern United States, P. Natl. Acad. Sci. USA, 107, 21289–21294, https://doi.org/10.1073/pnas.0914211107, 2010.
Worrall, J. J., Rehfeldt, G. E., Hamann, A., Hogg, E. H., Marchetti, S. B., Michaelian, M., and Gray, L. K.: Recent declines of Populus tremuloides in North America linked to climate, Forest Ecol. Manag., 299, 35–51, https://doi.org/10.1016/j.foreco.2012.12.033, 2013.
Xu, P., Zhou, T., Yi, C., Fang, W., Hendrey, G., and Zhao, X.: Forest drought resistance distinguished by canopy height, Environ. Res. Lett., 13, e075033, https://doi.org/10.1088/1748-9326/aacadd, 2018.
Xu, P., Fang, W., Zhou, T., Zhao, X., Luo, H., Hendrey, G., and Yi, C.: Spatial Upscaling of Tree-Ring-Based Forest Response to Drought with Satellite Data, Remote Sens., 11, 2344, https://doi.org/10.3390/rs11202344, 2019.
Xu, X.: Spatial distribution dataset of annual vegetation index (NDVI) in China, Data Registration and Publication System of Data Center for Resources and Environmental Sciences, Chinese Academy of Sciences [data set], https://doi.org/10.12078/2018060601, 2018.
Zhang, G., Kang, Y., Han, G., and Sakurai, K.: Effect of climate change over the past half century on the distribution, extent and NPP of ecosystems of Inner Mongolia, Glob. Change Biol., 17, 377–389, https://doi.org/10.1111/j.1365-2486.2010.02237.x, 2011.
Zhang, Y., Gao, J., Liu, L., Wang, Z., Ding, M., and Yang, X.: NDVI-based vegetation changes and their responses to climate change from 1982 to 2011: A case study in the Koshi River Basin in the middle Himalayas, Glob. Planet. Change, 108, 139–148, https://doi.org/10.1016/j.gloplacha.2013.06.012, 2013.
Zheng, K., Wei, J. Z., Pei, J. Y., Cheng, H., Zhang, X. L., Huang, F. Q., Li, F. M., and Ye, J. S.: Impacts of climate change and human activities on grassland vegetation variation in the Chinese Loess Plateau, Sci. Total Environ., 660, 236–244, https://doi.org/10.1016/j.scitotenv.2019.01.022, 2019.
Zhou, Y., Yi, Y., Jia, W., Cai, Y., Yang, W., and Li, Z.: Applying dendrochronology and remote sensing to explore climate-drive in montane forests over space and time, Quaternary Sci. Rev., 237, e106292, https://doi.org/10.1016/j.quascirev.2020.106292, 2020.