the Creative Commons Attribution 4.0 License.
the Creative Commons Attribution 4.0 License.
 | 03 Feb 2023
Spatio-temporal patterns of co-occurrence of tigers and leopards within a protected area in central India
Anindita Bidisha Chatterjee
Kalyansundaram Sankar
Yadvendradev Vikramsinh Jhala
Qamar Qureshi
The global decline of large carnivore populations warrants scientific insights into intraguild relationships. Patterns of co-occurrence among sympatric predators are governed by their density, distribution, diet, activity overlaps, and behavioural strategies. Tigers are sympatric with leopards across their distribution range, overlap substantially in their diet, and are both nocturnal. The subdominant leopard is believed to coexist with tigers via several mechanisms like spatial segregation, temporal avoidance, and differential prey selection. Investigation of spatio-temporal patterns of co-occurrence of tigers and leopards can provide insights on mechanisms that permit coexistence. We used camera trap-based photo captures of tigers and leopards in prey-rich (58.15±10.61 ungulates per km2) Pench Tiger Reserve to determine their spatio-temporal patterns of co-occurrence. Spatially explicit density estimates of tigers were approximately 5 per 100 km2 and leopards were approximately 4.5 per 100 km2 and remained stable over the years. This implies that both these co-predators are likely to attain carrying capacity within the study area. Areas with high tiger density had lower leopard density. Quantile regression analysis between tiger and leopard density at 2×2 km grid showed that leopard density had a parabolic relationship with tiger density, initially increasing with tigers (β=0.393; p=0.001), stable at medium tiger density (β=0.13 and p=0.15), and declining at high tiger densities ( and p<0.001). Both tigers and leopards were crepuscular in nature with no temporal segregation (Δ=89 %). Time lag of consecutive leopard photograph after a tiger capture ranged between 0.002 to 36.29 d. Leopard use of trails was not related to use by tigers. Our results suggest that leopards adjust their usage of space at fine scales to avoid confrontations with tigers. We also observed high temporal overlap and no spatio-temporal segregation between tigers and leopards, despite the two predators being nocturnal and having similar prey choices. The availability of ample prey within the study area is likely to be the driving factor of the co-occurrence of tigers and leopards within this dry deciduous habitat of central India.
- Article
(5395 KB) - Full-text XML
- BibTeX
- EndNote


Large carnivores at the apex of the trophic pyramid inherently occur at low densities, compete with human interests, and are therefore one of the most difficult taxa to conserve (Cardillo et al., 2004; Ripple et al., 2014). Large carnivores play a crucial role in structuring ecosystems and form an important element of intact functional systems (Linnell and Strand, 2000; Ripple et al., 2001; Durant et al., 2010). Populations of many large carnivores are restricted to protected areas (PAs) that are of limited size (Jhala et al., 2020). On an average, the PAs of India which harbour approximately 70 % of the world's extant tiger population (Jhala et al., 2015) have a size of 393 km2 embedded in a matrix of human-dominated land-use pattern (Bisht et al., 2019). Consequently, few parks have demographically viable carnivore populations (Jhala et al., 2020), but high prey densities within the PAs have enabled to harbour high densities of large- and medium-bodied predators (Bisht et al., 2019). However, inter-carnivore interactions can further become a limiting factor for their survival (Creel, 2001; Caro and Stoner, 2003; Durant et al., 2010). In multi-large carnivore systems, understanding of mechanisms that permit their coexistence among competing carnivores in time and space (Miller et al., 2018) is essential for understanding the population dynamics of the target species and the factors which influence the same (Estes et al., 2011; Wilman et al., 2014; Di Minin et al., 2016).
Species assemblage in a system is governed by niche partitioning between different species (Begon et al., 1990; Mayhew 2006). Different factors such as habitat requirements, body size, behavioural adaptations, and density determine the way interspecific interactions will take place among sympatric species (Thompson, 1988). Interspecific interactions, in turn, influence population growth rate and species distribution range (Svenning et al., 2014). Different types of interspecific interactions among competing predators can range from coexistence to intraguild killing. Coexistence between competing predators can be achieved by differential usage of non-limiting resources, e.g. preferential predation of deer and young elk by coyotes in the presence of wolves (Paquet, 1992) and predation of prey of poorer health condition by leopards in the presence of tigers (Majumder et al., 2013). Behavioural adaptations like segregation on a spatial scale, e.g. spatial avoidance of coyotes by red foxes (Voigt and Earle, 1983), and temporal and/or spatio-temporal segregation also facilitate amongst interacting carnivores (Kozlowski et al., 2008; Vanak et al., 2013). In the human-dominated landscape of Chitwan, Nepal, tigers and leopards were seen to co-occur by segregating spatially, whereas their temporal overlap was high (Lamichhane et al., 2019). Another study in Chitwan, Nepal, found tiger density to be high in prey-rich areas which also showed lower occupancy of leopards (Kafley et al., 2019). In the absence of the top predator, tigers, in Kuiburi National Park, Thailand, the distribution of subdominant predators, which are leopards and dholes, was primarily governed by prey availability (Steinmetz et al., 2013). The subdominant species has been observed to coexist with the dominant one by investing more energy, including residing in inferior quality habitat or travelling more in the African continent (Caro and Stoner, 2003). Coexistence between clouded leopards and marbled cats was achieved by temporal segregation in Dampa Tiger Reserve, India (Singh and Macdonald, 2017). Diel activity patterns of predators are governed not only by co-predators, but also the activity patterns of prey. While on one hand prey attempt to reduce the risk of predation by reducing temporal overlap with predators, predators aim to maximise their temporal overlap with prey to ensure their hunting success (Lima, 2002). The daily activity pattern of a given prey species is a function of its fundamental niche and local selective forces like predation pressure, intraguild interactions, and accessibility to resources (Fenn and MacDonald, 1995; Kronfeld-Schor and Dayan, 2008; Monterroso et al., 2013). Predator activity pattern is governed by temporal availability of feeding resources in addition to their fundamental niche and local constraints (Halle, 2000; Lima, 2002; Monterrose et al., 2013). However, not all interactions in nature enable coexistence between competing species. Annual mortality owing to intraguild killing varied from 4 %, where coyotes preyed on martens, to 76 %, where kit foxes were killed by coyotes and red foxes (Palomares and Caro, 1999; Caro and Stoner, 2003; Kozlowski et al., 2008). Another form of competition, kleptoparasitism, where one predator steals the kills from another, is fairly common (Iyengar, 2008; Pereira et al., 2014). In the presence of kleptoparasites like the spotted hyena, the population status of the affected species like African wild dogs dwindles because of alterations in their activity budgets, which may even lead to local extinction of a population (Carbone et al., 1997; Scantlebury et al., 2014; Saggiomo et al., 2017).
A number of studies have looked into the dynamics of carnivore coexistence patterns on a large geographical scale (e.g. Mills et al., 2001; Ritchie and Johnson, 2009; Miller et al., 2018; Prugh and Sivy, 2020). These studies report that large carnivores are responsible for the suppression of smaller predators on a global scale through interspecific interactions (Ritchie and Johnson, 2009; de Oliveira and Pereira, 2014; Prugh and Sivy, 2020). However, the pattern of interactions varied with resource availability, habitat structures, and composition of the predator guild (Ritchie and Johnson, 2009). In addition to this, studies of interspecific interactions at smaller scales are essential, as the fine-scale behavioural adaptations and niche differentiation mechanisms adapted by competing predators in a multi-predator system often fail to emerge at larger scales (Durant, 1998; Durant et al., 2010; Swanson et al., 2016; Farris et al., 2020).
Interactions between tigers (Pathera tigris L.) and leopards (Panthera pardus L.) are perfectly suited to understand how such mechanisms within a landscape can affect the functioning and structuring of large predator guilds. Tigers are sympatric with leopards across their range of occurrence (Odden et al., 2010). Although the geographical range of tigers has been reduced to more than 90 % over the past 100 years (Dinerstein et al., 2007), they still play their ecological role in several tiger reserves of India (Jhala et al., 2020) and are the apex predator in these systems. Leopards are more prone to intraguild competition and predation by tigers because of their taxonomic relatedness, similar feeding habit, and difference in body size which probably results in avoidance of tigers by leopards to enhance their chances of survival (Polis et al., 1989; Palomares and Caro, 1999; Donadio and Buskirk, 2006). The multiple mechanisms that permit their coexistence have been reported, which vary from differential prey selection between the two carnivores based on prey size class (Johnsingh, 1992; Karanth and Sunquist, 1995, 2000; Majumder et al., 2013) to expanded diet niche of leopards including domestic livestock, small mammals, and birds in the presence of tigers at high density (Odden et al., 2010; Harihar et al., 2011). A number of studies across tigers' extant range have reported that leopards alter their spatial use of habitats (Odden et al., 2010) in addition to low abundance and occupancy in response to presence of tigers (Harihar et al., 2011; Mondal et al., 2012). Subdominant predators may avoid competition by avoiding areas of higher population density of the dominant predator (Sherry, 1979; Karanth et al., 2017). Karanth et al. (2017) also found evidence of behavioural character displacement across the resource availability gradient, as they found variation in the degree of spatial and temporal overlap in different landscapes with variation in prey abundance. However, they also mention that if probabilities of site usage get closer to 1, it can become difficult to detect signs of spatial aggregation or separation. On the other hand, leopards have successfully increased their densities in areas of decreasing tiger density (Kumar et al., 2019). Leopards were also known to change their activity pattern to reduce competition with tigers in the same area (Mondal et al., 2012; Ramesh et al., 2012; Karanth et al., 2017; Li et al., 2018). Hence, it can be said that the interactions between subdominant leopard and dominant tiger and their co-occurrence mechanisms vary from site to site depending on tiger density and prey availability.
With this background, we studied tiger–leopard interactions using long-term camera trap data in Pench Tiger Reserve (PTR) in the state of Madhya Pradesh that is home to the largest tiger (Jhala et al., 2020) and leopard (Jhala et al., 2021) population in India. These two sympatric predators showed a dietary overlap of more than 90 % in PTR with chital (Axis axis) as the principal prey (Majumder et al., 2012a). This kind of substantial dietary overlap can effectively result in exploitative interference competition among the predator guild (Creel and Creel, 1996; Hayward et al., 2006). According to the niche complementarity hypothesis, a high degree of overlap in one of the niche components should result in low overlap in at least another niche component (Schoener, 1974; Jimenez, 1996; Lucherini et al., 2009). Hence, given the high dietary overlap among tigers and leopards in the study area (Majumder et al., 2012a), we hypothesise that leopards will occur at lower densities in the regions with high tiger abundance and/or alter their activity pattern to avoid lethal interactions with tigers. We expected relations between tiger and leopards to differ with varying densities of tigers. We hypothesised a parabolic relationship between tiger and leopard densities, i.e. that at low tiger densities, leopards should exhibit an increasing trend with tiger densities; at medium tiger densities, there would be no relation between tiger and leopard densities; while at high tiger densities, leopards would show a declining trend with increasing tiger density.
This study was conducted in Pench Tiger Reserve, Madhya Pradesh, central India. PTR (78∘55′ to 79∘35′ E and 21∘40 to 21∘57′ N) has an area of 410 km2 including Indira Priyadarshini National Park and Pench Mowgli Sanctuary. PTR along with Kanha Tiger Reserve constitutes one of the 11 level I tiger conservation units (TCUs) in India classified by Wikramanayake et al. (1998) (Fig. A1). The adjoining forest tract in north and northeast boundary of Pench provides crucial corridor linkage to Satpura Tiger Reserve, forming an important link between Satpura and Maikal populations of tigers and leopards forming a major source population for these carnivores in central Indian landscape (Jhala et al., 2020, 2021). The home range of tigers in PTR ranges from 19 to 64 km2 in PTR (Majumder et al., 2012b).
Bio-geographically, PTR is a part of the Deccan Peninsula Central Highlands (Sankar et al., 2013). Major forest types of PTR are tropical moist deciduous forest to slightly moist teak forest and tropical dry deciduous forest. Tropical dry deciduous forest is further classified into dry teak forest and southern dry mixed deciduous forest (Champion and Seth, 1968). Other vegetation types include southern moist mixed deciduous forest and Boswellia forest. Annual rainfall ranges from 1300 to 1400 mm in June to September. Other carnivores found here were Asiatic wild dogs (Cuon alpinus) which reside within the park and wolves (Canis lupus) which usually dwell in fringes. The sloth bear (Melursus ursinus) is the only bear species found in this reserve. Wild ungulates include chital (Axis axis), sambar (Rusa unicolor), gaur (Bos gaurus), nilgai (Boselaphus tragocamelus), wild pig (Sus scrofa), barking deer (Muntiacus muntjac), chowsingha (Tetraceros quadricornis), chinkara (Gazella bennetti), and blackbuck (Antelope cervicapra) (Sankar et al., 2013). PTR has one of the highest densities of chital (44–52 individuals per km2 during the study period) and sambar (5–8 individuals per km2 during the study period) in India (Jhala et al., 2020; Chatterjee et al., 2022). This makes the study area rich in ungulate prey, which has the potential to sustain high densities of tiger and leopard. A total of 99 villages are located within the “zone of influence” of PTR, harbouring a population of 61 000 individuals mostly comprised by the “Gond” tribe (Sankar et al., 2013). Agriculture is the most prevalent land use pattern outside PTR followed by human settlements and urban centres (Dutta et al., 2016).
We used camera trap-based capture–mark–recapture framework (Karanth and Nichols, 1998) to estimate spatially explicit densities of tigers and leopards (Borchers and Efford, 2008). The natural markings of animals like tigers, leopards, and jaguars are perfectly suited for unique individual identification. In spatially explicit capture–recapture (SECR), the spatial capture history alongside the spatial layout of traps and a mask delineating the maximum space usage of the target population are used to estimate the density (Royle et al., 2013).
2.1 Field methods
The entire study area (410 km2) was systematically sampled by deploying a pair of camera traps within 4 km2 grids, thereby decreasing the chances of the area remaining unsampled (Fig. 1). The selected locations had the highest capture probability of tigers and leopards. Tigers and leopards do not walk at random but are known to use game trails, dirt roads, and dry riverbeds for commuting and patrolling their territories. Hence, two sided camera traps were deployed at 82 stations after an initial ground survey (of 970 km) for selecting the best locations on such trails and roads to photo capture large carnivores. The same locations were sampled for the entire study period of 3 years (2013–2016). Cameras were placed at the height of 45 cm above ground level facing the trail directly. No olfactory lure was used to attract the target animals to the cameras. Cameras operated during two periods each year (November to October): first, during a 50–55 d block from November to January, and second, a 50–55 d block from January to March. This ensured that the population remained closed for the sampling duration by ensuring no birth, no death, no immigration, and emigration from the target population. The minimum distance between two camera stations varied between 1.5 and 2 km (Sharma and Jhala, 2011). In order to maximise the capture probability, trapping units were properly camouflaged using natural materials like leaves, twigs etc. to reduce the chances of “trap shyness”.
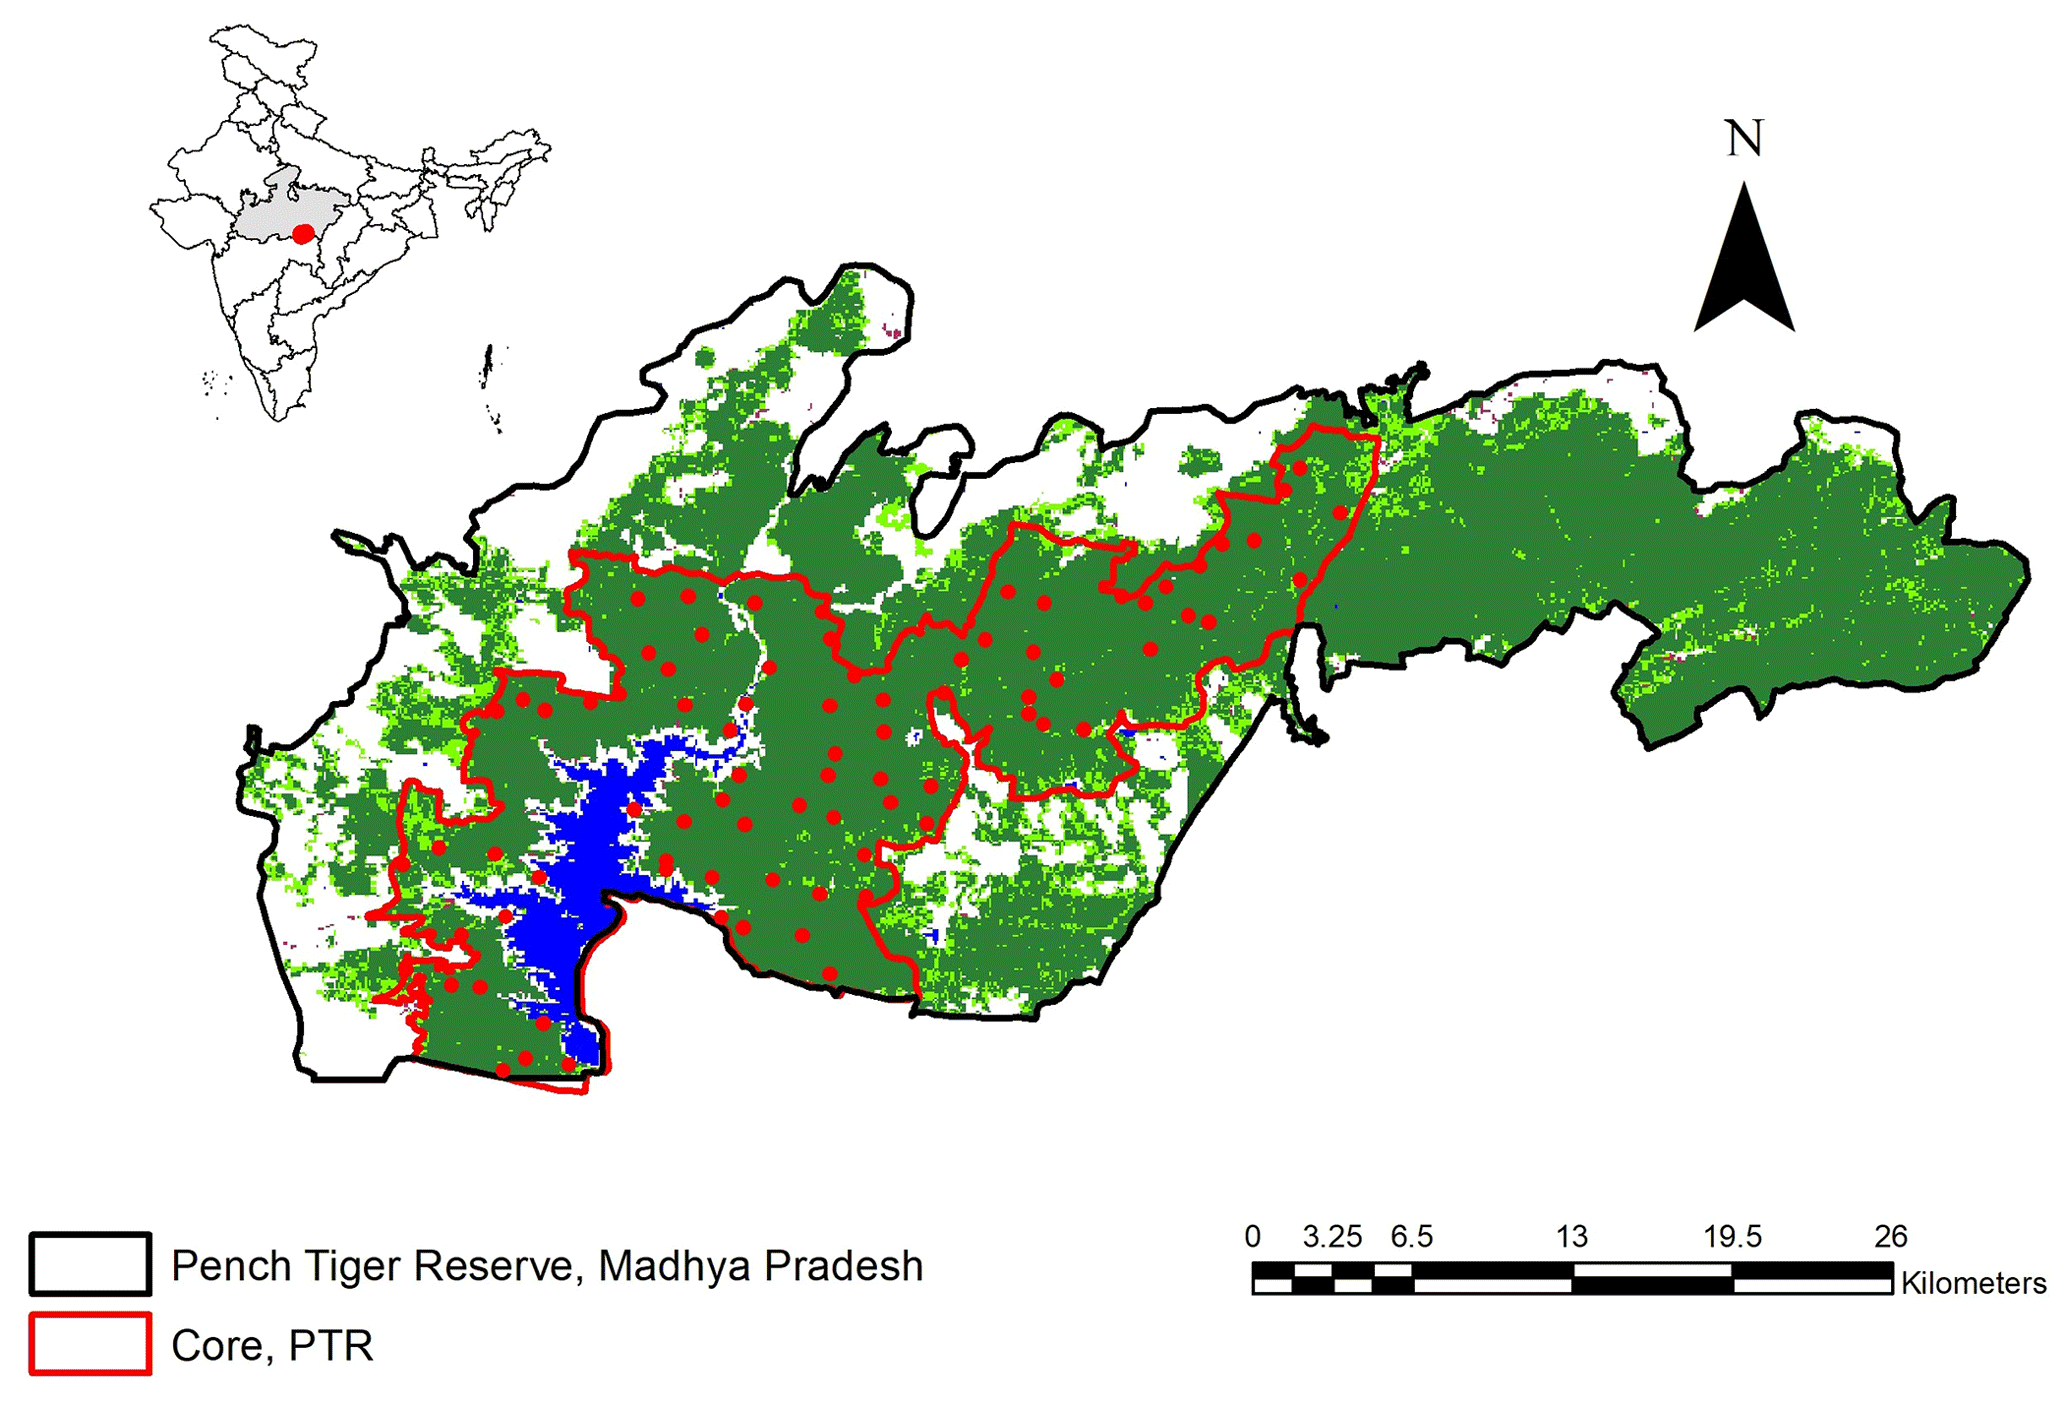
Figure 1Location of camera trap stations in Pench Tiger Reserve, Madhya Pradesh (2013–2016). Map inset shows the location of Pench Tiger Reserve in India.
2.2 Analytical methods
Individual identification of tiger and leopard was done based on examination of the position, shape of stripes, and rosettes on the flanks (Schaller, 1967; McDougal, 1977; Karanth, 1995; Jhala et al., 2008), limbs, forequarters, and tail (Schaller, 1967; McDougal, 1977; Karanth, 1995). We used individuals which had both flanks, and then the flank with greater number of individuals were taken into account. Hotspotter (Crall et al., 2013) software was used to assist in the individual identification of leopards. Individuals were classified into different age groups by body characteristics (Sadhu et al., 2017).
A spatial capture history of tigers and leopards that had information on individuals captured and trap locations was prepared from the photo captures obtained from camera traps (Efford, 2011).
2.2.1 Density and distribution pattern
Maximum-likelihood-based spatially explicit capture–recapture framework (MLSECR) (Efford, 2004; Borchers and Efford, 2008) using camera trap data was employed to estimate densities of tigers and leopards for each year separately. SECR density is estimated from two parameters determined from the spatial capture–recapture (i) detection probability (g0) at range centres and (ii) spatial scale of detection (σ) using a homogeneous spatial point process (Efford et al., 2009). The spatial scale of capture probability (σ) is a decreasing function of distance d between the activity centre and the detector. We fitted a half normal function to model σ. Activity centres of individuals are unknown but assumed to follow a Poisson distribution with density D. We defined the state space by using the “suggest.buffer” function in SECR package in R. This function estimates the required buffer width around the camera trapping array by using the spatial movement parameters from the capture recapture information of the data (Efford, 2004).
We modelled g0 and σ as (i) constant detection probability (g0(.), σ(.)) and (ii) inherent heterogeneity in g0 and σ as two groups (g0(h2), σ(h2)). Combined effects of (iii) heterogeneous g0 and constant σ along with heterogeneous σ and constant g0 [g0(h2) σ(.) and g0(.)σ(h2)] were also modelled (Roy et al., 2016; Kumar et al., 2019). Sunquist and Sunquist (2002) demonstrated that home range size and movement of large cats vary between the sexes, which has the potential to induce variability in the capture probability of individuals (Efford and Mowat, 2014). This latent variability was accounted for by modelling (iii) g0 and σ as a function of gender (g0(sex), σ(sex). Due to the long-term data, sex of most tigers and leopards was known from camera trap images; however, for unsexed individuals, the model uses the capture probability of the known gender individuals to allocate unsexed individuals to a gender class using hybrid mixture models. In this model, pmix denotes the mixing parameter of two sexes which is used to model the detection function as a two-class mixture. It provided the detection corrected sex ratio of the target species (Kumar et al., 2019). The best model was selected with minimum Akaike information criteria (AICc) values (Burnham and Anderson, 2002). Estimated spatial density of both the species was used to predict the spatial distribution pattern in the study area using ArcMap v. 9.3.1. Although the density surface described by the selected model is actually the realised capture process unless modelled with habitat covariates (Efford, 2018), the spatial capture process and the density of animals are highly correlated with each other. Hence, it can be treated as a density surface. Data processing was carried out in MS Excel v. 2007 and analyses were carried out using the “secr” package (Efford, 2015) in the programme R v. 3.1.3. Individuals more than 1 year old were taken into account for density estimation, as high mortality rate and low capture probability of younger individuals can possibly reduce the robustness of the estimates (Karanth and Nichols, 1998; Sadhu et al., 2017).
We extracted averaged values of the normalised difference vegetation index (NDVI) and averaged relative abundance index (RAI) values of chital, sambar, wild pig, leopard, and tiger densities at 2×2 km grids. RAI was calculated as capture rate of target animals per 100 trap nights. Subsequently, relationships between NDVI and prey RAI were explored with tiger and leopard densities and between tiger and leopard densities. As we hypothesised a parabolic relationship between tiger and leopard density, we used a quantile regression to obtain estimates of the quantiles of leopard density as a function of tiger density because it does not need to assume a parametric form of the error distribution (Koenker and Bassett, 1978; Cade and Noon, 2003; Koenker, 2005). In case of quantile regression, the usual single-mean function of linear or non-linear regression is substituted by a family of functions across all or a part of quantiles on the interval of 0 to 1. In this case, we divided the data into four intervals (0.25, 0.5, 0.75, and 0.95). This in turn provides a holistic picture of change in all parts of the distribution of the response variable with respect to the predictor variable (Cade et al., 2008).
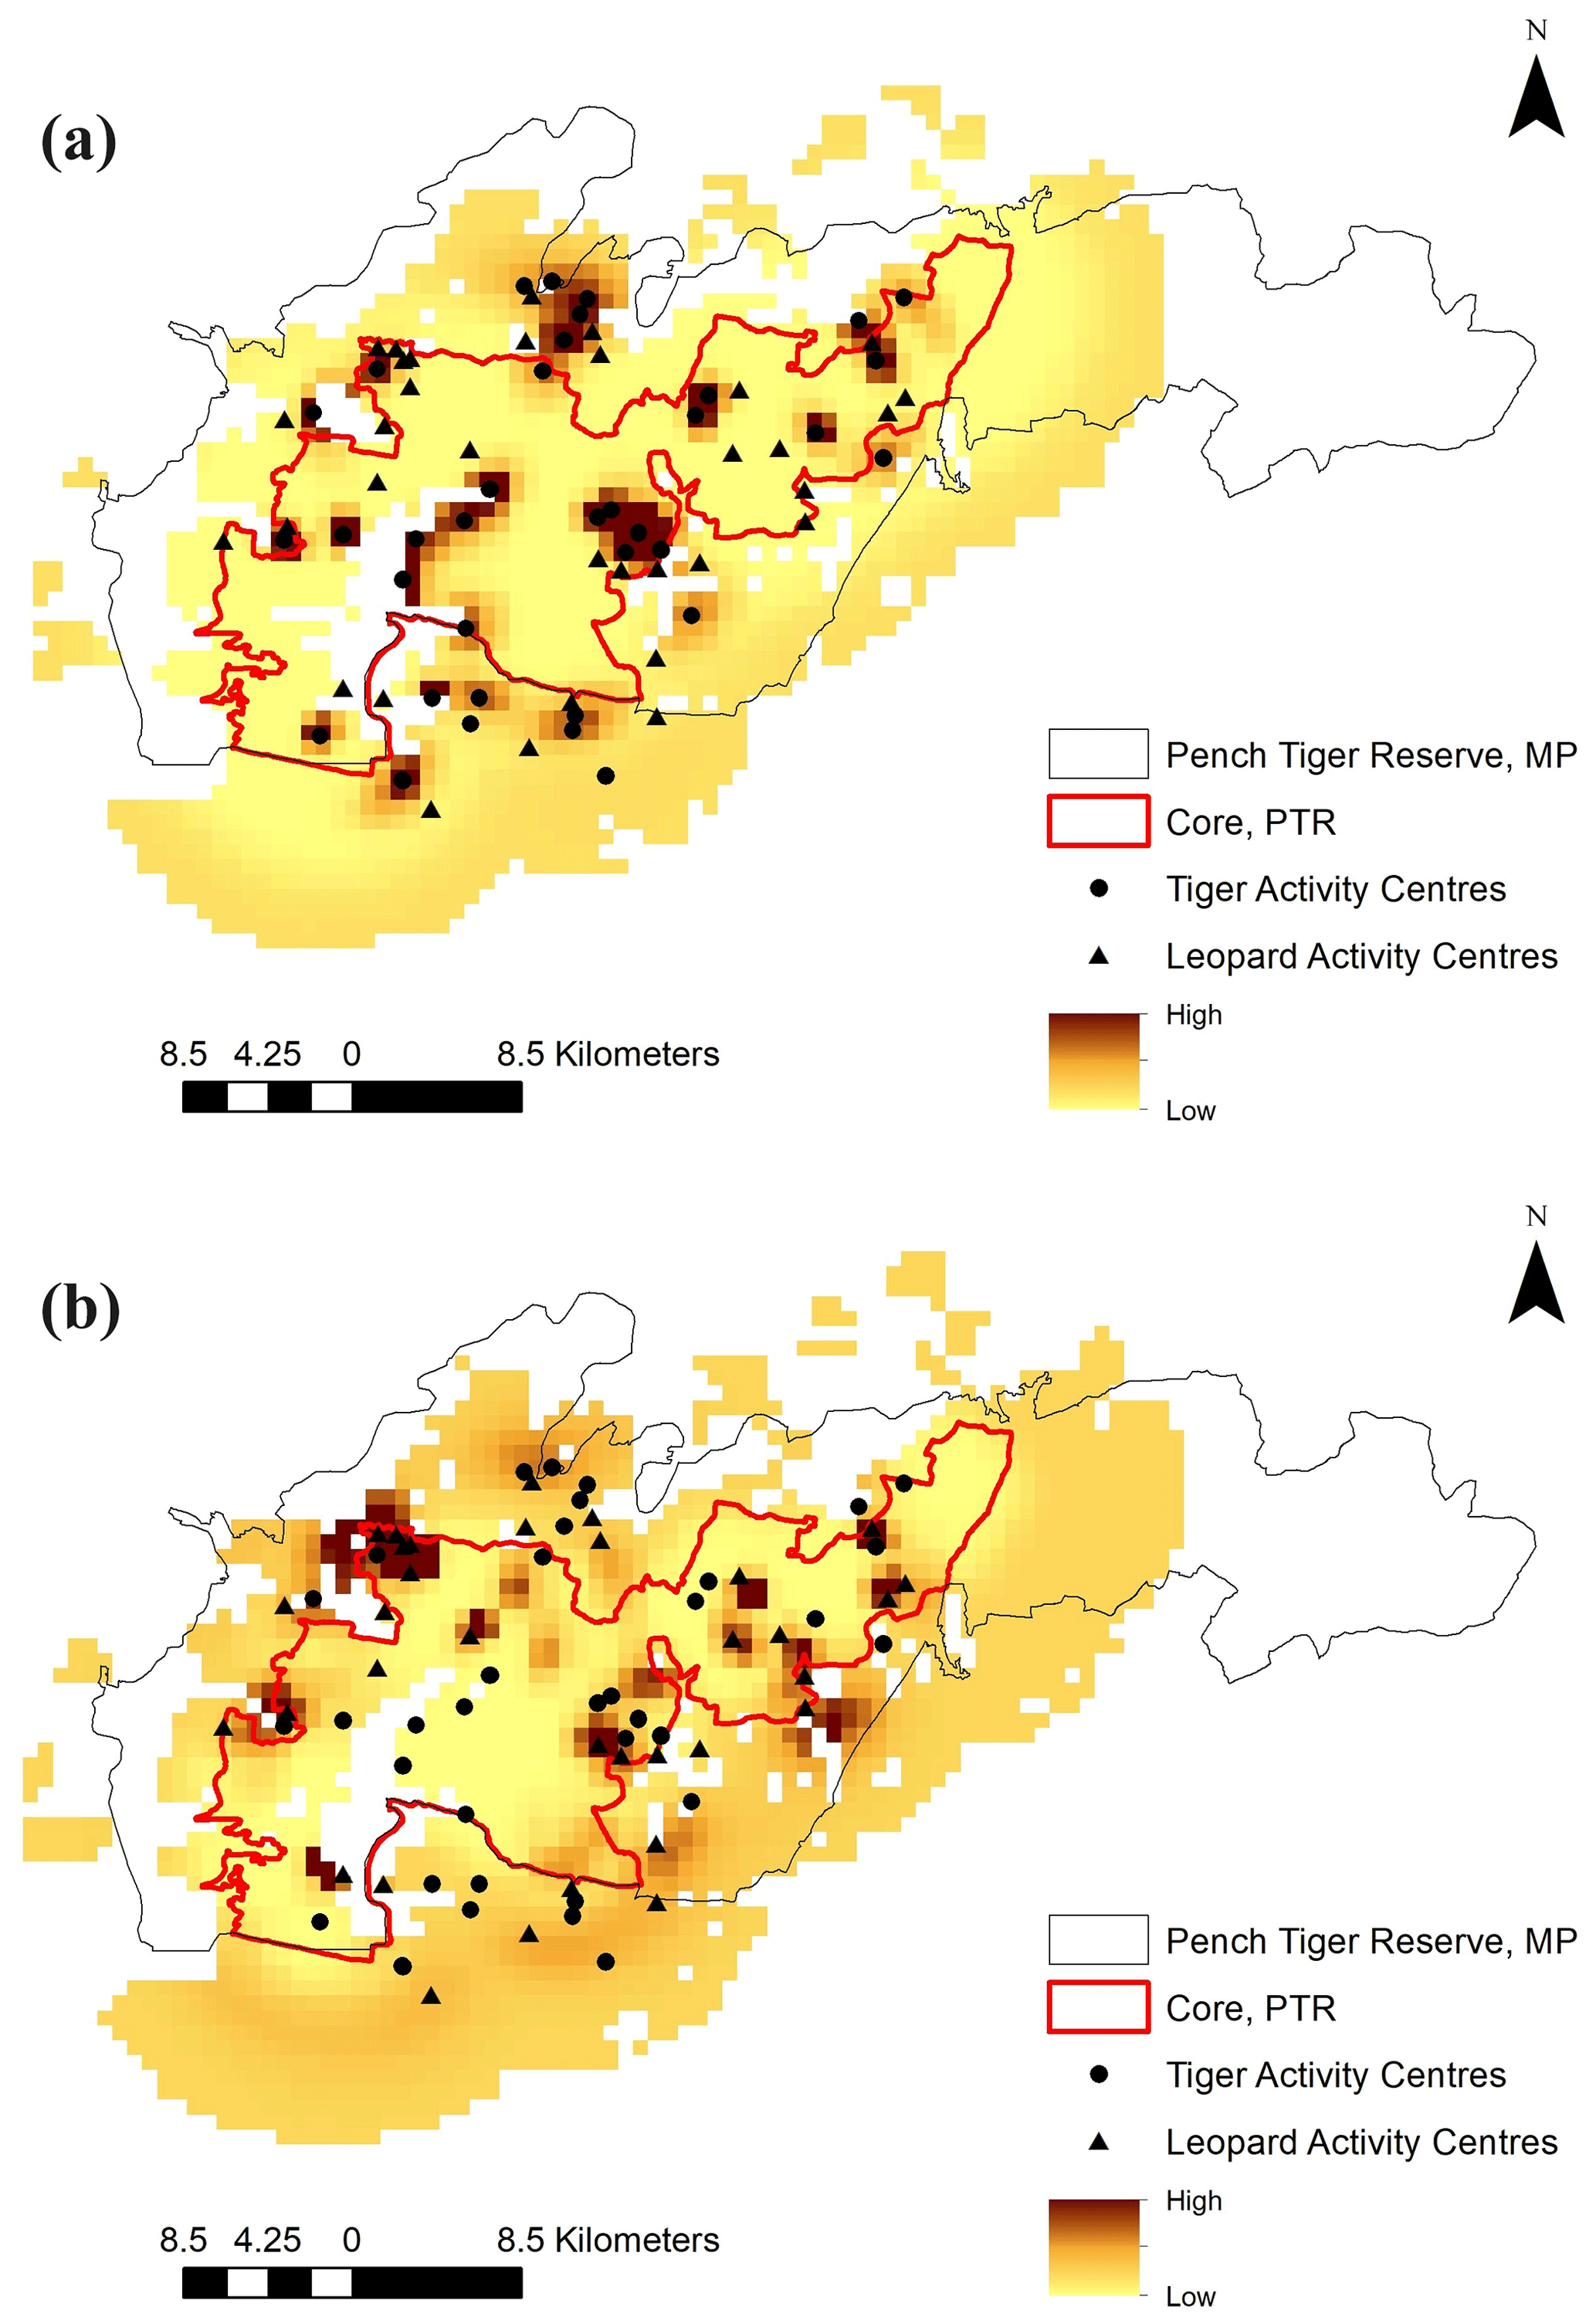
Figure 2Spatial distribution pattern mapped in terms of realised capture process of (a) tigers and (b) leopards in the intensive study area.
2.2.2 Activity peaks and temporal overlap
In order to check whether leopards alter their activity pattern to avoid tigers, camera trap-based photographs were used to evaluate their activity peaks and extent of temporal overlap with tigers. ExifPro v.2.1 was used to extract the temporal information of photo captures of tigers and leopards, as all the photographs from the detectors were stamped with date and time of capture. We consider a photo capture as an independent event if the same individual tiger or leopard was photo-captured at the same location after an interval of 30 min. A von Mises kernel density estimate corresponding to circular distribution function (Ridout and Linkie, 2009) was used to generate the activity pattern for both carnivores. Activity peaks were identified based on the maximum number of captures obtained at a specific time period (Linkie and Ridout, 2011; Foster et al., 2013). The coefficient of overlap (Δ) in activity between the two carnivores was estimated as the overlap area under the density curve. We calculated the extent of temporal overlap from the coefficient of overlap and its 95% confidence interval using 10 000 bootstrap samples (Meredith and Ridout, 2014). The extent of overlap varies from 0 (no overlap) to 1 (100 % overlap, identical activity pattern) (Ridout and Linkie, 2009). We estimated temporal overlap between tigers and leopards at high, medium, and low levels of tiger density. For this, we divided the study area into three tiger density categories based on the encounter rate of tigers per 100 trap nights: high (6.36 to 32.73), medium (3.64 to 5.45), and low (0.9 to 2.72), and estimated the temporal overlap in these three categories. This classification was done based on different quartiles, where low was the lowest quartile, medium was the second quartile, and high was the third and fourth quartiles of the encounter rate. We also estimated their extent of overlap in each year. Additionally, we wanted to check the extent of temporal overlap between these two predators and their preferred prey species. So, we estimated the temporal overlap between these two sympatric predators and their principal prey, which are chitals, sambars, and wild pigs, following the same method. Statistical analysis was done in the “overlap” package (Meredith and Ridout, 2014) in R (v. 3.1.3).
2.2.3 Temporal spacing of detections at shared camera sites
Temporal information of photo captures of tigers and leopards at each camera station was transformed to Julian format for analysis. We first collated independent photo captures of tigers. A relative abundance index (RAI) for tigers was computed for each camera trap station as the sum of total independent tiger photo captures divided by camera trap effort (time that a camera was operational); this is expressed as photo captures per 100 trap nights. Camera traps were then categorised into four RAI categories for tigers following the same classification based on quartiles. At each camera trap station where both tigers and leopards were photo-captured, we calculated the time difference between the detection of tigers (hereafter reference detection) and the closest detection (hereafter proximal detection) of leopards following the initial photo capture of tigers. This time difference between the reference and proximal detections is hereby termed as “minimum lag”. We assessed the temporal spacing between consecutive detections of tigers and leopards across high, medium, and low tiger RAI categories.
It was likely that leopards could potentially avoid tigers at the fine spatial–temporal scale. To evaluate such a pattern, we checked the lag in a trail usage by leopards following a photo capture of a tiger. We compared the actual time lag of leopard photo capture following a tiger capture with a random time lag using a Mann–Whitney U test (Mann and Whitney, 1947). We also analysed this pattern in leopard trail usage at (1) low (1.92 tigers per 100 km2), (2) medium (4.48 tigers pe r100 km2, and (3) high tiger density (4.8 tigers per 100 km2) categories. These classes were decided based on the three quartiles of tiger density. All analyses were carried out using Microsoft Excel (v. 2007) and the programme R (v. 3.1.3).
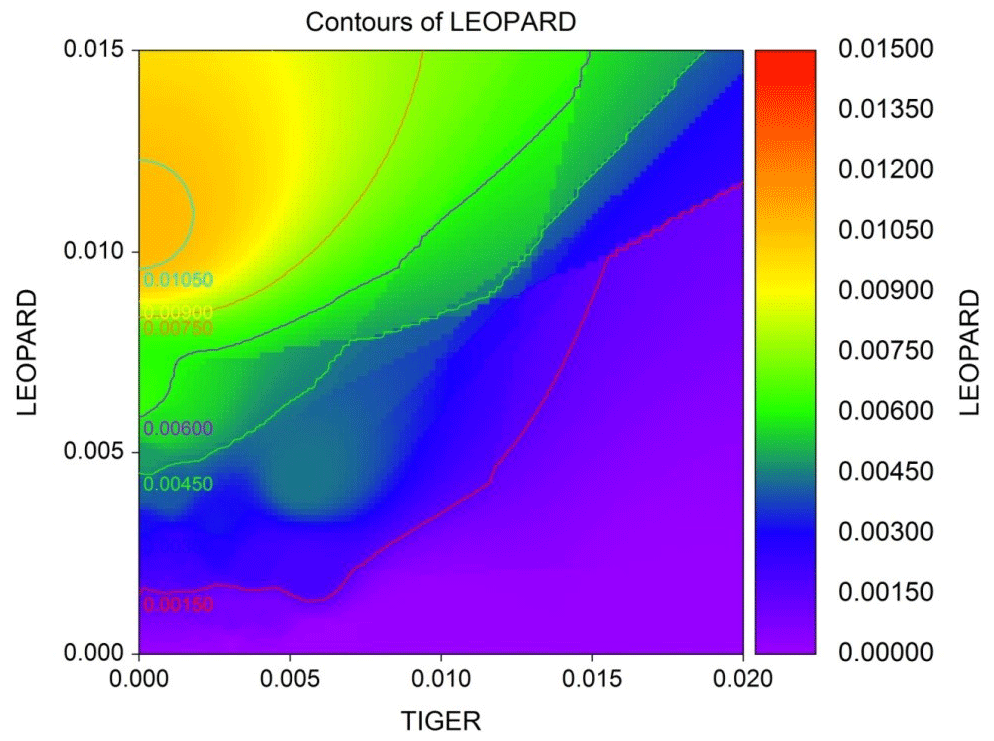
Figure 3Diagrammatic representation of leopard density contours against tiger density areas. Plotted density contours of leopards against that of tigers show that density of leopards declines with increase in the density of tigers.
3.1 Density and distribution pattern
The total effort of 28 742 trap nights over (Table A1) the entire sampling period yielded photographs of 6459 usable photographs of tigers and 1884 usable photographs of leopards. Photographs were of 28 unique male tigers, 27 unique female tigers, 21 unique male leopards, and 30 unique female leopards (individuals over the years) (Table A2). Densities of these sympatric predators were estimated for each sampling year. Estimated tiger density ranged from 4.8 (SE 0.799) to 5.7 (SE 0.879) per 100 km2 during the study period with overlapping confidence intervals (Table 1). Estimates of density of leopards varied from 3.76 (SE 0.918) to 4.9 (SE 0.884) per 100 km2. Our data displayed variation in detection probability and sigma according to gender. Detection probabilities of female tigers were higher than males, whereas both male and female leopards showed similar probability of detection for the first 2 years (Table 1). We found similar estimates of sigma for female tigers and leopards and for male tigers and leopards (Table 1).
The average distance between home range centres of tigers and leopards was 13.63±7.03 km with a range of 0.2 to 35 km. The detection corrected sex ratio (pmix) of tigers were slightly female-biased in the first 2 years but became male-biased during the last year. On the other hand, leopards were male-biased in the first year, which later became dominated by females in the following years (Table 2). Our data indicate that tigers and leopards were spatially segregated. Tiger captures were higher in the central, south-west, and northern parts of the study area (Fig. 2). Leopard captures were higher in areas of relatively lower tiger densities and peripheral areas where tigers occur less (Fig. 2). Density contours of leopards against that of tigers showed that density of leopards declines with increase in the density of tigers (Fig. 3).
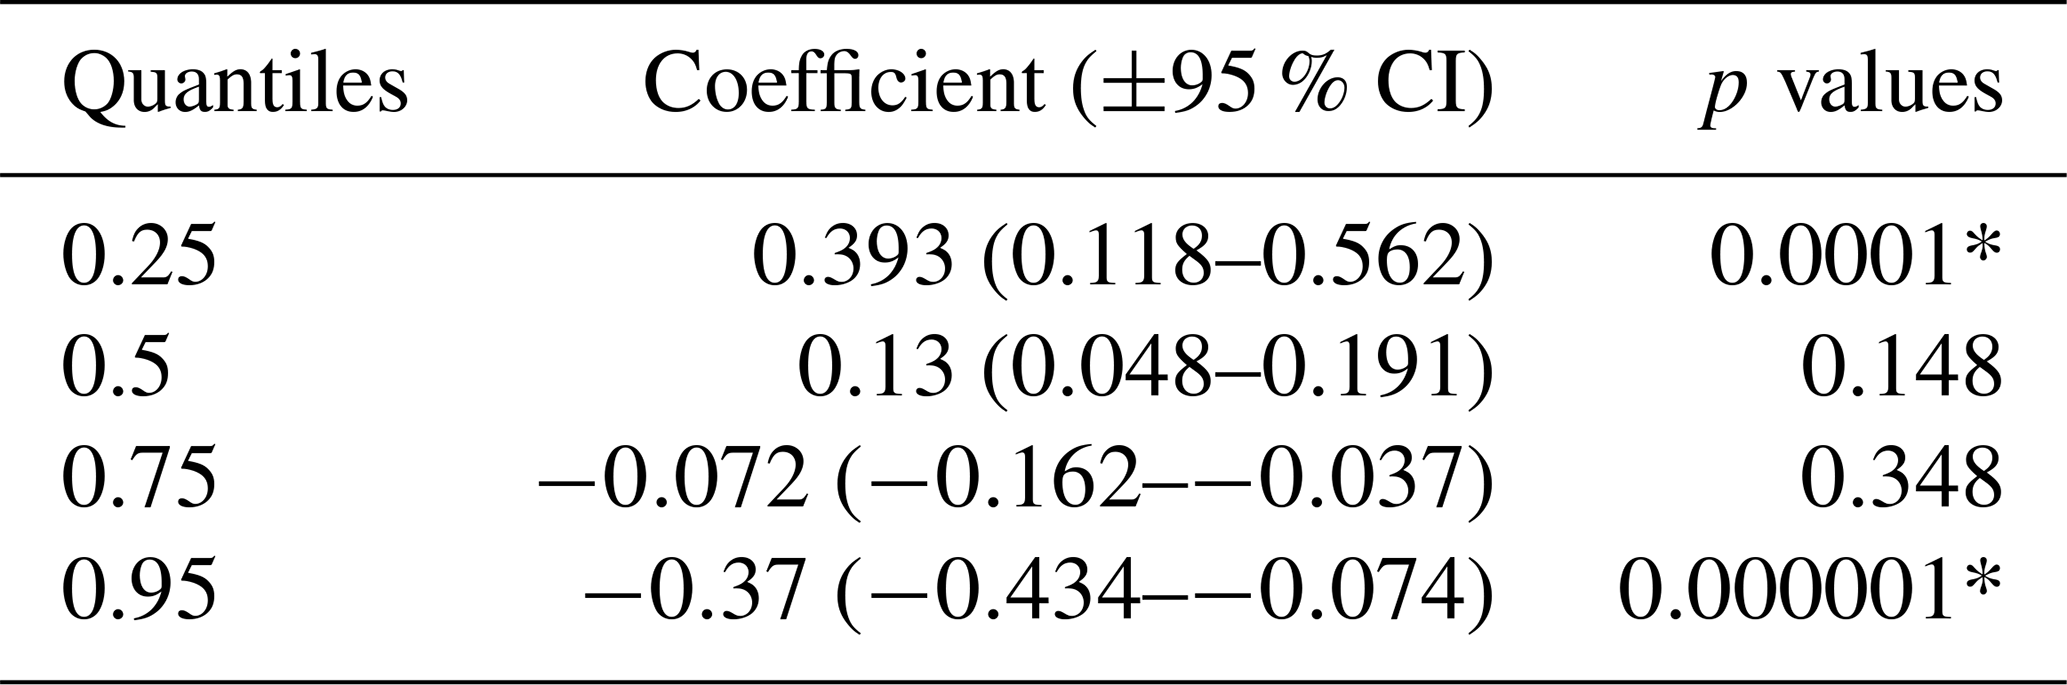
Our results did not show any significant relationship between the distribution pattern of the major prey species (chital, sambar, and wild pigs) with that of tigers and leopards in the study area (Fig. B1). Vegetation cover (NDVI) also showed no relationship (Fig. B2). The slope of the regression for leopard density versus the lower quantile of tiger density was significantly positive; at median density of tigers, it was not different from zero, while at higher tiger density, quantiles were significantly negative (Table 2) (Fig. B3), implying leopard density was lower in high tiger density areas.
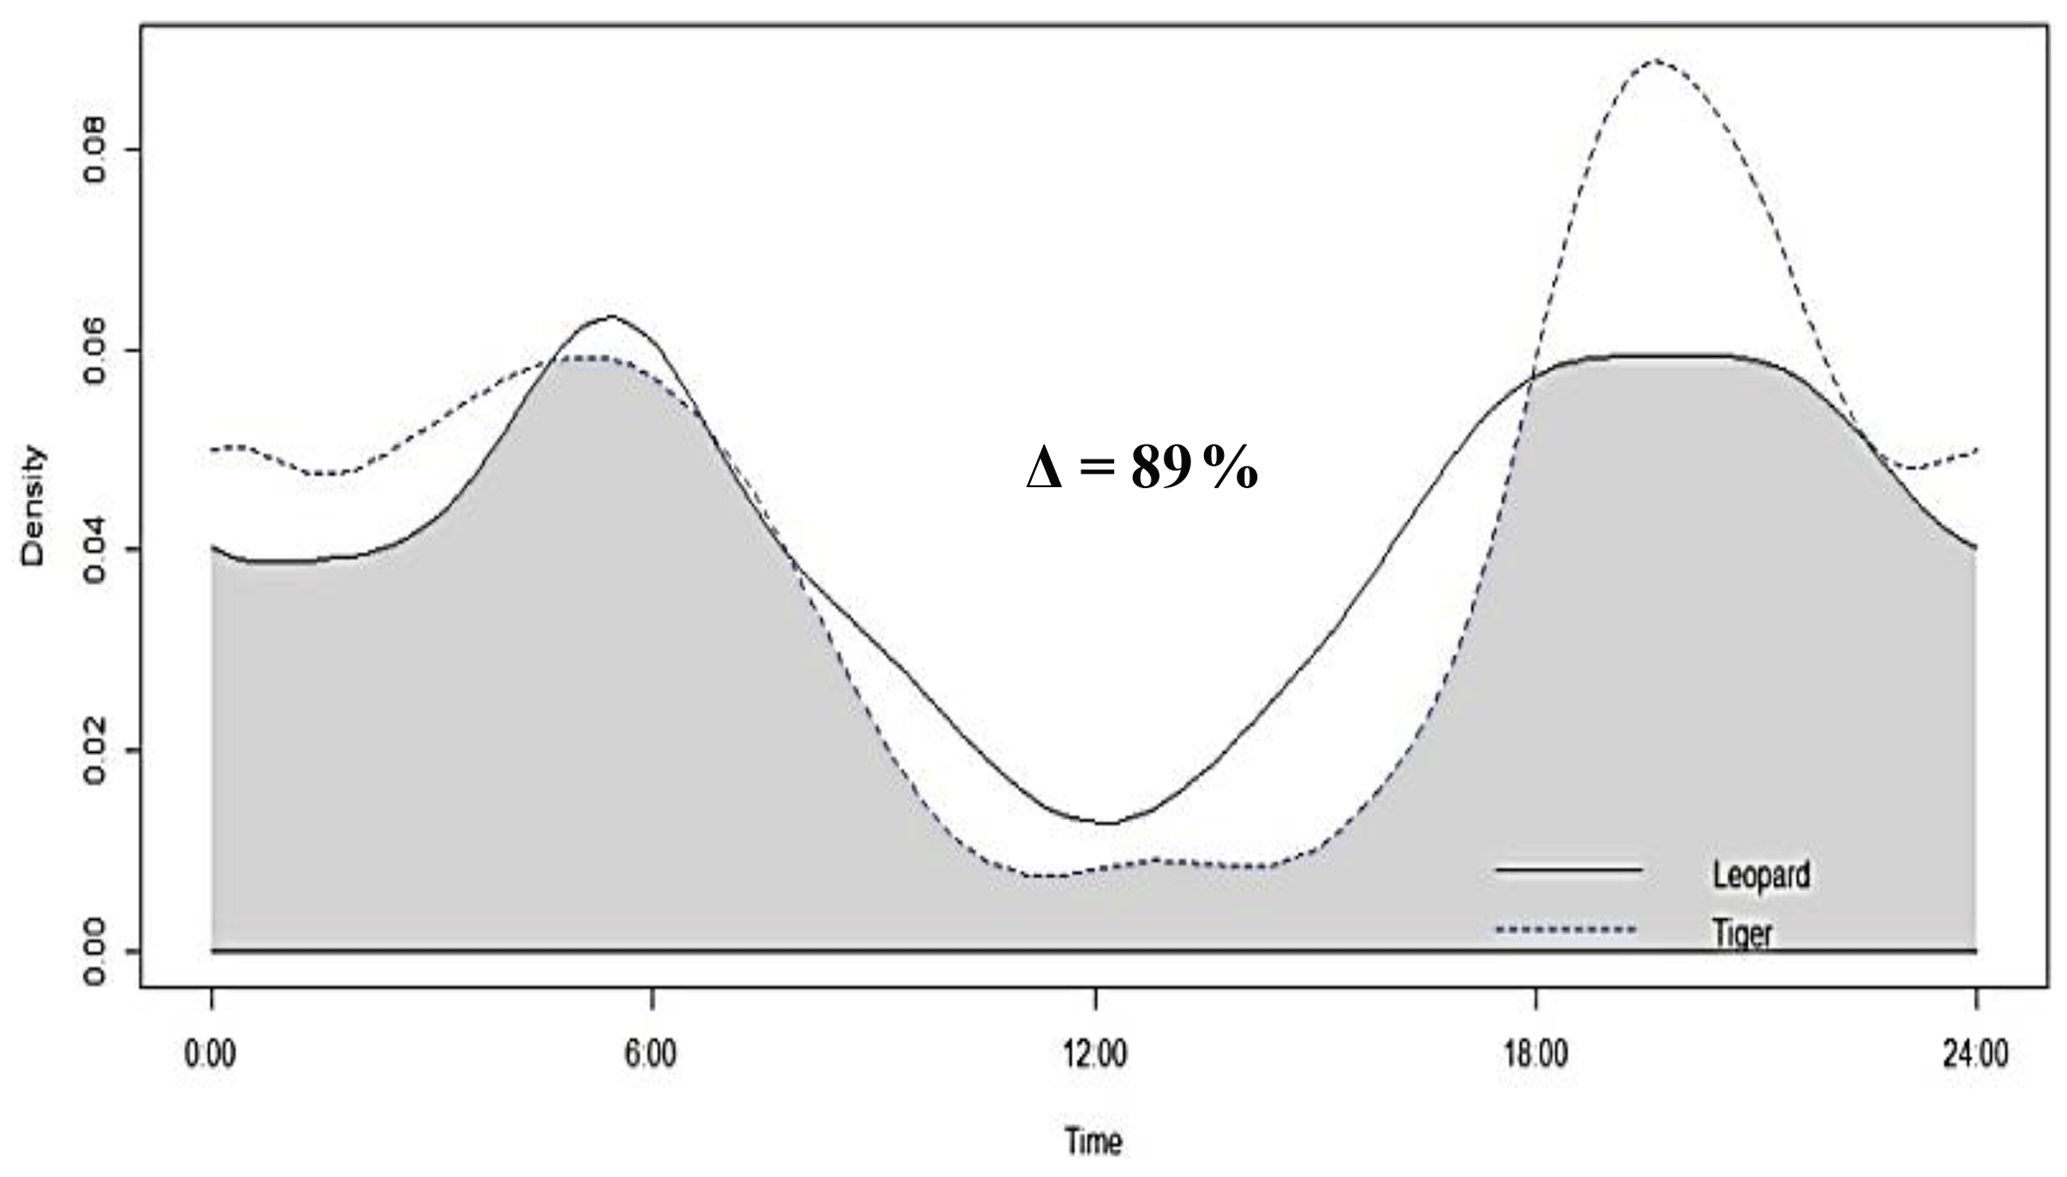
Figure 4Activity peaks and temporal overlap between tigers and leopards in Pench Tiger Reserve, Madhya Pradesh.
Table 1Estimated density per 100 km2 along with sex-specific detection probability (g0), sex-specific spatial scale of detection (σ, in km), and detection corrected sex ratio (male : female) of tigers and leopards in Pench Tiger Reserve, Madhya Pradesh, during the study period (2013–2016).
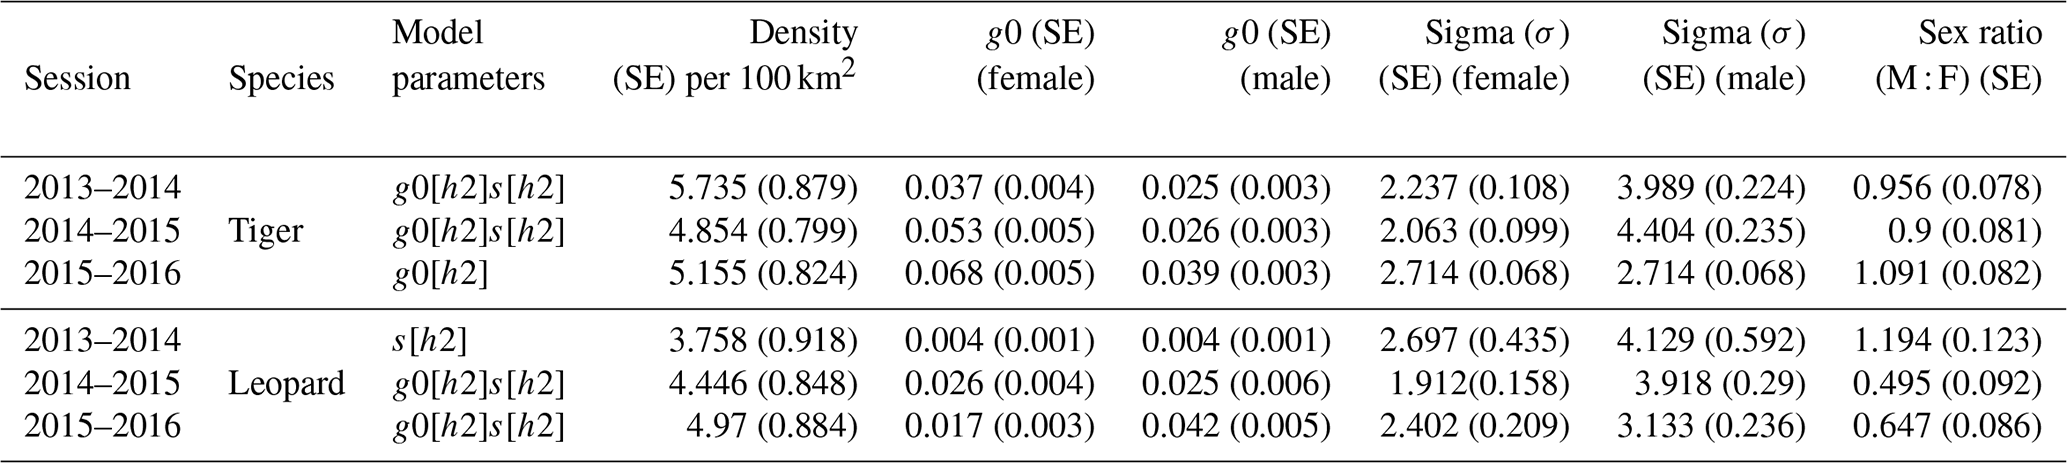
Table 2Quantile regression coefficients of leopard densities with tiger densities in Pench Tiger Reserve, Madhya Pradesh, during 2013–2016.
3.2 Activity peaks and temporal overlap
Tigers and leopards both had bimodal activity patterns with activity peaks around 06:00 IST in the morning and 19:00 to 20:00 IST in the evening. The extent of temporal overlap between these two sympatric felids was 89 % (CI 86 %–93 %) in 2016 (Fig. 4). In low tiger density areas, the extent of overlap was slightly lower, 77 % (CI 68 %–85 %) (Fig. B4a), but with overlapping confidence intervals. In medium and high tiger density areas, the extent of temporal overlap was similar, 86 % (CI 85 %–99 %) and 86 % (CI 81 %–93 %), respectively (Fig. B4b–c). The coefficients of temporal overlap were also similar across years with overlapping confidence intervals, 77 % (CI 69 %–86 %) in 2014 and 88 % (CI 79 %–92 %) (Fig. B5a–b). Investigation of the extent of temporal overlap between these two sympatric felids and their principal prey revealed that the maximum overlap for both tigers and leopards was with sambar, followed by wild pigs and then chitals (Fig. B6a–f).
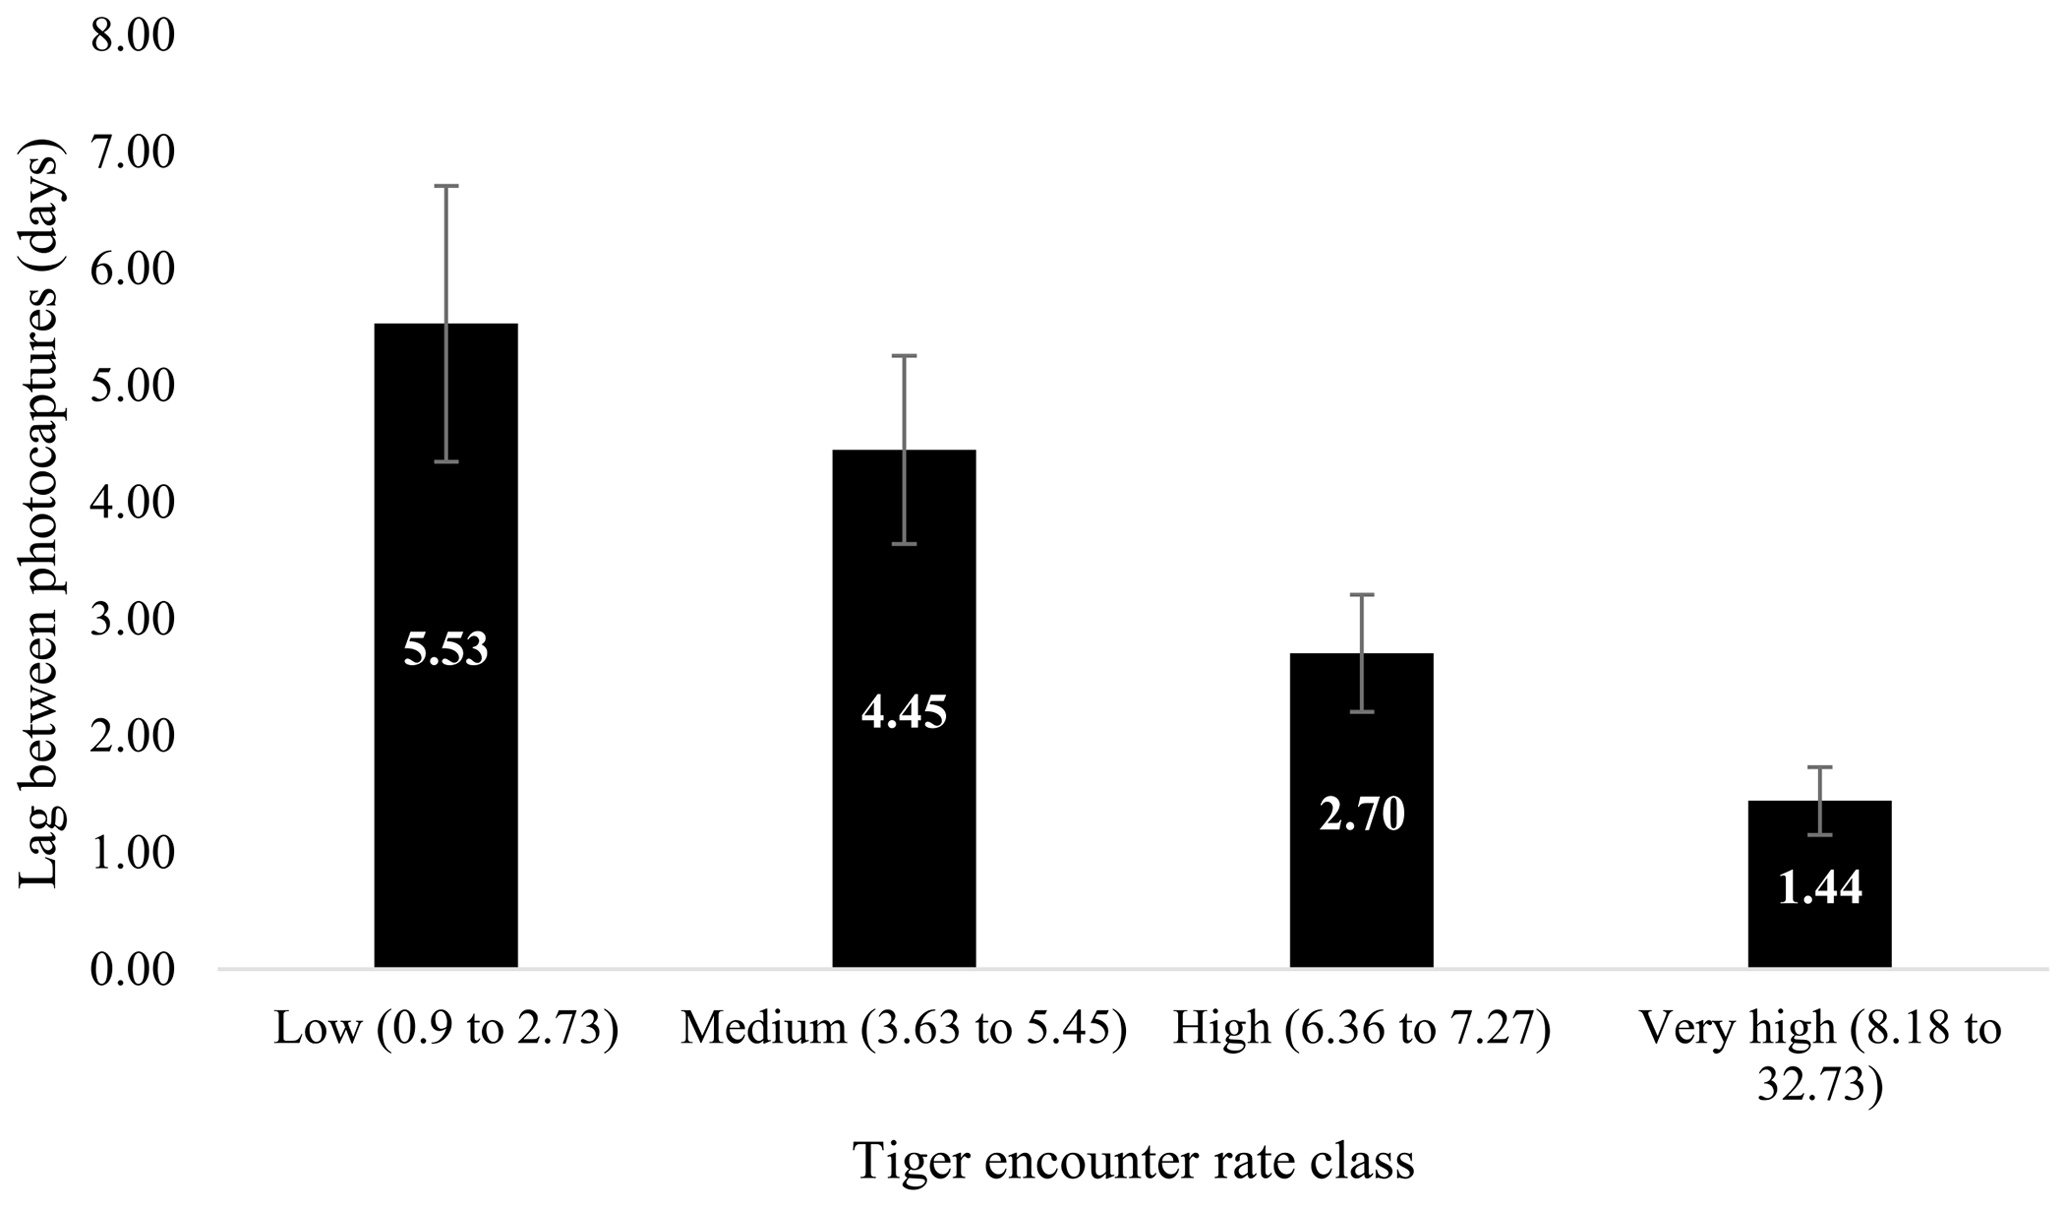
Figure 5Relationship between average minimum lag between photo capture of a leopard after a tiger has been photographed. Columns represent the average encounter rate of tigers (classified low as lower quantile or least encounter rate and very high as upper quantile or maximum encounter rate of tiger).
3.3 Temporal spacing of detections at shared camera sites
Minimum lag between successive captures of tigers and leopards ranged from 0.002 to 36.29 d (Fig. 5). Lowest average minimum lag was seen in very high tiger encounter rate class (1.311±0.87 d), whereas the highest lag was in low tiger encounter rate class (6.84±1.84 d). Mean lag varied from 1.88 (SE 0.63) d to 12.61 (SE 1.95) d (Fig. 5). Our data showed that the mean lag and average minimum lag decreased with increase in the tiger encounter rate in a linear manner (Fig. 5). In the high encounter rate class, the minimum lag varied from 0.002 to 8.65 d, whereas the range of minimum lag was 0.02 to 19.96 and 0.03 to 36.29 d in medium and low encounter rate class, respectively.
The median time lag between leopard captures after a tiger capture was 1.68 d, whereas the median time lag between tiger capture and a random capture event was 3.63 d, and the observed lag was significantly smaller than random (W=11 617, p=0.00005). We also found that the observed lag was significantly smaller than random lag in medium (W=1617, p=0.0003) and high (W=1288, p=0.03) tiger density areas. However, the observed lag was not different than random in the low tiger density areas (W=1001, p=0.29).
The interactions among the members of the predator guild significantly influence their population dynamics and distribution (Linnell and Strand, 2000). Understanding the patterns of interactions provides insights into mechanisms that promote coexistence between competing carnivores. Our study adds information on how tigers and leopards co-occur at high densities through fine-scale spatio-temporal interactions.
4.1 Tiger and leopard density pattern
Tiger density in the study area was on par with estimates from reserves with similar habitat features like Bandhavgarh Tiger Reserve and Pench Tiger Reserve, Maharashtra (Jhala et al., 2020). Estimated leopard density during the study period was similar to that of Bandhavgarh Tiger Reserve (Rather et al., 2021). The densities of these two sympatric predators within the study area remained stable (overlapping confidence intervals) throughout the 3 years. Estimation of prey density-based carrying capacity (Jhala et al., 2020) shows that the carrying capacity of the study area varies between 6.96 to 8.86 tigers per 100 km2. Carrying capacity of leopards based on prey biomass (Hayward et al., 2007) was estimated at 8.07 leopards per 100 km2. As per our findings and the latest estimates of tiger and leopard densities in the area (Jhala et al., 2020), it can be assumed that tigers are about to attain carrying capacity in PTR, MP. Comparison with the estimated leopard carrying capacity suggests that leopards are operating below the carrying capacity. We did not observe any evidence of decline in leopard population over the years. Such lack of demographic effect on leopard population in the presence of tigers has also been observed in Kanha National Park where leopards attain a positive growth rate in areas of low and medium tiger density (Kumar et al., 2019).
As per our hypothesis, leopard densities decreased with increase in tiger density at higher quantiles. The areas of low tiger density were also comparatively low in prey abundance. As a result, both these co-predators can increase their numbers to a certain extent by exploiting these limited resources. At medium tiger densities, no relationship was seen between tigers and leopards, and at high tiger densities, a depressive effect of tiger density was observed on leopard densities.
4.2 Spatial distribution pattern of tigers and leopards
We also found that photographic captures of leopards were higher near the periphery (except the northern and south-western part) and areas of PTR where photo captures of tigers were lower (Fig. 2). PTR is situated in a matrix of agricultural fields and human habitation. The northern and south-western part of PTR is connected with the reserve forest, which has abundant prey and resulted in higher photo captures of tigers, whereas the rest of the periphery where leopard captures were higher borders agricultural fields and/or human habitation. Similar findings are reported from Bardia National Park, Nepal, and Rajaji National Park, India, where leopards use the edges as a result of interference interactions with tigers (Odden et al., 2010; Harihar et al., 2011). The relative avoidance of peripheral (except for the south-west and northern part) areas by tigers probably created a “competition refuge” (Odden et al., 2010) for leopards near the periphery of PTR. Different species with similar prey preferences residing in the same area are likely to avoid vigorous interactions owing to the huge cost associated (Donadio and Buskirk, 2006; Ramesh et al., 2012; Vanak et al., 2013; Carter et al., 2015). However, intraguild killing of the subdominant predator by the dominant one can take place even in the absence of strong competitive dynamics (Curveira-Santos et al., 2021), but we did not observe tiger predation on leopards during the study period.
Competition acts as a major driving force in structuring communities in ecosystems with multiple predators because of their behavioural and morphological adaptations to hunt successfully (Creel, 2001; Donadio and Buskirk, 2006; Balme et al., 2017). Majumder et al. (2012a) reported significant dietary overlap between tigers and leopards in PTR, but leopards were seen to be feeding largely on prey with poorer health condition (Majumder et al., 2013). Resource partitioning has been well documented as a mechanism for the coexistence of sympatric predators (Sollmann et al., 2012; Santos et al., 2019; Paúl et al., 2020). Our study supports the fact that leopards are adaptive in terms of choice in the presence of tigers. The risk of exploitative competition for leopards with tigers is higher, as shared prey leads to enhanced competitive interactions.
4.3 Temporal activity pattern of tigers and leopards
In addition to spatial and prey partitioning, temporal partitioning has also been observed as an adapted behavioural mechanism of these sympatric predators to attain coexistence (Steinmetz et al., 2013; Sunarto et al., 2015; Yang et al., 2018). The conventional analysis of unitary encounter rate and temporal activity peaks (Fig. 4) of our data does not show any sign of difference. Temporal overlap between these two sympatric predators also remained similar across varying tiger density areas. Both these predators need not separate in daily activity patterns, as it overlaps with the daily activity pattern of their principal prey species (Fig. B1a–f). High temporal overlap between sympatric predators in order to maximise their utilisation of prey has been observed in previous studies (Karanth and Sunquist, 1995; Ramesh et al., 2012). Hayward and Slotow (2009) also mention that despite all members of the guild facing the risk of intraguild predation, only secondary predators like wild dogs and cheetahs alter their activity pattern to minimise overlap with major kleptoparasites like lions and leopards, whereas the latter do not show any such pattern. Predators opt for strategies that allow them to maximise their nutrient intake given the constraints of resources like prey density and habitat. It can vary widely for the same species at different parts of their geographical distribution (Sunquist and Sunquist, 1989). Leopards in PTR, which are majorly restricted to suboptimal areas, do not exhibit temporal avoidance of tigers in order to ensure their survival by optimising their hunting opportunities.
4.4 Co-occurrence patterns of tigers and leopards
Both tigers and leopards were captured in 79 % of all the camera stations, but their rate of captures varied significantly. However, in our study, we found no evidence of leopards avoiding tigers at fine spatial–temporal scale, as we did not find any difference between trail usage by leopards following a tiger photo capture and a random trail usage. This pattern was the same at different tiger densities. Homogeneous distribution of the preferred prey species and greater visibility of the study area (Karanth et al., 2017) might be responsible for the absence of such fine-scale behavioural avoidance mechanisms.
We used only camera trap-based data for this study, so any reactive avoidance (Broekhuis et al., 2013) of leopards towards tigers could not be observed. We did not encounter any evidence of intraguild predation or kleptoparasitism during the entire study period, as our study was primarily based on camera traps and ad libitum observations. Behavioural observations of these animals with the help of radiotelemetry where they coexist in high densities can further elucidate their avoidance mechanisms. Additionally, it can generate insights into kill rates and prey handling of these two predators, which are essential in understanding their dietary niche composition and interference interactions (Miller et al., 2014; Elbroch et al., 2014). Such studies have the scope of investigating the process of interspecific social dominance and coexistence of sympatric predators effectively.
Leopards co-occur with tigers in majority of the places in Asia and they have the most widespread distribution among all the felids (Nowell and Jackson, 1996; Henschel et al., 2008; Odden et al., 2010). Their extent of spatial overlap with intraguild predators is also the highest along with extreme vulnerability to exploitative competition (Caro and Stoner, 2003; Du Preez et al., 2017). Intraguild competition has the ability to push the subordinate predators in suboptimal habitats, which can impact their survival. However, leopards have been known to use these suboptimal habitats to their maximum extent, which are not preferred by tigers and are areas near human presence (Odden et al., 2010; Athreya et al., 2013), whereas tigers usually need relatively larger undisturbed areas with ample wild prey for their survival (Karanth and Stith, 1999).
Our study provides a record of tiger–leopard co-occurrence patterns over multiple years and generates insights into the behavioural and ecological mechanisms adapted by these two predators. Our findings substantiate the fact that dominant predators can influence the spatial distribution pattern of the subordinate predators, but abundance response depends on habitat features (Ritchie and Johnson, 2009; Broekhuis et al., 2013; Vanak et al., 2013; Swanson et al., 2016; Balme et al., 2017). Our results suggest that areas with a high density of tigers were detrimental for leopard density, and it seems likely that they depress or prevent occupancy of other large carnivores as well (dholes, sloth bears, and wolves) (Steinmetz et al., 2013; Rayan and Linkie, 2016, Lahkar et al., 2021). Our results along with a study of dietary habits of tigers and leopards in PTR (Majumder et al., 2012a) indicate that partitioning of either spatial or dietary niche can aid in two large predators to co-occur, but prey and habitat characteristics also play a crucial role in determining the results of intraguild interactions (Janssen et al., 2007; Harihar et al., 2011; Balme et al., 2017). However, we did not find any evidence of temporal segregation or fine-scale spatio-temporal avoidance between these two sympatric predators.
Our study provides a record of ecological and behavioural adaptations in a natural system to attain co-occurrence. This increases the ecological understanding of these species and provides basis for scientific management programmes. As targeted management practices for one flagship species can negatively affect the subdominant predators (Karanth et al., 2011; Harihar et al., 2011; Lahkar et al., 2021), understanding intraguild interactions of these two sympatric predators is essential. The zeal of increasing tiger abundance can have detrimental impacts on the carnivore community. However, it may be relevant to state that many of the other large carnivores are also found at reasonable densities outside of the PAs (Jhala et al., 2020, 2021). While source populations of tigers are primarily restricted to within PAs even though 40 % of the tiger population of India resides outside of tiger reserves, these are essentially low-density tiger areas which serve as sink habitats. Thus, tigers are a conservation-dependent species and need legal protection.
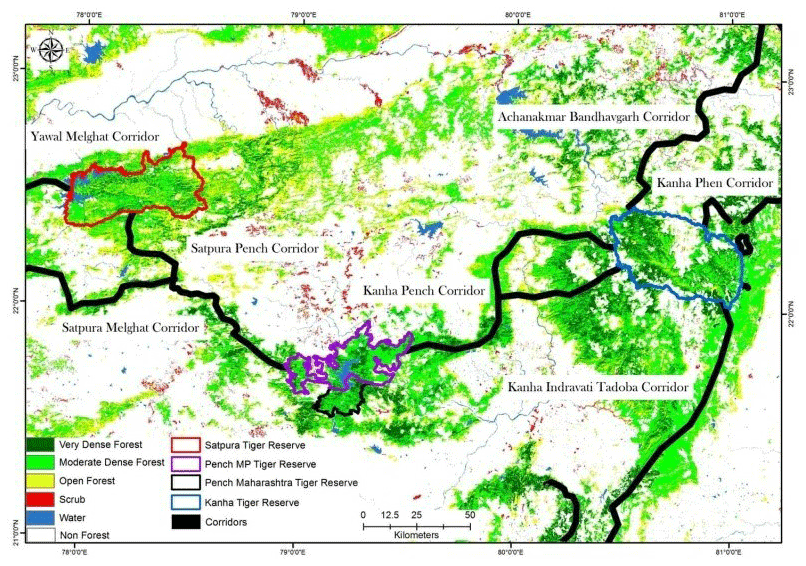
Figure A1Location of Pench Tiger Reserve, Madhya Pradesh, in the central Indian tiger landscape along with its corridors with the surrounding protected areas (PAs). This map is reproduced from a study on connecting tiger populations for long-term conservation (Qureshi et al., 2014).
Table A1Camera trapping efforts in Pench Tiger Reserve, Madhya Pradesh, during 2013–2016, (* MCP: minimum convex polygon).
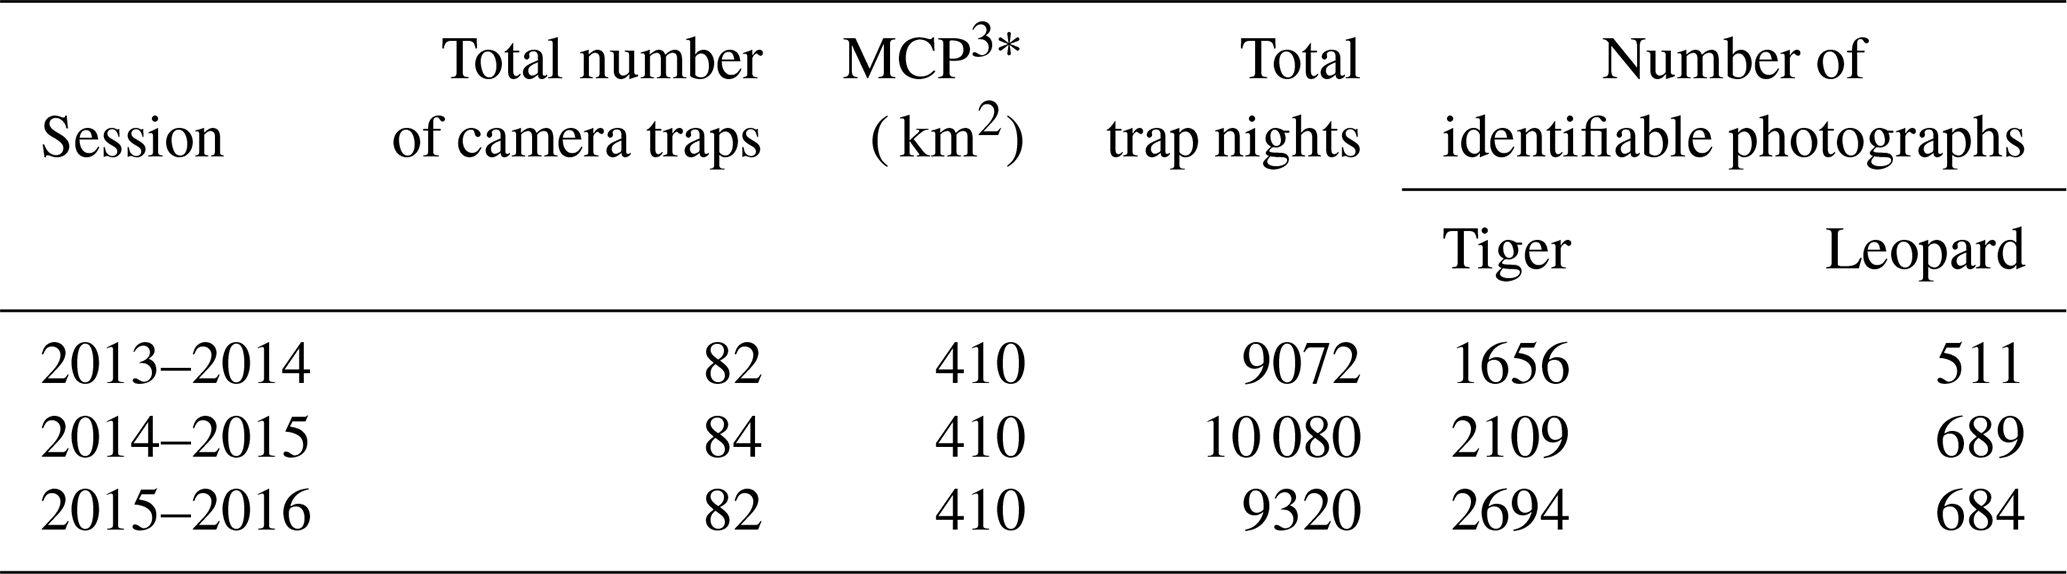
Table A2Details of camera trap-based photographs of individually identified tigers and leopards over the entire study period (2013–2016). The bold highlighted portion includes photo capture details of cubs of tigers and leopards, respectively, which were not included for analysis. NA stands for not applicable.
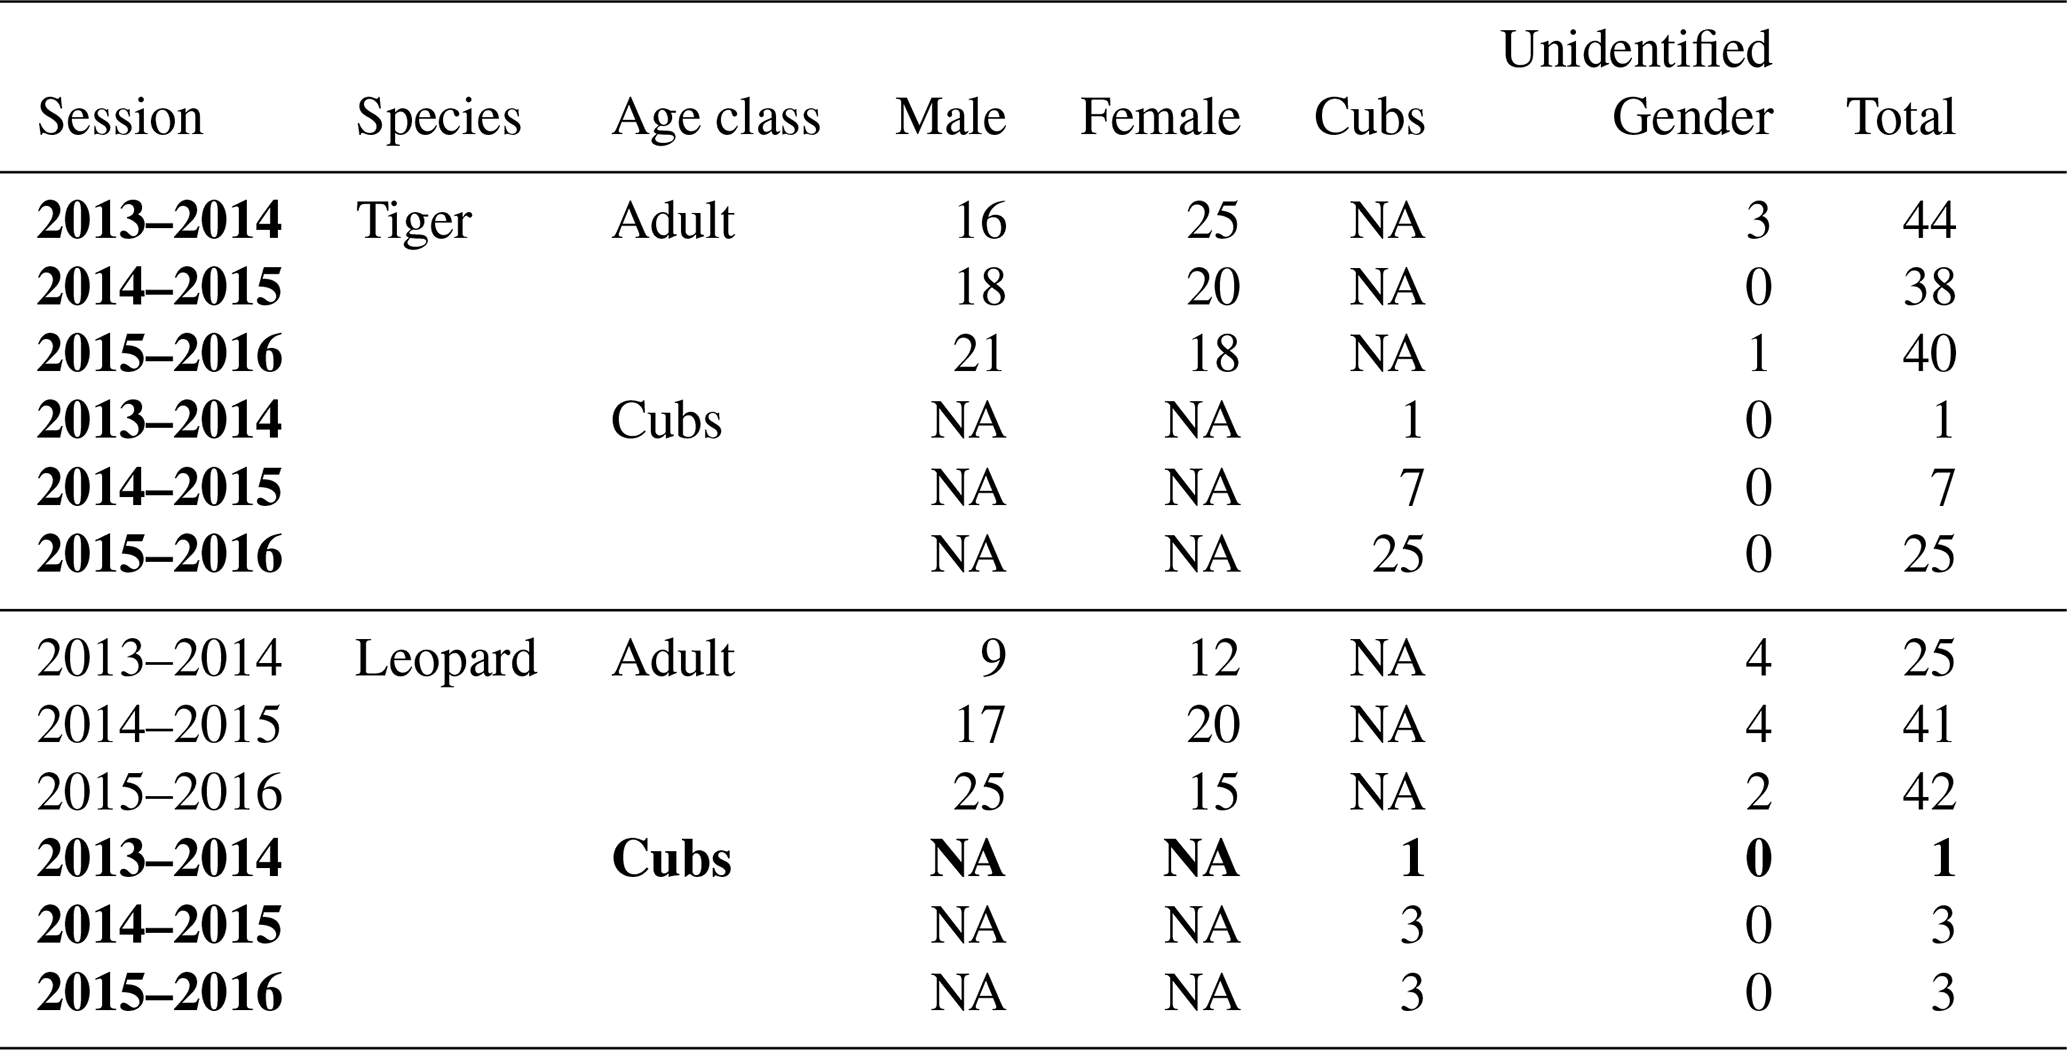
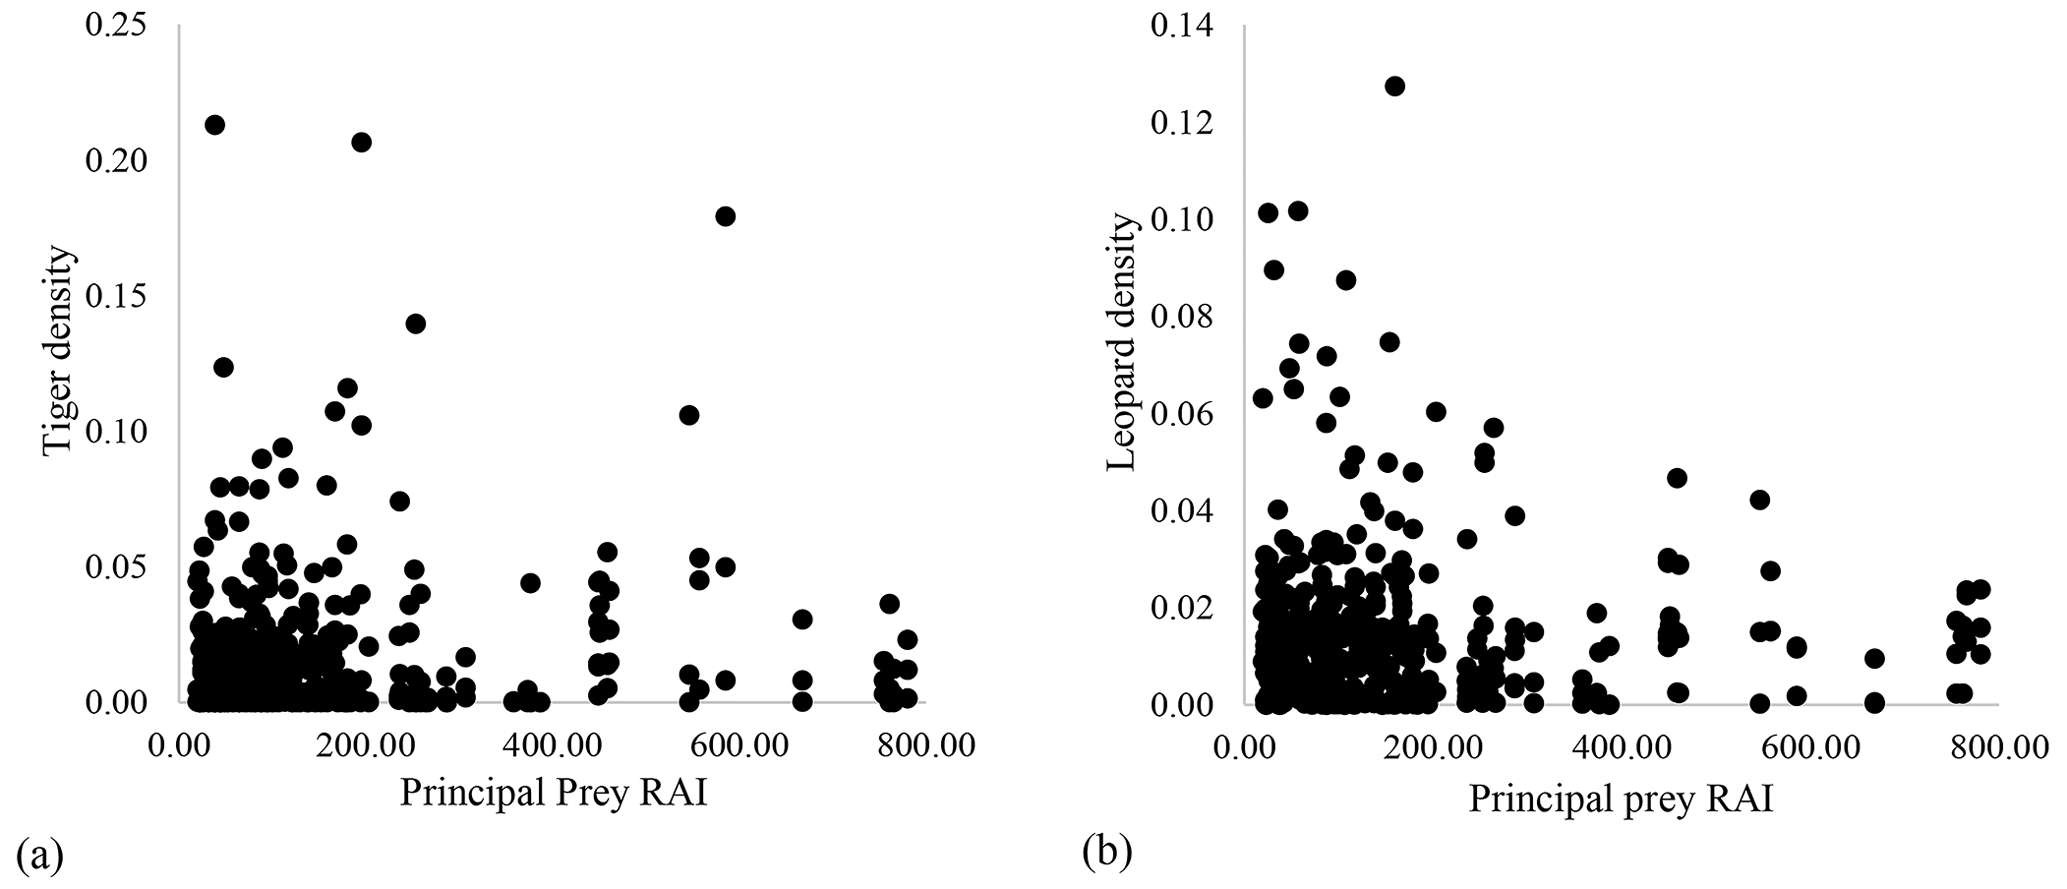
Figure B1Relationship between prey relative abundance index (RAI) and (a) tiger density and (b) leopard density in Pench Tiger Reserve, Madhya Pradesh.
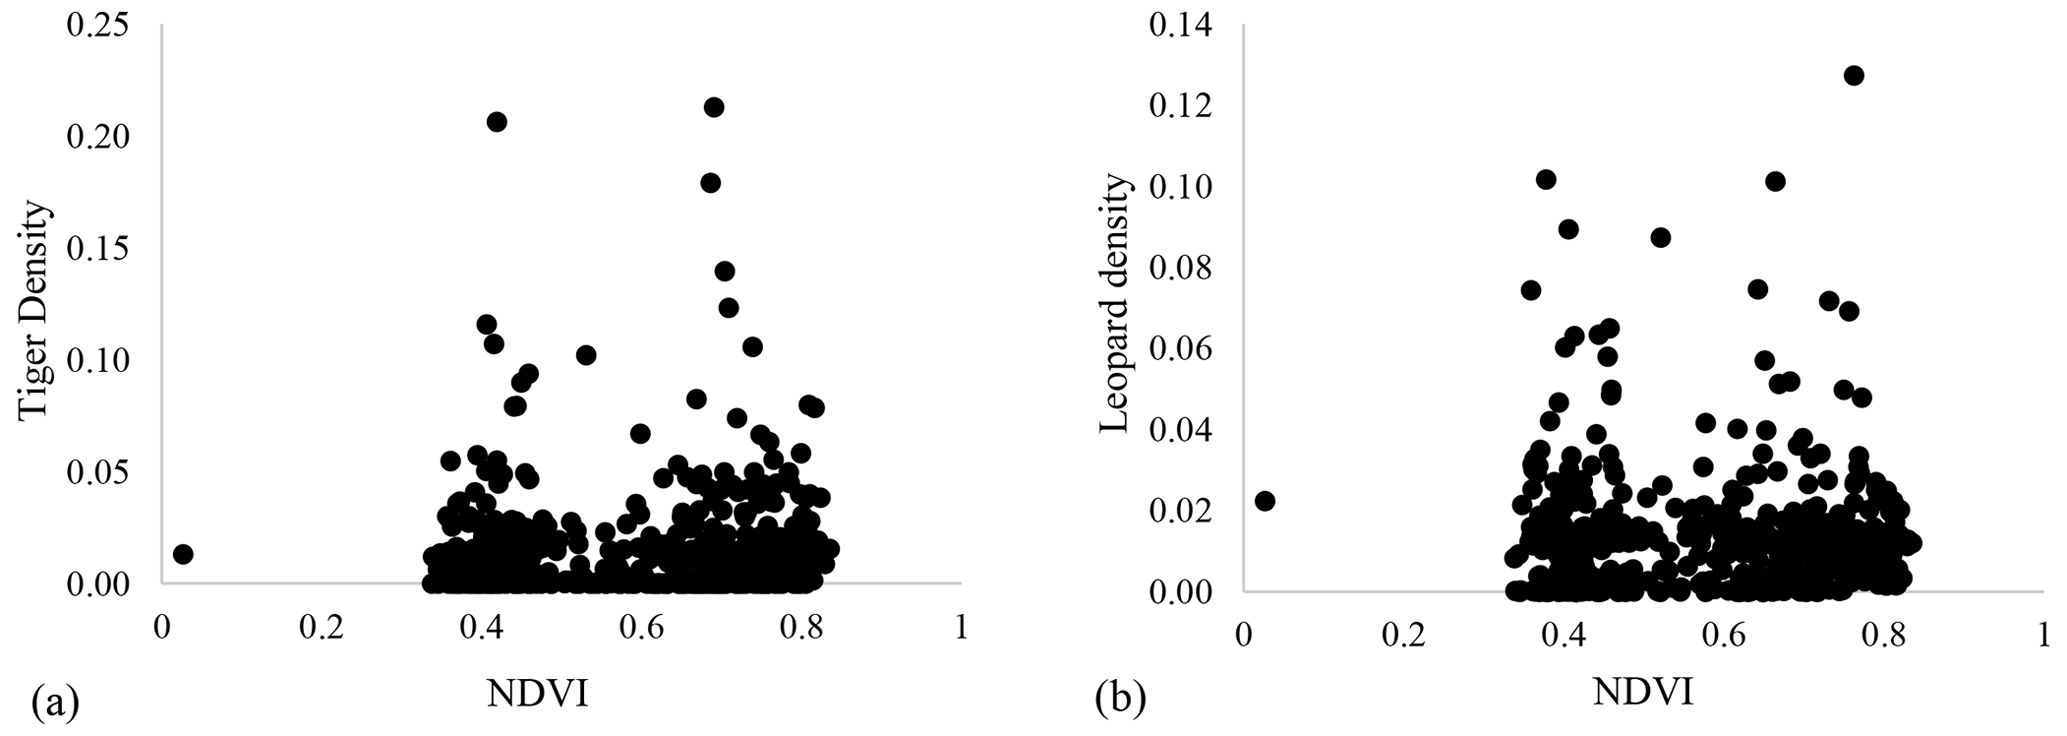
Figure B2Relationship between vegetation cover (NDVI) and (a) tiger density and (b) leopard density in Pench Tiger Reserve, Madhya Pradesh.

Figure B3Slopes of quantile regression of effects on tiger density on leopard density where leopard density declines in higher quantiles.
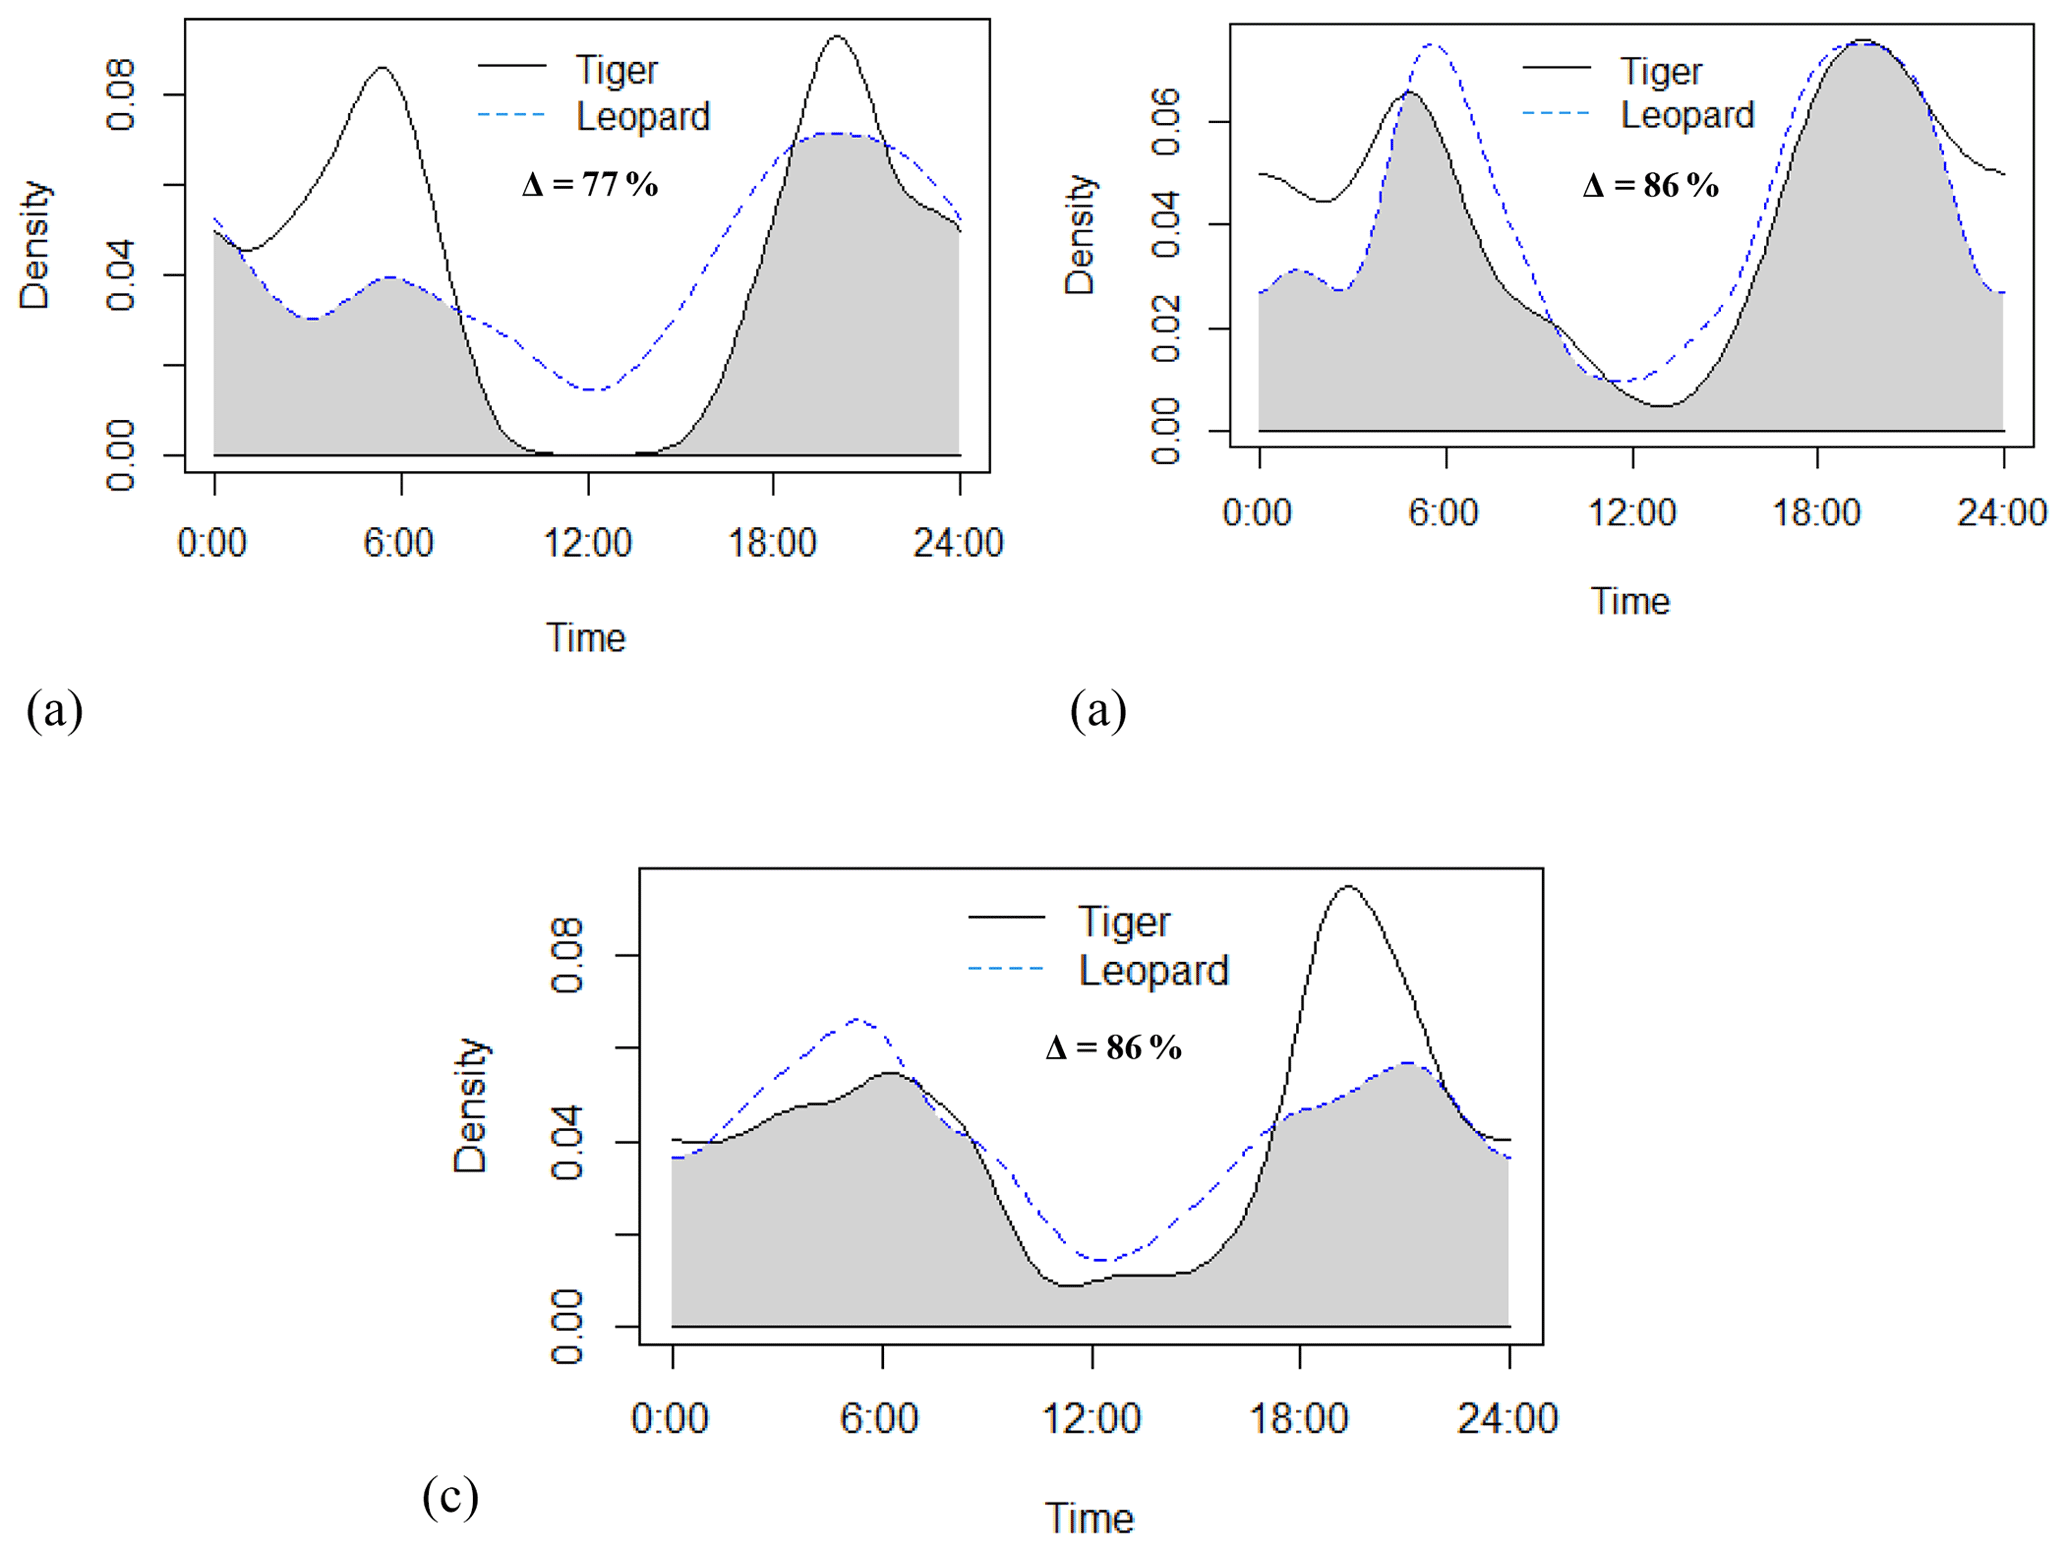
Figure B4Activity curves and extent of temporal overlap between tiger and leopard in (a) low tiger density, (b) medium tiger density, and (c) high tiger density areas in Pench Tiger Reserve, Madhya Pradesh.
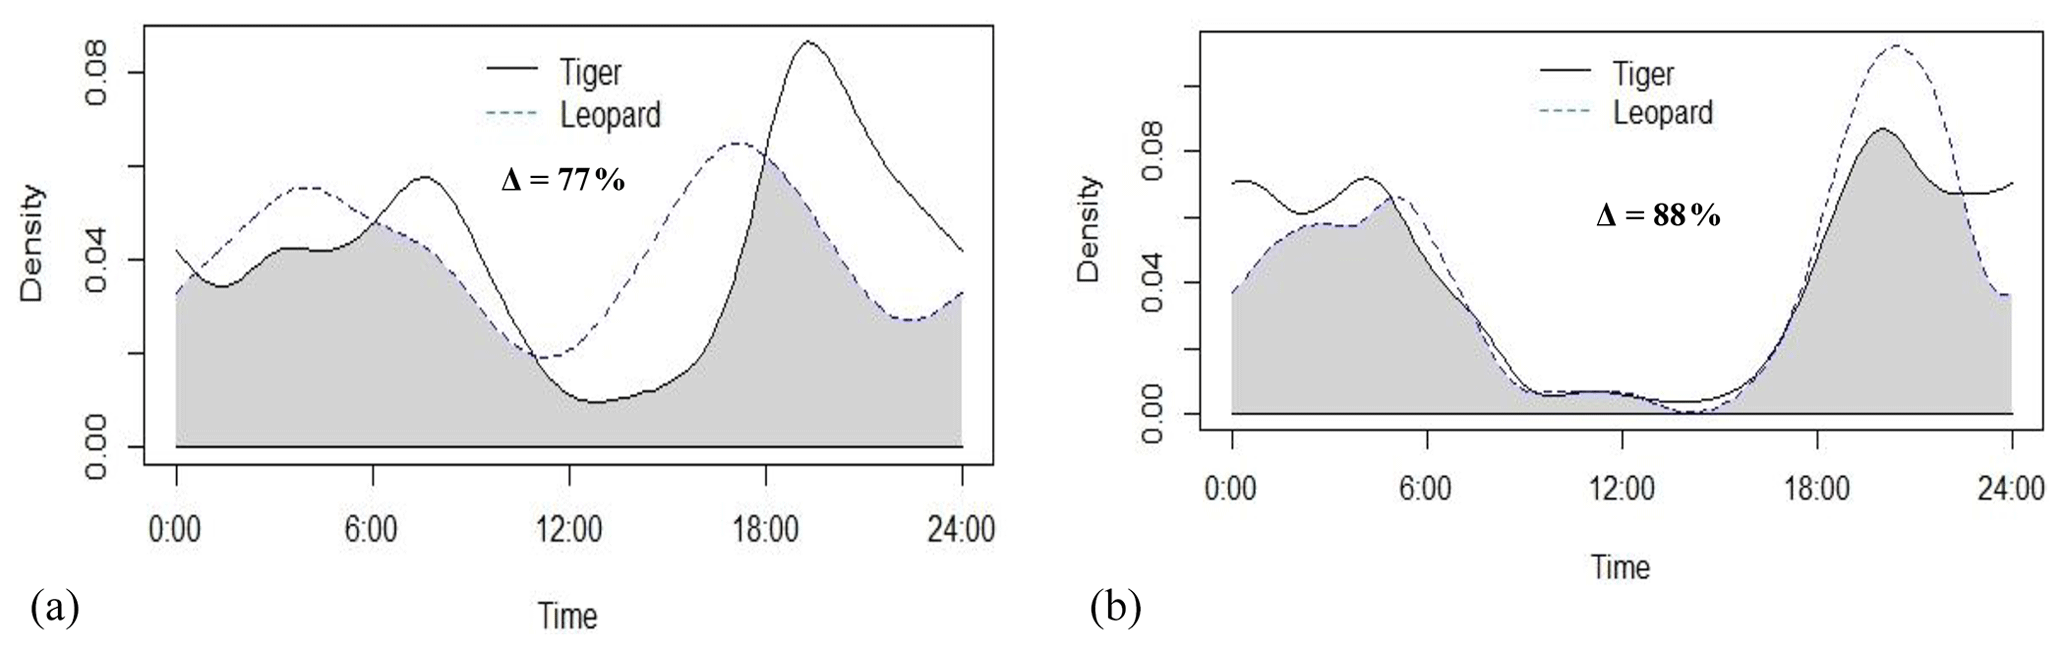
Figure B5Activity curves and extent of temporal overlap between tiger and leopard in (a) 2014 and (b) 2015 in Pench Tiger Reserve, Madhya Pradesh.
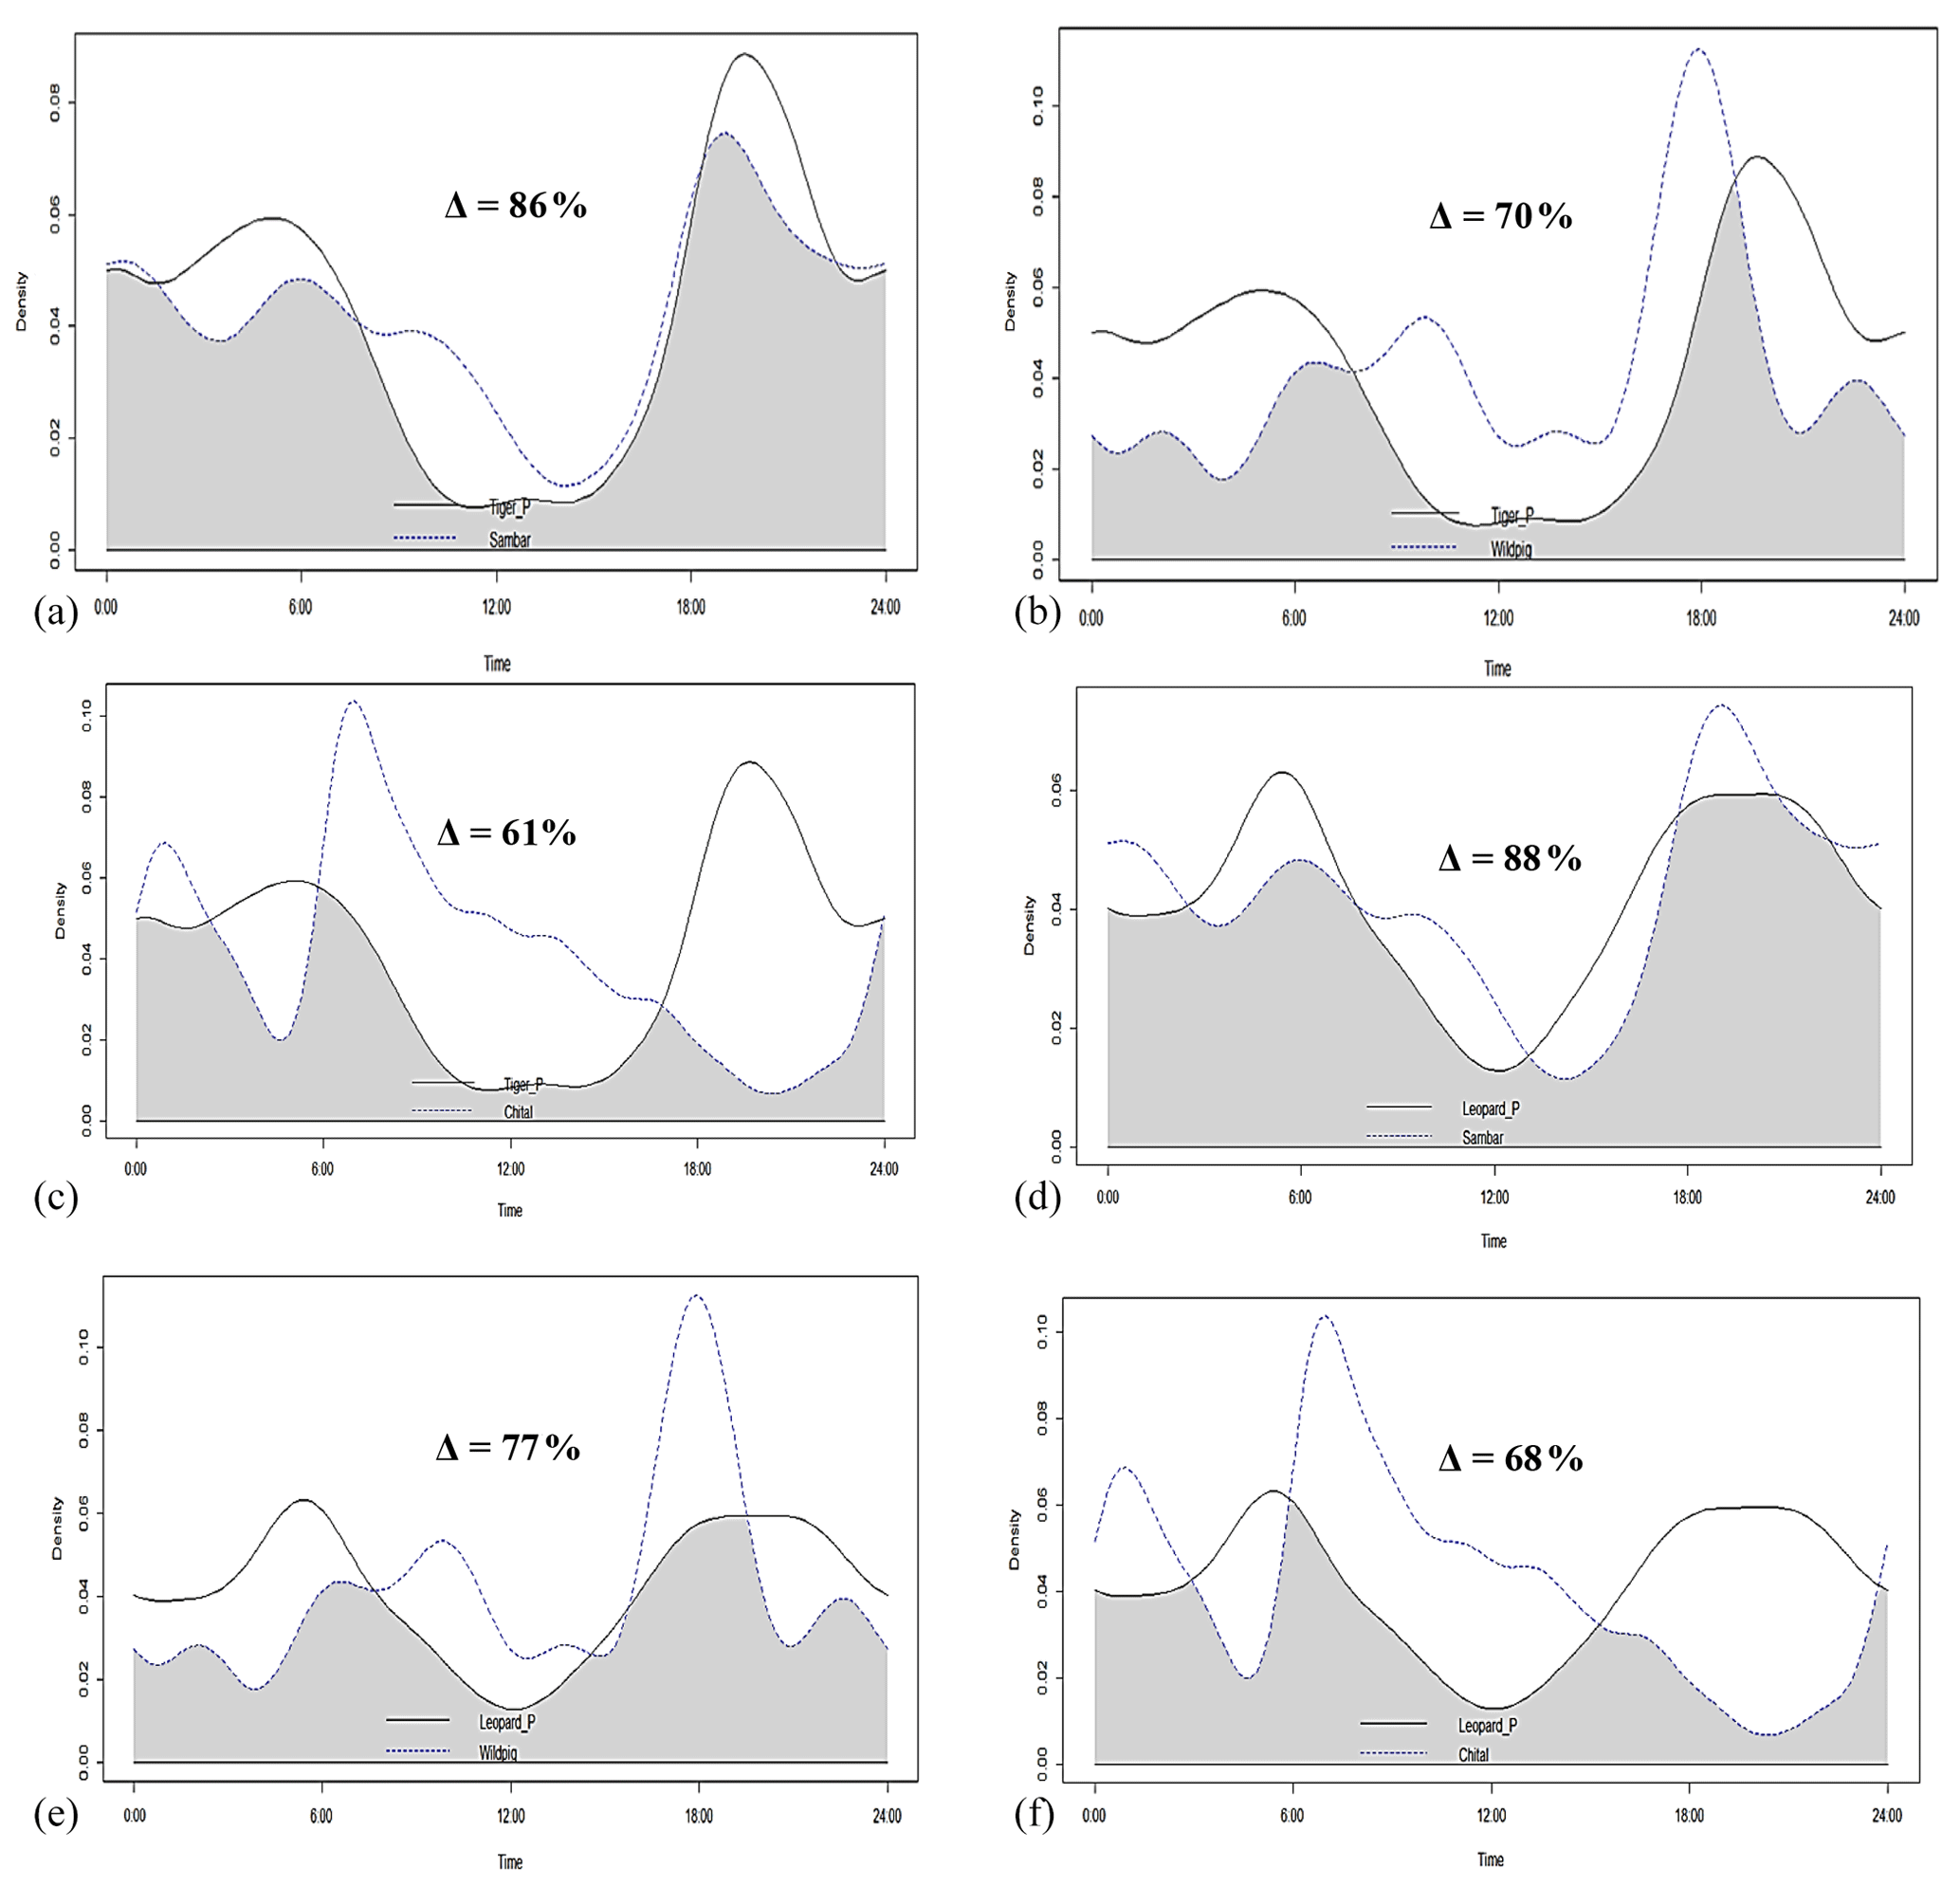
Figure B6Activity curves and extent of temporal overlap between (a) tiger and sambar, (b) tiger and wild pig, (c) tiger and chital, (d) leopard and sambar, (e) leopard and wild pig, and (f) leopard and chital in Pench Tiger Reserve, Madhya Pradesh.
The data and code are available from the authors. Tigers and leopards are listed as schedule I species under the Wildlife Protection Act (1972) of India. As the data contain sensitive information on capture locations of these species, the information on capture locations cannot be shared. This type of sensitive information cannot be uploaded on the public domain from the fear of misuse of the information.
All authors have contributed to this study. KS, YVJ, and QQ designed this study. ABC carried out the analysis. ABC prepared the paper with contributions from all co-authors.
The contact author has declared that none of the authors has any competing interests.
Publisher's note: Copernicus Publications remains neutral with regard to jurisdictional claims in published maps and institutional affiliations.
We would like to take this opportunity to thank the Chief Wildlife Warden (CWLW) of Madhya Pradesh Forest Department (MPFD), field directors Alok Kumar (AK) and Subharanjan Sen (SS), and the Director and Dean of the Wildlife Institute of India. We express our sincere gratitude to the anonymous reviewers for the extremely helpful insights. We thank Ujjwal Kumar (UK) and Shivam Shrotriya (SSH) for their help in analysing the data. We are also grateful to Akanksha Saxena (AS) and Sudip Banerjee (SB) for their valuable inputs in rewriting the paper. We also thank our field assistants, Ghudan Laal Sirsam (GLS), Mithilesh Sirsam (MS), and Ashok Uike (AU), for assisting us in the fieldwork.
This research has been supported by the Wildlife Institute of India, Ministry of Environment, Forest and Climate Change.
This paper was edited by Ricardo Rocha and reviewed by Dipanjan Naha and two anonymous referees.
Amarasekare, P.: Coexistence of intraguild predators and prey in resource-rich environments, Ecology, 89, 2786–2797, https://doi.org/10.1890/07-1508.1, 2008.
Athreya, V., Odden, M., Linnell, J. D., Krishnaswamy, J., and Karanth, U.: Big cats in our backyards: persistence of large carnivores in a human dominated landscape in India, PloS one, 8, e57872, https://doi.org/10.1371/journal.pone.0057872, 2013.
Balme, G. A., Pitman, R. T., Robinson, H. S., Miller, J. R. B., Funston, P. J., and Hunter, L. T. B.: Leopard distribution and abundance is unaffected by interference competition with lions, Behavl. Ecol., 28, 1348–1358, https://doi.org/10.1093/beheco/arx098, 2017.
Begon, M., Harper, J. L., and Townsend, C. R.: Ecology: Individuals, Populations and Communities, Blackwell Scientific Publications, Oxford, 1068 pp., https://www.cabdirect.org/cabdirect/abstract/19870540497 (last access: 23 June 2022), 1990.
Bisht, S., Banerjee, S., Qureshi, Q., and Jhala, Y.: Demography of a high-density tiger population and its implications for tiger recovery, J. Appl. Ecol., 56, 1725–1740, https://doi.org/10.1111/1365-2664.13410, 2019.
Borchers, D. L. and Efford, M. G.: Spatially explicit maximum likelihood methods for capture–recapture studies, Biometrics, 64, 377–385, https://doi.org/10.1111/j.1541-0420.2007.00927.x, 2008.
Brawata, R. L.: Does management of a top carnivore influence the response of mesopredators and prey to rainfall in arid ecosystems? Evidence for a Baseline Density theory, Aust. Zool., 41, 417–432, https://doi.org/10.7882/AZ.2021.007, 2021.
Broekhuis, F., Cozzi, G., Valeix, M., McNutt, J. W., and Macdonald, D. W.: Risk avoidance in sympatric large carnivores: reactive or predictive?, J. Anim. Ecol., 82, 1098–1105, https://doi.org/10.1111/1365-2656.12077, 2013.
Burnham, K. P. and Anderson, D. R.: A practical information-theoretic approach, Model selection and multimodel inference, 2, Second. NY: Springer-Verlag, 63.2020, 488 pp., https://caestuaries.opennrm.org/assets/06942155460a79991fdf1b57f641b1b4/application/pdf/burnham_anderson2002.pdf (last access: 22 January 2022), 2002.
Cade, B. S. and Noon, B. R.: A gentle introduction to quantile regression for ecologists. Front, Ecol. Environ., 1, 412–420, https://doi.org/10.1890/1540-9295(2003)001[0412:AGITQR]2.0.CO;2, 2003.
Cade, B. S., Terrell, J. W., and Porath, M. T.: Estimating fish body condition with quantile regression, N. Am. J. Fish. Manag., 28, 349–359, https://doi.org/10.1577/M07-048.1, 2008.
Carbone, C., Du Toit, J. T., and Gordon, I. J.: Feeding success in African wild dogs: does hunting by spotted hyenas influence kleptoparasitism group size?, J. Anim. Ecol., 66, 318–326, https://doi.org/10.2307/5978, 1997.
Cardillo, M., Purvis, A., Sechrest, W., Gittleman, J. L., Bielby, J., Mace, G. M., and Moritz, C.: Human population density and extinction risk in the world's carnivores, PLoS Biol., 2, p.e197, https://doi.org/10.1371/journal.pbio.0020197, 2004.
Caro, T. M. and Stoner, C. J.: The potential for interspecific competition among African carnivores, Biol. Conserv., 110, 67–75, https://doi.org/10.1016/S0006-3207(02)00177-5, 2003.
Carter, N., Jasny, M., Gurung, B., and Liu, J.: Impacts of people and tigers on leopard spatiotemporal activity patterns in a global biodiversity hotspot, Glob. Ecol. Conserv., 3, 149–162, https://doi.org/10.1016/j.gecco.2014.11.013, 2015.
Champion, H. G. and Seth, S. K.: A revised survey of the forest types of India. Manager of Publications, Govt. of India, New Delhi, p. 404, https://books.google.co.in/books?hl=en&lr=&id=hIjwAAAAMAAJ&oi=fnd&pg=PR15&dq=A+revised+survey+of+the+forest+types+of+India&ots=lDzT6Eo6tX&sig=NPK0eedpamn6Gp4K6ctkV0LCQxU#v=onepage&q=A revised survey of the forest types of India&f=false (last access: 28 July 2022), 1968.
Chapron, G., Kaczensky, P., Linnell, J. D., Von Arx, M., Huber, D., Andrén, H., López-Bao, V., Adamec, M., Álvares, F., Anders, O., and Balčiauskas, L.: Recovery of large carnivores in Europe's modern human-dominated landscapes, Science, 346, 1517–1519, https://doi.org/10.1126/science.1257553, 2014.
Chatterjee, A. B., Sankar, K., and Qureshi, Q.: Density and Distribution of Principal Prey Species of Tigers and Leopards in Pench Tiger Reserve, Madhya Pradesh, J. Ecophysiol. Occup. Health, 22, 15–21, https://doi.org/10.18311/jeoh/2022/29182, 2022.
Crall, J. P., Stewart, C. V., Berger-Wolf, T. Y., Rubenstein, D. I., and Sundaresan, S. R.: Hotspotter – patterned species instance recognition, in: 2013 IEEE workshop on applications of computer vision (WACV), 230–237, IEEE, https://doi.org/10.1109/WACV.2013.6475023, 2013.
Creel, S. and Creel, N. M.: Limitation of African wild dogs by competition with larger carnivores, Conser. Biol., 10, 526–538, https://doi.org/10.1046/j.1523-1739.1996.10020526.x, 1996.
Creel, S.: Four factors modifying the effect of competition on carnivore population dynamics as illustrated by African wild dogs, Conserv. Biol., 15, 271–274, https://doi.org/10.1111/j.1523-1739.2001.99534.x, 2001.
Crooks, K. R. and Soulé, M. E.: Mesopredator release and avifaunal extinctions in a fragmented system, Nature, 400, 563–566, 1999.
Curveira-Santos, G., Gigliotti, L., Silva, A. P., Sutherland, C., Foord, S., Santos-Reis, M., and Swanepoel, L. H.: Broad aggressive interactions among African carnivores suggest intraguild killing is driven by more than competition, Ecology, 103, p. e03600, https://doi.org/10.1002/ecy.3600, 2021.
Cusack, J. J., Dickman, A. J., Kalyahe, M., Rowcliffe, J. M., Carbone, C., MacDonald, D. W., and Coulson, T.: Revealing kleptoparasitic and predatory tendencies in an African mammal community using camera traps: a comparison of spatiotemporal approaches, Oikos, 126, 812–822, https://doi.org/10.5061/dryad.br86d, 2017.
de Oliveira, T. G. and Pereira, J. A.: Intraguild predation and interspecific killing as structuring forces of carnivoran communities in South America, J. Mamm. Evolut., 21, 427–436, https://doi.org/10.1007/s10914-013-9251-4, 2014.
Di Minin, E., Slotow, R., Hunter, L. T. B., Montesino Pouzols, F., Toivonen, T., Verburg, P. H., Williams, N., Lisanne, P., and Moilanen, A.: Global priorities for national carnivore conservation under land use change, Sci. Rep., 6, 23814, https://doi.org/10.1038/srep23814, 2016.
Dinerstein, E., Loucks, C., Wikramanayake, E., Ginsberg, J., Sanderson, E., Seidensticker, J., Forrest, J., Bryja,G., Heydlauff,A., Klenzendorf, S., Leimgruber, P., Mills, J., O'Brien, T. G., Shrestha, M., Simons, R., and Songer, M.: The fate of wild tigers, Bioscience, 57, 508–514, https://doi.org/10.1641/B570608, 2007.
Donadio, E. and Buskirk, S. W.: Diet, morphology, and interspecific killing in Carnivora ,The Am. Nat., 167, 524–536, https://doi.org/10.1086/501033, 2006.
Du Preez, B., Purdon, J., Trethowan, P., Macdonald, D. W., and Loveridge, A. J.: Dietary niche differentiation facilitates coexistence of two large carnivores, J. Zool., 302, 149–156, https://doi.org/10.1111/jzo.12443, 2017.
Durant, S. M.: Competition refuges and coexistence: an example from Serengeti carnivores, J. Anim. Ecol., 67, 370–386, https://doi.org/10.1046/j.1365-2656.1998.00202.x, 1998.
Durant, S. M., Craft, M. E., Foley, C., Hampson, K., Lobora, A. L., Msuha, M., Eblate, E., Bukombe, J., Mchetto, J., and Pettorelli, N.: Does size matter? An investigation of habitat use across a carnivore assemblage in the Serengeti, Tanzania, J. Anim. Ecol., 79, 1012–1022, https://doi.org/10.1111/j.1365-2656.2010.01717.x, 2010.
Dutta, T., Sharma, S., Maldonado, J. E., Wood, T. C., Panwar, H. S., and Seidensticker, J.: Gene flow and demographic history of leopards (Panthera pardus) in the central Indian highlands, Evol. Appl., 6, 949–959, https://doi.org/10.1111/ddi.12024, 2013.
Dutta, T., Sharma, S., McRae, B. H., Roy, P. S., and DeFries, R.: Connecting the dots: mapping habitat connectivity for tigers in central India, Reg. Environ. Change, 16, 53–67, https://doi.org/10.1007/s10113-015-0877-z, 2016.
Efford, M.: Density estimation in live-trapping studies, Oikos, 106, 598–610, https://doi.org/10.1111/j.0030-1299.2004.13043.x, 2004.
Efford, M.: SECR-spatially explicit capture-recapture in R., University of Otago, Dunedin, 20 pp., https://cran.r-project.org/web/packages/secr/vignettes/secr-overview.pdf (last access: 22 June 2022), 2011.
Efford, M.: secr 2.9-spatially explicit capture–recapture in R, 25 pp., https://cran.r-project.org/web/packages/secr/vignettes/secr-overview.pdf (last access: 22 June 2022), 2015.
Efford, M.: secr design-sampling design for spatially explicit capture–recapture, https://link.springer.com/chapter/10.1007/978-0-387-78151-8_11 (last access: 22 June 2022), 2018.
Efford, M. G. and Mowat, G.: Compensatory heterogeneity in spatially explicit capture–recapture data, Ecology,, 95, 1341–1348, https://doi.org/10.1890/13-1497.1, 2014.
Efford, M. G., Borchers, D. L., and Byrom, A. E.: Density estimation by spatially explicit capture–recapture: likelihood-based methods, in: Modeling demographic processes in marked populations, 255–269, Springer, Boston, MA, https://doi.org/10.1007/978-0-387-78151-8_11, 2009.
Elbroch, L. M., Allen, M. L., Lowrey, B. H., and Wittmer, H. U.: The difference between killing and eating: ecological shortcomings of puma energetic models, Ecosphere, 5, 1–16, https://doi.org/10.1890/ES13-00373.1, 2014.
Elmhagen, B. and Rushton, S. P.: Trophic control of mesopredators in terrestrial ecosystems: top-down or bottom-up?, Ecol. Lett., 10, 197–206, https://doi.org/10.1111/j.1461-0248.2006.01010.x, 2007.
Estes, J. A., Terborgh, J., Brashares, J. S., Power, M. E., Berger, J., Bond, W. J., Carpenter, S. R., Essington, T. E., Holt, R. D., Jackson, J. B. C., Marquis, R. J., Oksanen, L., Oksanen, T., Paine, R. T., Pikitch, E. K., Ripple, W. J., Sandin, S. A., Scheffer, M., Schoener, T. W., Shurin, J.B., Sinclair, A. R. E., Soule, M. E., Virtanen, R., and Wardle, D. A. Trophic downgrading of planet Earth, Science, 333, 301–306, https://doi.org/10.1126/science.1205106, 2011.
Farris, Z. J., Gerber, B. D., Karpanty, S., Murphy, A., Wampole, E., Ratelolahy, F., and Kelly, M. J.: Exploring and interpreting spatiotemporal interactions between native and invasive carnivores across a gradient of rainforest degradation, Biol. Invasions, 22, 2033–2047, https://doi.org/10.1007/s10530-020-02237-1, 2020.
Fenn, M. G. and Macdonald, D. W.: Use of middens by red foxes: risk reverses rhythms of rats, J. Mammal., 76, 130–136, https://doi.org/10.2307/1382321, 1995.
Foster, V. C., Sarmento, P., Sollmann, R., Tôrres, N., Jácomo, A. T., Negrões, N., Fonseca, C., and Silveira, L.: Jaguar and puma activity patterns and predator-prey interactions in four Brazilian biomes, Biotropica, 45, 373–379, https://doi.org/10.1111/btp.12021, 2013.
Halle, S.: Ecological relevance of daily activity patterns, in: Activity Patterns in Small Mammals: An Ecological Approach, edited by: Halle, S. and Stenseth, N. C., Springer, New York, 67–90, https://link.springer.com/chapter/10.1007/978-3-642-18264-8_5 (last access: 30 June 2022), 2000.
Harihar, A., Pandav, B., and Goyal, S. P.: Responses of leopard Panthera pardus to the recovery of a tiger Panthera tigris population, J. Appl. Ecol., 48, 806–814, https://doi.org/10.1111/j.1365-2664.2011.01981.x, 2011.
Hayward, M. W. and Slotow, R.: Temporal partitioning of activity in large African carnivores: tests of multiple hypotheses, S. Afr. J. Wildl. Res.-24-month delayed open access, 39, 109–125, 2009.
Hayward, M. W., Hofmeyr, M., O'brien, J., and Kerley, G. I.: Prey preferences of the cheetah (Acinonyx jubatus)(Felidae: Carnivora): morphological limitations or the need to capture rapidly consumable prey before kleptoparasites arrive?, J. Zool., 270, 615–627, https://doi.org/10.1111/j.1469-7998.2006.00184.x, 2006.
Hayward, M. W., O'Brien, J., and Kerley, G. I.: Carrying capacity of large African predators: predictions and tests, Biol. Conserv., 139, 219–229, https://doi.org/10.1016/j.biocon.2007.06.018, 2007.
Henschel, P., Hunter, L., Breitenmoser, U., Purchase, N., Packer, C., Khorozyan, I., Bauer, H., Marker, L., Sogbohossou, E., and Breitenmoser-Wursten, C.: Panthera pardus, The IUCN Red List of Threatened Species 2008, e.T15954A5329380, https://doi.org/10.2305/IUCN.UK.2008.RLTS.T15954A5329380.en, 2008.
Hoeks, S., Huijbregts, M. A., Busana, M., Harfoot, M. B., Svenning, J. C., and Santini, L.: Mechanistic insights into the role of large carnivores for ecosystem structure and functioning, Ecography, 43, 1752–1763, https://doi.org/10.1111/ecog.05191, 2020.
Iyengar, E. V.: Kleptoparasitic interactions throughout the animal kingdom and a reevaluation, based on participant mobility, of the conditions promoting the evolution of kleptoparasitism, Biol. J. Linn. Soc., 93, 745–762, https://doi.org/10.1111/j.1095-8312.2008.00954.x, 2008.
Janssen, A., Sabelis, M. W., Magalhães, S., Montserrat, M., and Van der Hammen, T.: Habitat structure affects intraguild predation, Ecology, 88, 2713–2719, https://doi.org/10.1890/06-1408.1, 2007.
Jhala, Y. V., Gopal, R., and Qureshi, Q. (Eds.): Status of tigers, copredators and prey in India, National Tiger Conservation Authority, Government of India, New Delhi and Wildlife Institute of India, Dehradun, TR 08/001, 151 pp., National Tiger Conservation Authority and Wildlife Institute of India, http://indiaenvironmentportal.org.in/files/tiger.pdf (last access: 30 June 2022), 2008.
Jhala, Y. V., Qureshi, Q., and Gopal, R. (Eds.): Status of tigers, copredators and prey in India 2014, National Tiger Conservation Authority, Government of India, New Delhi and Wildlife Institute of India, Dehradun, https://ntca.gov.in/assets/uploads/Reports/AITM/AITE_2014_fullreport.pdf (last access: 30 June 2022), 2015.
Jhala, Y. V., Qureshi, Q., and Nayak, A. K. (Eds.): Status of tigers, copredators and prey in India, 2018. National Tiger Conservation Authority, Government of India, New Delhi, and Wildlife Institute of India, Dehradun, https://www.researchgate.net/publication/262561266_Niche-complementarity_of_South_American_foxes_Reanalysis_and_test_of_a_hypothesis (last access: 15 October 2022), 2020.
Jhala, Y. V., Qureshi, Q., and Yadav, S. P. (Eds.): Status of Leopards, co-predators and megaherbivores in India, 2018, National Tiger Conservation Authority, Government of India, New Delhi, and Wildlife Institute of India, Dehradun, https://ntca.gov.in/assets/uploads/Reports/AITM/Status_Leopard_Report_2018_web.pdf (last access: 30 June 2022), 2021.
Jiménez, J.: Niche-complementarity of South American foxes: reanalysis and test of a hypothesis, https://www.researchgate.net/publication/262561266_Niche-complementarity_of_South_American_foxes_Reanalysis_and_test_of_a_hypothesi (last access: 15 Ocotber 2022), 1996.
Johnsingh, A. J. T.: Prey selection in three large sympatric carnivores in Bandipur, Mammalia, https://doi.org/10.1515/mamm.1992.56.4.517, 1992.
Johnson, W. E. and Franklin, W. L.: Role of body size in the diets of sympatric gray and culpeo foxes, J. Mammal., 75, 163–174, https://doi.org/10.2307/1382248, 1994.
Kafley, H., Lamichhane, B. R., Maharjan, R., Khadka, M., Bhattarai, N., and Gompper, M. E.: Tiger and leopard co-occurrence: intraguild interactions in response to human and livestock disturbance, Basic Appl. Ecol., 40, 78–89, https://doi.org/10.1016/j.baae.2019.07.007, 2019.
Karanth, K. U.: Estimating tiger Panthera tigris populations from camera-trap data using capture – recapture models, Biol. Conserv., 71, 333–338, https://doi.org/10.1016/0006-3207(94)00057-W, 1995.
Karanth, K. U. and Nichols, J. D.: Estimation of tiger densities in India using photographic captures and recaptures, Ecology, 79, 2852–2862, https://doi.org/10.1890/0012-9658(1998)079[2852:EOTDII]2.0.CO;2, 1998.
Karanth, K. U. and Stith, B. M.: Prey depletion as a critical determinant of tiger population viability, in: Riding the tiger: tiger conservation in human dominated landscapes, edited by: Seidensticker, J., Christie, S., and Jackson, P. Cambridge University Press, Cambridge, 100–132, https://go.gale.com/ps/i.do?id=GALE%7CA83451419&sid=googleScholar&v=2.1&it=r&linkaccess=abs&issn=10813705&p=AONE&sw=w&userGroupName=anon%7E2b54c2c8 (last access: 10 October 2022), 1999.
Karanth, K. U. and Sunquist, M. E.: Prey selection by tiger, leopard and dhole in tropical forests, J. Anim. Ecol., 64, 439–450, https://doi.org/10.2307/5647, 1995.
Karanth, K. U. and Sunquist, M. E.: Behavioural correlates of predation by tiger (Panthera tigris), leopard (Panthera pardus) and dhole (Cuon alpinus) in Nagarahole, India, J. Zool., 250, 255–265, https://doi.org/10.1111/j.1469-7998.2000.tb01076.x, 2000.
Karanth, K. U., Gopalaswamy, A. M., Kumar, N. S., Vaidyanathan, S., Nichols, J. D., and MacKenzie, D. I.: Monitoring carnivore populations at the landscape scale: occupancy modelling of tigers from sign surveys, J. Appl. Ecol., 48, 1048–1056, https://doi.org/10.1111/j.1365-2664.2011.02002.x, 2011.
Karanth, K. U., Srivathsa, A., Vasudev, D., Puri, M., Parameshwaran, R., and Kumar, N. S.: Spatio-temporal interactions facilitate large carnivore sympatry across a resource gradient, P. Royal Soc. B, 284, p. 20161860, https://doi.org/10.1098/rspb.2016.1860, 2017.
Koenker, R.: Quantile regression. Cambridge University Press, New York, https://citeseerx.ist.psu.edu/document?repid=rep1&type=pdf&doi=38bc067c8e6817ca75d20deeddca28eaddba55f4. (last access: 28 July 2022), 2005.
Koenker, R. and Bassett, G.: Regression quantiles, Econometrica, 46, 33–50, https://doi.org/10.2307/1913643, 1978.
Kolipakam, V., Singh, S., Pant, B., Qureshi, Q., and Jhala, Y. V.: Genetic structure of tigers (Panthera tigris tigris) in India and its implications for conservation, Glob. Ecol. Conserv., 20, p. e00710, https://doi.org/10.1016/j.gecco.2019.e00710, 2019.
Kozlowski, A. J., Gese, E. M., and Arjo, W. M.: Niche overlap and resource partitioning between sympatric kit foxes and coyotes in the Great Basin Desert of western Utah, Am. Midl. Nat., 160, 191–208, https://doi.org/10.1674/0003-0031(2008)160[191:NOARPB]2.0.CO;2, 2008.
Kronfeld-Schor, N. and Dayan, T.: Activity patterns of rodents: the physiological ecology of biological rhythms, Biol. Rhythm Res., 39, 193–211, https://doi.org/10.1080/09291010701683268, 2008.
Kumar, U., Awasthi, N., Qureshi, Q., and Jhala, Y.: Do conservation strategies that increase tiger populations have consequences for other wild carnivores like leopards?, Sci. Rep., 9, 1–8, https://doi.org/10.1038/s41598-019-51213-w, 2019.
Lahkar, D., Ahmed, M. F., Begum, R. H., Das, S. K., and Harihar, A.: Inferring patterns of sympatry among large carnivores in Manas National Park–a prey-rich habitat influenced by anthropogenic disturbances, Anim. Conserv. 24, 589–601, https://doi.org/10.1111/acv.12662, 2021.
Lamichhane, B. R., Leirs, H., Persoon, G. A., Subedi, N., Dhakal, M., Oli, B. N., Reynaert, S., Sluydts, V., Pokheral, C. P., Poudyal, L. P., and Malla, S.: Factors associated with co-occurrence of large carnivores in a human-dominated landscape, Biodi. Conserv., 28, 1473–1491, https://doi.org/10.1007/s10531-019-01737-4, 2019.
Levi, T. and Wilmers, C. C.: Wolves–coyotes–foxes: a cascade among carnivores, Ecology, 93, 921–929, https://doi.org/10.1890/11-0165.1, 2012.
Li, Z., Wang, T., Smith, J. L., Feng, R., Feng, L., Mou, P., and Ge, J.: Coexistence of two sympatric flagship carnivores in the human-dominated forest landscapes of Northeast Asia, Landsc. Ecol., 34, 291–305, https://doi.org/10.1007/s10980-018-0759-0, 2018.
Lima, S. L.: Putting predators back into behavioral predator–prey interactions, Trends Ecol. Evol., 17, 70–75, https://doi.org/10.1016/S0169-5347(01)02393-X, 2002.
Linkie, M. and Ridout, M. S.: Assessing tiger–prey interactions in Sumatran rainforests, J. Zool., 284, 224–229, https://doi.org/10.1111/j.1469-7998.2011.00801.x, 2011.
Linnell, J. D. and Strand, O.: Interference interactions, coexistence and conservation of mammalian carnivores, Divers. Distrib., 6, 169–176, https://doi.org/10.1046/j.1472-4642.2000.00069.x, 2000.
Lucherini, M., Reppucci, J. I., Walker, R. S., Villalba, M. L., Wurstten, A., Gallardo, G., Iriarte, A., Villalobos, R., and Perovic, P.: Activity pattern segregation of carnivores in the high Andes, J. Mammal., 90, 1404–1409, https://doi.org/10.1644/09-MAMM-A-002R.1, 2009.
Majumder, A., Basu, S., Sankar, K., Qureshi, Q., Jhala, Y. V., and Gopal, R.: Prey selection, food habits and temporal activity patterns of sympatric carnivores in Pench Tiger Reserve, Madhya Pradesh, Central India, Sci. Trans. Env. Technovation, 5, 110–120, 2012a.
Majumder, A., Basu, S., Sankar, K., Qureshi, Q., Jhala, Y. V., Nigam, P., and Gopal, R.: Home ranges of the radio-collared Bengal tigers (Panthera tigris tigris L.) in Pench Tiger Reserve, Madhya Pradesh, Central India, Wildl Biol Pract, 8, 36–49, https://doi.org/10.2461/wbp.2012.8.4, 2012b.
Majumder, A., Sankar, K., Qureshi, Q., and Basu, S.: Predation ecology of large sympatric carnivores as influenced by available wild ungulate prey in a tropical deciduous forest of Central India, J. Trop. Ecol., 417–426, https://doi.org/10.1017/S0266467413000473, 2013.
Mann, H. B. and Whitney, D. R.: On a test of whether one of two random variables is stochastically larger than the other, Ann. Math. Stat., 18, 50–60, https://doi.org/10.1214/aoms/1177730491, 1947.
Mayhew, P.: Discovering Evolutionary Ecology, Oxford University Press, Oxford, https://global.oup.com/academic/product/discovering-evolutionary-ecology-9780198525288?cc=us&lang=en& (last access: 15 October 2022), 2006.
McDougal, C.: The face of the tiger. London, Rivington Books, p. 180, https://www.goodreads.com/en/book/show/4508934-the-face-of-the-tiger (last access: 15 October 2022), 1977.
Meredith, M. and Ridout, M.: Overview of the overlap package, R. Proj, 1–9, https://cran.r-project.org/web/packages/overlap/vignettes/overlap.pdf (last access: 14 June 2022), 2014.
Miller, J. R., Ament, J. M., and Schmitz, O. J.: Fear on the move: predator hunting mode predicts variation in prey mortality and plasticity in prey spatial response, J. Animal ecol., 83, 214–222, https://doi.org/10.1111/1365-2656.12111, 2014.
Miller, J. R., Pitman, R. T., Mann, G. K., Fuller, A. K., and Balme, G. A. Lions and leopards coexist without spatial, temporal or demographic effects of interspecific competition., J. Anim. Ecol., 87, 1709–1726, https://doi.org/10.1111/1365-2656.12883, 2018.
Mills, M. G. L., Freitag, S., and Van Jaarsveld, A. S.: Geographic priorities for carnivore conservation in Africa, Conserv. Biol. Series-Cambridge, 467–483, 2001.
Mitchell, M. S., Hebblewhite, M., Boitani, L., and Powell, R. A.: Carnivore habitat ecology: integrating theory and application, Carnivore ecology and conservation: a handbook of techniques, edited by: Boitani, L. and Powell, R. A., Oxford University Press, London, United Kingdom, 218–255, https://doi.org/10.1093/acprof:oso/9780199558520.003.0010, 2012.
Mondal, K., Gupta, S., Bhattacharjee, S., Qureshi, Q., and Sankar, K.: Response of leopards to re-introduced tigers in Sariska Tiger Reserve, Western India, Int. J. Biodivers. Conserv., 4, 228–236, https://doi.org/10.5897/IJBC12.014, 2012.
Monterroso, P., Alves, P. C., and Ferreras, P.: Catch me if you can: diel activity patterns of mammalian prey and predators, Ethology, 119, 1044–1056, https://doi.org/10.1111/eth.12156, 2013.
Murray, D. L., Boutin, S., and O'Donoghue, M.: Winter habitat selection by lynx and coyotes in relation to snowshoe hare abundance, Can. J. Zool., 72, 1444–1451, https://doi.org/10.1139/z94-191, 1994.
Nowell, K. and Jackson, P.: Wild Cats. Status Survey and Conservation Action Plan, IUCN/SSC Cat Specialist Group, Gland, Switzerland and Cambridge, UK, 421 pp., https://portals.iucn.org/library/node/6998 (last access: 14 June 2022), 1996.
Odden, M., Wegge, P., and Fredriksen, T.: Do tigers displace leopards? If so, why?, Ecol. Res., 25, 875–881, https://doi.org/10.1007/s11284-010-0723-1, 2010.
Palomares, F. and Caro, T. M.: Interspecific killing among mammalian carnivores, Am. Nat., 153, 492–508, https://doi.org/10.1086/303189, 1999.
Paquet, P. C.: Prey use strategies of sympatric wolves and coyotes in Riding Mountain National Park, Manitoba, J. Mammal., 73, 337–343, https://doi.org/10.2307/1382067, 1992.
Paúl, M. J., Layna, J. F., Monterroso, P., and Álvares, F.: Resource partitioning of sympatric African wolves (Canis lupaster) and side-striped Jackals (Canis adustus) in an arid environment from West Africa, Diversity, 12, p. 477, https://doi.org/10.3390/D12120477, 2020.
Pereira, L. M., Owen-Smith, N., and Moleón, M. Facultative predation and scavenging by mammalian carnivores: Seasonal, regional and intra-guild comparisons, Mammal Rev., 44, 44–55, https://doi.org/10.1111/mam.12005, 2014.
Polis, G. A., Myers, C. A., and Holt, R. D.: The ecology and evolution of intraguild predation: potential competitors that eat each other, Annu. Rev. Ecol. Evol. Syst., 20, 297–330, https://doi.org/10.1146/annurev.es.20.110189.001501, 1989.
Prugh, L. R. and Sivy, K. J.: Enemies with benefits: integrating positive and negative interactions among terrestrial carnivores, Ecol. Lett., 23, 902–918, https://doi.org/10.1111/ele.13489, 2020.
Prugh, L. R., Stoner, C. J., Epps, C. W., Bean, W. T., Ripple, W. J., Laliberte, A. S., and Brashares, J. S.: The rise of the mesopredator, Bioscience, 59, 779–791, https://doi.org/10.1525/bio.2009.59.9.9, 2009.
Qureshi, Q., Saini, S., Basu, P., Gopal, R., Raza, R., and Jhala, Y.: Connecting tiger populations for long term conservation. National Tiger Conservation Authority and Wildlife Institute of India, Technical Report TR 2014-02, 240 pp., https://wii.gov.in/images/images/documents/connecting_tiger.pdf (last access: 14 June 2022), 2014.
Ramesh, T., Kalle, R., Sankar, K., and Qureshi, Q.: Spatio-temporal partitioning among large carnivores in relation to major prey species in Western Ghats, J. Zool., 287, 269–275, https://doi.org/10.1111/j.1469-7998.2012.00908.x, 2012.
Rather, T. A., Kumar, S., and Khan, J. A.: Density estimation of tiger and leopard using spatially explicit capture–recapture framework, PeerJ, 9, p.e10634, https://doi.org/10.7717/peerj.10634, 2021.
Rayan, D. M. and Linkie, M.: Managing conservation flagship species in competition: Tiger, leopard and dhole in Malaysia, Biol. Conserv., 204, 360–366, https://doi.org/10.1016/j.biocon.2016.11.009, 2016.
Ridout, M. S. and Linkie, M.: Estimating overlap of daily activity patterns from camera trap data, J Agric. Biol. Environ. Stat., 14, 322–337, 2009.
Ripple, W. J., Larsen, E. J., Renkin, R. A., and Smith, D. W.: Trophic cascades among wolves, elk and aspen on Yellowstone National Park's northern range, Biol. Conserv., 102, 227–234, https://doi.org/10.1016/S0006-3207(01)00107-0, 2001.
Ripple, W. J., Estes, J. A., Beschta, R. L., Wilmers, C. C., Ritchie, E. G., Hebblewhite, M., Berger, J., Elmhagen, B., Letnic, M., Nelson, M. P., and Schmitz, O. J.: Status and ecological effects of the world's largest carnivores, Science, 343, 271–287, https://doi.org/10.1126/science.1241484, 2014.
Ritchie, E. G. and Johnson, C. N.: Predator interactions, mesopredator release and biodiversity conservation, Ecol. Lett., 12, 982–998, https://doi.org/10.1111/j.1461-0248.2009.01347.x, 2009.
Roy, M., Qureshi, Q., Naha, D., Sankar, K., Gopal, R., and Jhala, Y. V.: Demystifying the Sundarban tiger: novel application of conventional population estimation methods in a unique ecosystem, Popul. Ecol., 58, 81–89, https://doi.org/10.1007/s10144-015-0527-9, 2016.
Royle, J. A., Chandler, R. B., Sollmann, R., and Gardner, B.: Spatial capture-recapture, Academic Press, USA, 577 pp., https://www.sciencedirect.com/book/9780124059399/spatial-capture-recapture (last access: 14 June 2022), 2013.
Sadhu, A., Jayam, P. P. C., Qureshi, Q., Shekhawat, R. S., Sharma, S., and Jhala, Y. V.: Demography of a small, isolated tiger (Panthera tigris tigris) population in a semi-arid region of western India, BMC Zool., 2, 1–13, https://doi.org/10.1186/s40850-017-0025-y, 2017.
Saggiomo, L., Picone, F., Esattore, B., and Sommese, A.: An overview of understudied interaction types amongst large carnivores, Food Webs, 12, 35–39, https://doi.org/10.1016/j.fooweb.2017.01.001, 2017.
Sankar, K., Qureshi, Q., Majumder, A., and Basu, S.: Ecology of tigers (Panthera tigris tigris) in Pench Tiger Reserve, Madhya Pradesh, Final report, Wildlife Institute of India, Dehradun, 355 pp., https://www.researchgate.net/publication/313799274_Ecology_of_Tigers_in_Pench_Tiger_Reserve_Madhya_Pradesh_and_Maharasta (last access: 14 June 2022), 2013.
Santos, F., Carbone, C., Wearn, O. R., Rowcliffe, J. M., Espinosa, S., Lima, M. G. M., Ahumada, J. A., Gonçalves, A. L. S., Trevelin, L. C., Alvarez-Loayza, P., and Spironello, W. R.: Prey availability and temporal partitioning modulate felid coexistence in Neotropical forests, PloS one, 14 p. e0213671, https://doi.org/10.1371/journal.pone.0213671, 2019.
Scantlebury, D. M., Mills, M. G. L., Wilson, R. P.,Wilson, J. W., Mills, M. E. J., Durant, S. M., Bennett, N. C., Bradford, P., Marks, N. J., and Speakman, J. R.: Flexible energetics of cheetah hunting strategies provide resistance against kleptoparasitism, Science, 346, 79–81, https://doi.org/10.1126/science.1256424, 2014.
Schaller, G. B.: The Deer and the Tiger, A study of Wildlife in India, The University of Chicago Press, Chicago, p. 384, https://doi.org/10.1126/science.155.3766.1093.a, 1967.
Schoener, T. W.: Resource Partitioning in Ecological Communities: Research on how similar species divide resources helps reveal the natural regulation of species diversity, Science, 185, 27–39, https://doi.org/10.1126/science.185.4145.27, 1974.
Sharma, R. K. and Jhala, Y. V.: Monitoring tiger populations using intensive search in a capture–recapture framework, Popul. Ecol. , 53, 373–381, https://doi.org/10.1007/s10144-010-0230-9 l, 2011.
Sherry, T. W.: Competitive interactions and adaptive strategies of American redstarts and least flycatchers in a northern hardwoods forest, Auk, 96, 265–283, https://doi.org/10.1093/auk/96.2.265, 1979.
Silver, S. C., Ostro, L. E., Marsh, L. K., Maffei, L., Noss, A. J., Kelly, M. J., Wallace, R. B., Gomez, H., and Ayala, G.: The use of camera traps for estimating jaguar Panthera onca abundance and density using capture/recapture analysis, Oryx, 38, 148–154, https://doi.org/10.1017/S0030605304000286, 2004.
Singh, P. and Macdonald, D. W.: Populations and activity patterns of clouded leopards and marbled cats in Dampa Tiger Reserve, India, J. Mammal., 98, 1453–1462, https://doi.org/10.1093/jmammal/gyx104, 2017.
Sollmann, R., Furtado, M. M., Hofer, H., Jácomo, A. T., Tôrres, N. M., and Silveira, L.: Using occupancy models to investigate space partitioning between two sympatric large predators, the jaguar and puma in central Brazil, Mamm. Biol., 77, 41–46, https://doi.org/10.1016/j.mambio.2011.06.011, 2012.
Soulé, M. E., Bolger, D. T., Alberts, A. C., Wrights, J., Sorice, M., and Hill, S.: Reconstructed dynamics of rapid extinctions of chaparral-requiring birds in urban habitat islands, Conserv. Biol., 2, 75–92, https://doi.org/10.1111/j.1523-1739.1988.tb00337.x, 1988.
Steinmetz, R., Seuaturien, N., and Chutipong, W.: Tigers, leopards, and dholes in a half-empty forest: Assessing species interactions in a guild of threatened carnivores, Biol. Conserv., 163, 68–78, https://doi.org/10.1016/j.biocon.2012.12.016, 2013.
Sunarto, S., Kelly, M. J., Parakkasi, K., and Hutajulu, M. B.: Cat coexistence in central S umatra: ecological characteristics, spatial and temporal overlap, and implications for management, J. Zool., 296, 104–115, https://doi.org/10.1111/jzo.12218, 2015.
Sunquist, F. and Sunquist, M.: Tiger moon: tracking the great cats in Nepal, University of Chicago Press, https://press.uchicago.edu/ucp/books/book/chicago/T/bo3645000.html, last access: 14 June 2002.
Sunquist, M. E. and Sunquist, F. C.: Ecological Constraints on Predation by Large Felids, in: Carnivore Behavior, Ecology, and Evolution, edited by: Gittleman, J. L., Springer, Boston, MA, 283–301, https://doi.org/10.1007/978-1-4757-4716-4_11, 1989.
Suraci, J. P., Clinchy, M., Dill, L. M., Roberts, D., and Zanette, L. Y.: Fear of large carnivores causes a trophic cascade, Nat. Commun., 7, 1–7, https://doi.org/10.1038/ncomms10698, 2016.
Svenning, J. C., Gravel, D., Holt, R. D., Schurr, F. M., Thuiller, W., Münkemüller, T., Schiffers, K. H., Dullinger, S., Edwards Jr, T. C., Hickler, T., and Higgins, S. I.: The influence of interspecific interactions on species range expansion rates, Ecography, 37, 1198–1209, https://doi.org/10.1111/j.1600-0587.2013.00574.x, 2014.
Swanson, A., Arnold, T., Kosmala, M., Forester, J., and Packer, C.: In the absence of a “landscape of fear”: How lions, hyenas, and cheetahs coexist, Ecol. Evol., 6, 8534–8545, https://doi.org/10.1002/ece3.2569, 2016.
Terborgh, J., Lopez, L., Nuñez, P., Rao, M., Shahabuddin, G., Orihuela, G., Riveros, M., Ascanio, R., Adler, G. H., Lambert, T. D., and Balbas, L.: Ecological meltdown in predator-free forest fragments, Science, 294, 1923–1926, https://doi.org/10.1126/science.1064397, 2001.
Thompson, J. N.: Variation in interspecific interactions, Annu. Rev. Ecol. Evol. Syst., 19, 65–87, https://doi.org/10.1146/annurev.es.19.110188.000433, 1988.
Vanak, A. T., Fortin, D., Thaker, M., Ogden, M., Owen, C., Greatwood, S., and Slotow, R.: Moving to stay in place: behavioral mechanisms for coexistence of African large carnivores, Ecology, 94, 2619–2631, https://doi.org/10.1890/13-0217.1, 2013.
Voigt, D. R. and Earle, B. D.: Avoidance of coyotes by red fox families, J. Wildl Manage., 47, 852–857, https://doi.org/10.2307/3808625, 1983.
Wikramanayake, E., Dinerstein, E., Seidensticker, J., Lumpkin, S., Pandav, B., Shrestha, M., Ballou, J., Johnsingh, A. J. T., Chestin, I., Sunarto, S., Thinley, P., Thapa, K., Jiang, G., Elagupillay, S., Kafley, H., Pradhan, N. M. B., Jigme, K., Teak, S., Cutter, P., Aziz, Md. A., and Than, U.: A landscape-based conservation strategy to double the wild tiger population, Conserv. Lett., 4, 219–227, https://doi.org/10.1111/j.1755-263X.2010.00162.x, 2011.
Wilcoxon, F.: Some uses of statistics in plant pathology, Bio. Bull., 1, 41–45, https://doi.org/10.2307/3002011, 1945.
Wilman, H., Belmaker, J., Simpson, J., de la Rosa, C., Rivadeneira, M. M., and Jetz, W.: EltonTraits 1.0: Species-level foraging attributes of the world's birds and mammals: Ecological Archives E095-178, Ecology, 95, 2027–2027, https://doi.org/10.1890/13-1917.1, 2014.
Yang, H., Zhao, X., Han, B., Wang, T., Mou, P., Ge, J., and Feng, L.: Spatiotemporal patterns of Amur leopards in northeast China: Influence of tigers, prey, and humans, Mamm. Biol., 92, 120–128, https://doi.org/10.1016/j.mambio.2018.03.009, 2018.