the Creative Commons Attribution 4.0 License.
the Creative Commons Attribution 4.0 License.
 | 23 Feb 2024
Disturbance can slow down litter decomposition, depending on severity of disturbance and season: an example from Mount Kilimanjaro
Juliane Röder
Tim Appelhans
Marcell K. Peters
Thomas Nauss
Roland Brandl
Deforestation and land-use change affect ecosystem processes such as carbon cycling. Here, we present results from a litter decomposition experiment in six natural and six disturbed vegetation types along an elevation gradient of 3600 m on the southern slopes of Mount Kilimanjaro, Tanzania. We exposed litter bags with a standard material for up to 12 weeks each in two seasons. In the cold wet season we sampled the full elevation gradient and in the warm wet season we repeated the sampling in the lower part of the elevation gradient. Though we found significantly negative effects of disturbance in forest ecosystems, this was only due to differences between natural and burned Podocarpus forests. Disturbance characterized by a more open vegetation structure in many of the studied vegetation types had no general effect when we studied the full elevation gradient; this also included non-forest vegetation types. Land-use intensity had a significant negative effect on decomposition rates but only in the warm wet season, not in the cold wet season. Temperature and humidity were the most important drivers of decomposition overall and for all subsets of vegetation types and seasons. Our study shows that negative effects of disturbance or land-use intensity on decomposition depended on the severity of disturbance and on the season. Nevertheless, climate was generally the most relevant driver of decomposition. Therefore, vegetation types with moderate levels of disturbance can retain high functionality in regards to carbon cycling over short periods of time. More and longer decomposition studies are necessary to better predict consequences of land-use change for carbon cycling in the Afrotropics.
- Article
(2830 KB) - Full-text XML
- BibTeX
- EndNote


1.1 Litter decomposition and land-use change
The decomposition of plant material is an essential part of carbon cycling. When forests are converted to agricultural fields or grasslands, there is a significant decrease in litter fall and consequently lower input of carbon and other nutrients (Dawoe et al., 2010; Becker et al., 2015; Paudel et al., 2015b). Additionally, decomposition rates often decrease with land-use change; deforestation in tropical forests has been shown to decrease decomposition rates in secondary forest (Martius et al., 2004; Paudel et al., 2015a; Both et al., 2017), tree plantations (Attignon et al., 2004; Barlow et al., 2007), agroforestry (Dawoe et al., 2010), and other agricultural land uses (Kagezi et al., 2016, but see Cuke and Srivastava, 2016). A drier microclimate due to more open vegetation (Barlow et al., 2007; Paudel et al., 2015a) and lower nutrient availability due to lower litter quality or higher leaching (Dawoe et al., 2010; Both et al., 2017) have been identified as the main reasons for lower decomposition rates in such areas. However, effects of land-use change on litter decomposition are often studied within a small range of climatic conditions and with only one starting point for experiments (but see Mugendi and Nair, 1996; Cuke and Srivastava, 2016; Peña-Peña and Irmler, 2016; Becker and Kuzyakov, 2018) despite the importance of climate and season for decomposition (Paudel et al., 2015a).
1.2 Litter decomposition and climate
Climate is one of the three most important drivers of decomposition together with litter quality and decomposer organisms (Lavelle et al., 1993; Aerts, 1997). Decomposition rates are highest in the wet tropical forest wherein temperatures are warm and moisture is not limiting the activities of microbial and invertebrate decomposers (Lavelle et al., 1993; García-Palacios et al., 2013). Studies in the tropics found decomposition increased with increasing temperature when moisture was similar across sites (Salinas et al., 2011; Esquivel et al., 2020) and increased along a precipitation gradient when temperature was similar across sites (Powers et al., 2009). Many decomposition studies in the tropics along climate gradients were conducted in natural forests (Cusack et al., 2009; Powers et al., 2009; Ostertag et al., 2022) and along elevation gradients (Coûteaux et al., 2002), and often both (Salinas et al., 2011; Bothwell et al., 2014; Marian et al., 2017; Esquivel et al., 2020). Studies that considered the effects of disturbance, succession, or land use simultaneously however are still underrepresented in the tropics, particularly outside of Central and South America (Castillo-Figueroa, 2021; but see Bohara et al., 2019). Disturbed forests often have a drier or more variable microclimate compared with natural forests, due to a more open vegetation structure (Barlow et al., 2007; Paudel et al., 2015a), but it is unclear in which climatic conditions these microclimatic differences are relevant.
1.3 Elevation gradients in general and Mount Kilimanjaro specifically
Elevation gradients on mountains provide ideal systems to test climate-related hypotheses (Lomolino, 2001). Mountains have steep climatic gradients along their slopes and an adiabatic lapse rate of ca. 0.65 °C 100 m−1 elevation in moist-adiabatic ecosystems (Dillon et al., 2006). Mountains with different types of vegetation at a given elevation level allow us to distinguish between climate- and vegetation-related effects on decomposition. Mount Kilimanjaro in Tanzania is well-suited for this kind of study: it is the highest solitary mountain in the world (5895 m a.s.l.), with a regular vegetation cover up to 4500 m a.s.l. (Hemp, 2009). Almost all vegetation zones on the mountain experienced some kind of disturbance in certain areas (Hemp, 2006). This allows for the separation of effects of climate and disturbance along an elevation gradient of more than 2300 m. The lower slopes of the mountain have been settled for at least 500 years, probably more than 2000 years (Soini, 2005; van der Plas et al., 2021). The Chagga people developed a form of agriculture involving agroforestry, i.e. the so-called homegardens, hand-cut grasslands, a complex system of water channels for irrigation, and maize fields at the foothills (Soini, 2005; Kimaro et al., 2019). Today, there are more settlements, and more farms, but average farm size has decreased (Soini, 2005). To increase productivity, land-use intensity (LUI) had to increase: the diversity of crops in homegardens increased while many homegardens were transformed to coffee plantations (Soini, 2005). Coffee plantations and maize fields are regularly tilled and managed using fertilizers and pesticides (Soini, 2005; Classen et al., 2015).
Since 2010, the KiLi project (Kilimanjaro ecosystems under global change: linking biodiversity, biotic interactions and biogeochemical ecosystem processes, DFG project FOR 1246) has been studying a large range of abiotic and biotic aspects of all major vegetation types on the southern slopes of Mount Kilimanjaro, on the same 60 study sites (Peters et al., 2019). In this landscape, we expected decomposition rates to be lower in managed vegetation types compared to natural vegetation types due to lower litter fall and reduced nutrient input. We further expected decomposition rates to decrease in more open vegetation structures, i.e. to be lower in more open forests, and in coffee plantations and grasslands compared to agroforestry, due to a drier and more variable microclimate. Finally, we expected decomposition rates to be lower in coffee plantations compared to grasslands, due to the use of pesticides, heavy machinery, and the large size of most coffee plantations. Land-use intensity within the managed vegetation type was variable, so we used a composite metric considering the annual removal of plant biomass, vegetation structure, chemical inputs to the ecosystem, and the proportion of managed vegetation types in the surrounding landscape to account for these differences (Classen et al., 2015; Peters et al., 2019). To our knowledge, our study is also the first to compare litter decomposition rates in natural and disturbed forests along the same elevation gradient.
1.4 Objectives
We used litter bags with maize husks (Zea mays L.; Linnaeus, 1753) to compare decomposition rates in 12 vegetation types along an elevation gradient of 3600 m, with pairs of natural and disturbed vegetation types along an elevation gradient of 2300 m, and along a land-use gradient from natural forests, traditional agroforestry/homegardens, grasslands, and coffee plantations. We expected to find that (i) decomposition would be faster at higher temperatures and at higher humidity, (ii) decomposition would be slower in disturbed vegetation types compared to natural vegetation types at similar elevations, and (iii) increasing land-use intensity would slow down decomposition, with a gradient of faster to slower decomposition from lower montane forests > homegardens > grasslands > coffee plantations.
2.1 Study area
Mount Kilimanjaro is an inactive volcano that rises from the savanna at about 700 m a.s.l. to the summit, which is surrounded by glaciers, at 5895 m a.s.l. (Nonnotte et al., 2008). It is located in northeastern Tanzania, close to the Kenyan border and just south of the Equator (2°45′ to 3°25′ S; 37°00′ to 37°43′ E). This region experiences two distinct wet seasons, with heavy rains from March to May and mild rains from October to December (Chan et al., 2008; Appelhans et al., 2016). The southern slopes of the mountain receive most of the precipitation, with a peak of 2500 mm mean annual precipitation at mid-elevations between 2200 and 2500 m a.s.l. (Røhr and Killingtveit, 2003; Appelhans et al., 2016). The soils in the colline savanna at the foot of the mountain are dominated by Acrisols, Ferralsols, Lixisols, Nitisols, and Vertisols (Zech et al., 2014). The soils in the cultivated zone on the lower slopes (between ca. 1100 and 1900 m a.s.l.) are mainly Anthrosols, while Andosols dominate the montane forest belt and above (between ca. 2000 and 3200 m a.s.l.; Downie et al., 1956; Zech, 2006; Zech et al., 2011, 2014). The alpine zone is dominated by Leptosols (Zech, 2006). Soil pH was highest in homegardens at 5.8, and lowest in Ocotea-dominated forest at 3.5 (Pabst et al., 2013).
2.2 Study sites
Along the elevation gradient, study sites were established within six elevation levels where the most important natural vegetation types occur, i.e. those that cover the largest area on and around Mount Kilimanjaro: savanna (between 870 and 1155 m a.s.l., sav), lower montane forest (between 1560 and 2040 m a.s.l., flm), Ocotea forest (between 2120 and 2750 m a.s.l., foc), Podocarpus forest (between 3830 and 3900 m a.s.l., fpo), Erica forest (between 3830 and 3900 m a.s.l., fer), and alpine Helichrysum communities (between 3880 and 4550 m a.s.l., hel); the elevation gradient spans 3685 m (see also Fig. A1). In four of these elevation levels, additional study sites were established in disturbed environments. The type and extent of disturbance is unique for each vegetation type. Savanna has been, and still is, transformed to agricultural fields (between 865 and 1010 m a.s.l., mai). Agroforestry (hom), hand-cut grasslands (gra), and coffee plantations (cof) replaced most of the lower montane forest, forming a gradient of land-use intensity in the most productive zone (between 1120 and 2040 m a.s.l.); historical selective logging removed Ocotea trees (between 2220 and 2560 m a.s.l., fod); natural and human-caused fires destroyed most of the old-growth Erica forests and transformed the Podocarpus forests situated between 2770 and 3060 m a.s.l. (fpd; Lambrechts et al., 2002; Hemp, 2006). We did not sample in disturbed Erica or Helichrysum communities. In each of the six natural and six disturbed vegetation types, five study sites of 50 m × 50 m were established with a minimum distance of 300 m between the individual sites (for details, see Ensslin et al., 2015; Rutten et al., 2015). The five sites were chosen to represent the variation within an elevation level with regard to vegetation structure, canopy cover, and elevation. This resulted in considerable differences in the extent of land-use intensity within vegetation type, especially for managed vegetation types. We therefore used a composite metric of land-use intensity in part of the analyses of these vegetation types.
2.3 Preparation of litter bags
We used litter bags with maize husks as a standard litter (10 cm × 15 cm, mesh size 4 mm × 4 mm). Standard litter consisted of 5 g ± 0.05 g intact inner leaves of maize husks. The maize husks originated from two fields managed by the same farmer. Husks with visible fungal spots were not used, but we had to assume that all husks were infected. The litter was dried at 72 °C for 1 week to reduce the effect of microorganisms already present on the husks and then left in the lab for another 2 to 3 d to adjust to normal air humidity and to assume a stable mass before litter bag preparation. Maize husks can absorb considerable amounts of water from the ambient air in a very short time (Bernhardt et al., 2019). Additional litter bags that were not exposed in the field were used to estimate moisture (8.8 ± 1.6 % mean ± SD, ) and ash content (3.0 ± 0.31 %) at the time of preparation. Moisture and ash content were used to calculate ash-free organic matter content in the litter samples exposed at the sites (Eq. 1). Subsamples of 2 mg were analysed for carbon (43 ± 1.2 %) and nitrogen content (0.29 ± 0.071 %), resulting in a C:N ratio of 156±30.4. Handling bias was close to zero owing to the soft texture of the husks.
2.4 Experimental design
In March 2012, at the beginning of the cold wet season, we placed 6 litter bags on each of the 60 study sites along the elevation gradient. Bags were arranged in three blocks to cover site-inherent variation of microhabitats (Fig. A1). Owing to logistics at the time of collection, we could not sample two of the Erica forest sites, reducing the total number of litter bags to 3 bags × 2 collecting times × 58 sites = 342 bags. We collected 3 bags per site after ca. 5 weeks (between 34 and 53 d) and 3 bags per site after ca. 10 weeks (between 63 and 86 d, Table 1). Unfortunately, at four grassland sites and one site in a coffee plantation, litter bags were destroyed so we decided to collect all remaining bags from these sites after 5 weeks. From one grassland site all samples were lost, reducing the number of sampling sites considered in this analysis to 57. Further losses reduced the total number of bags to 276 in the analysis.
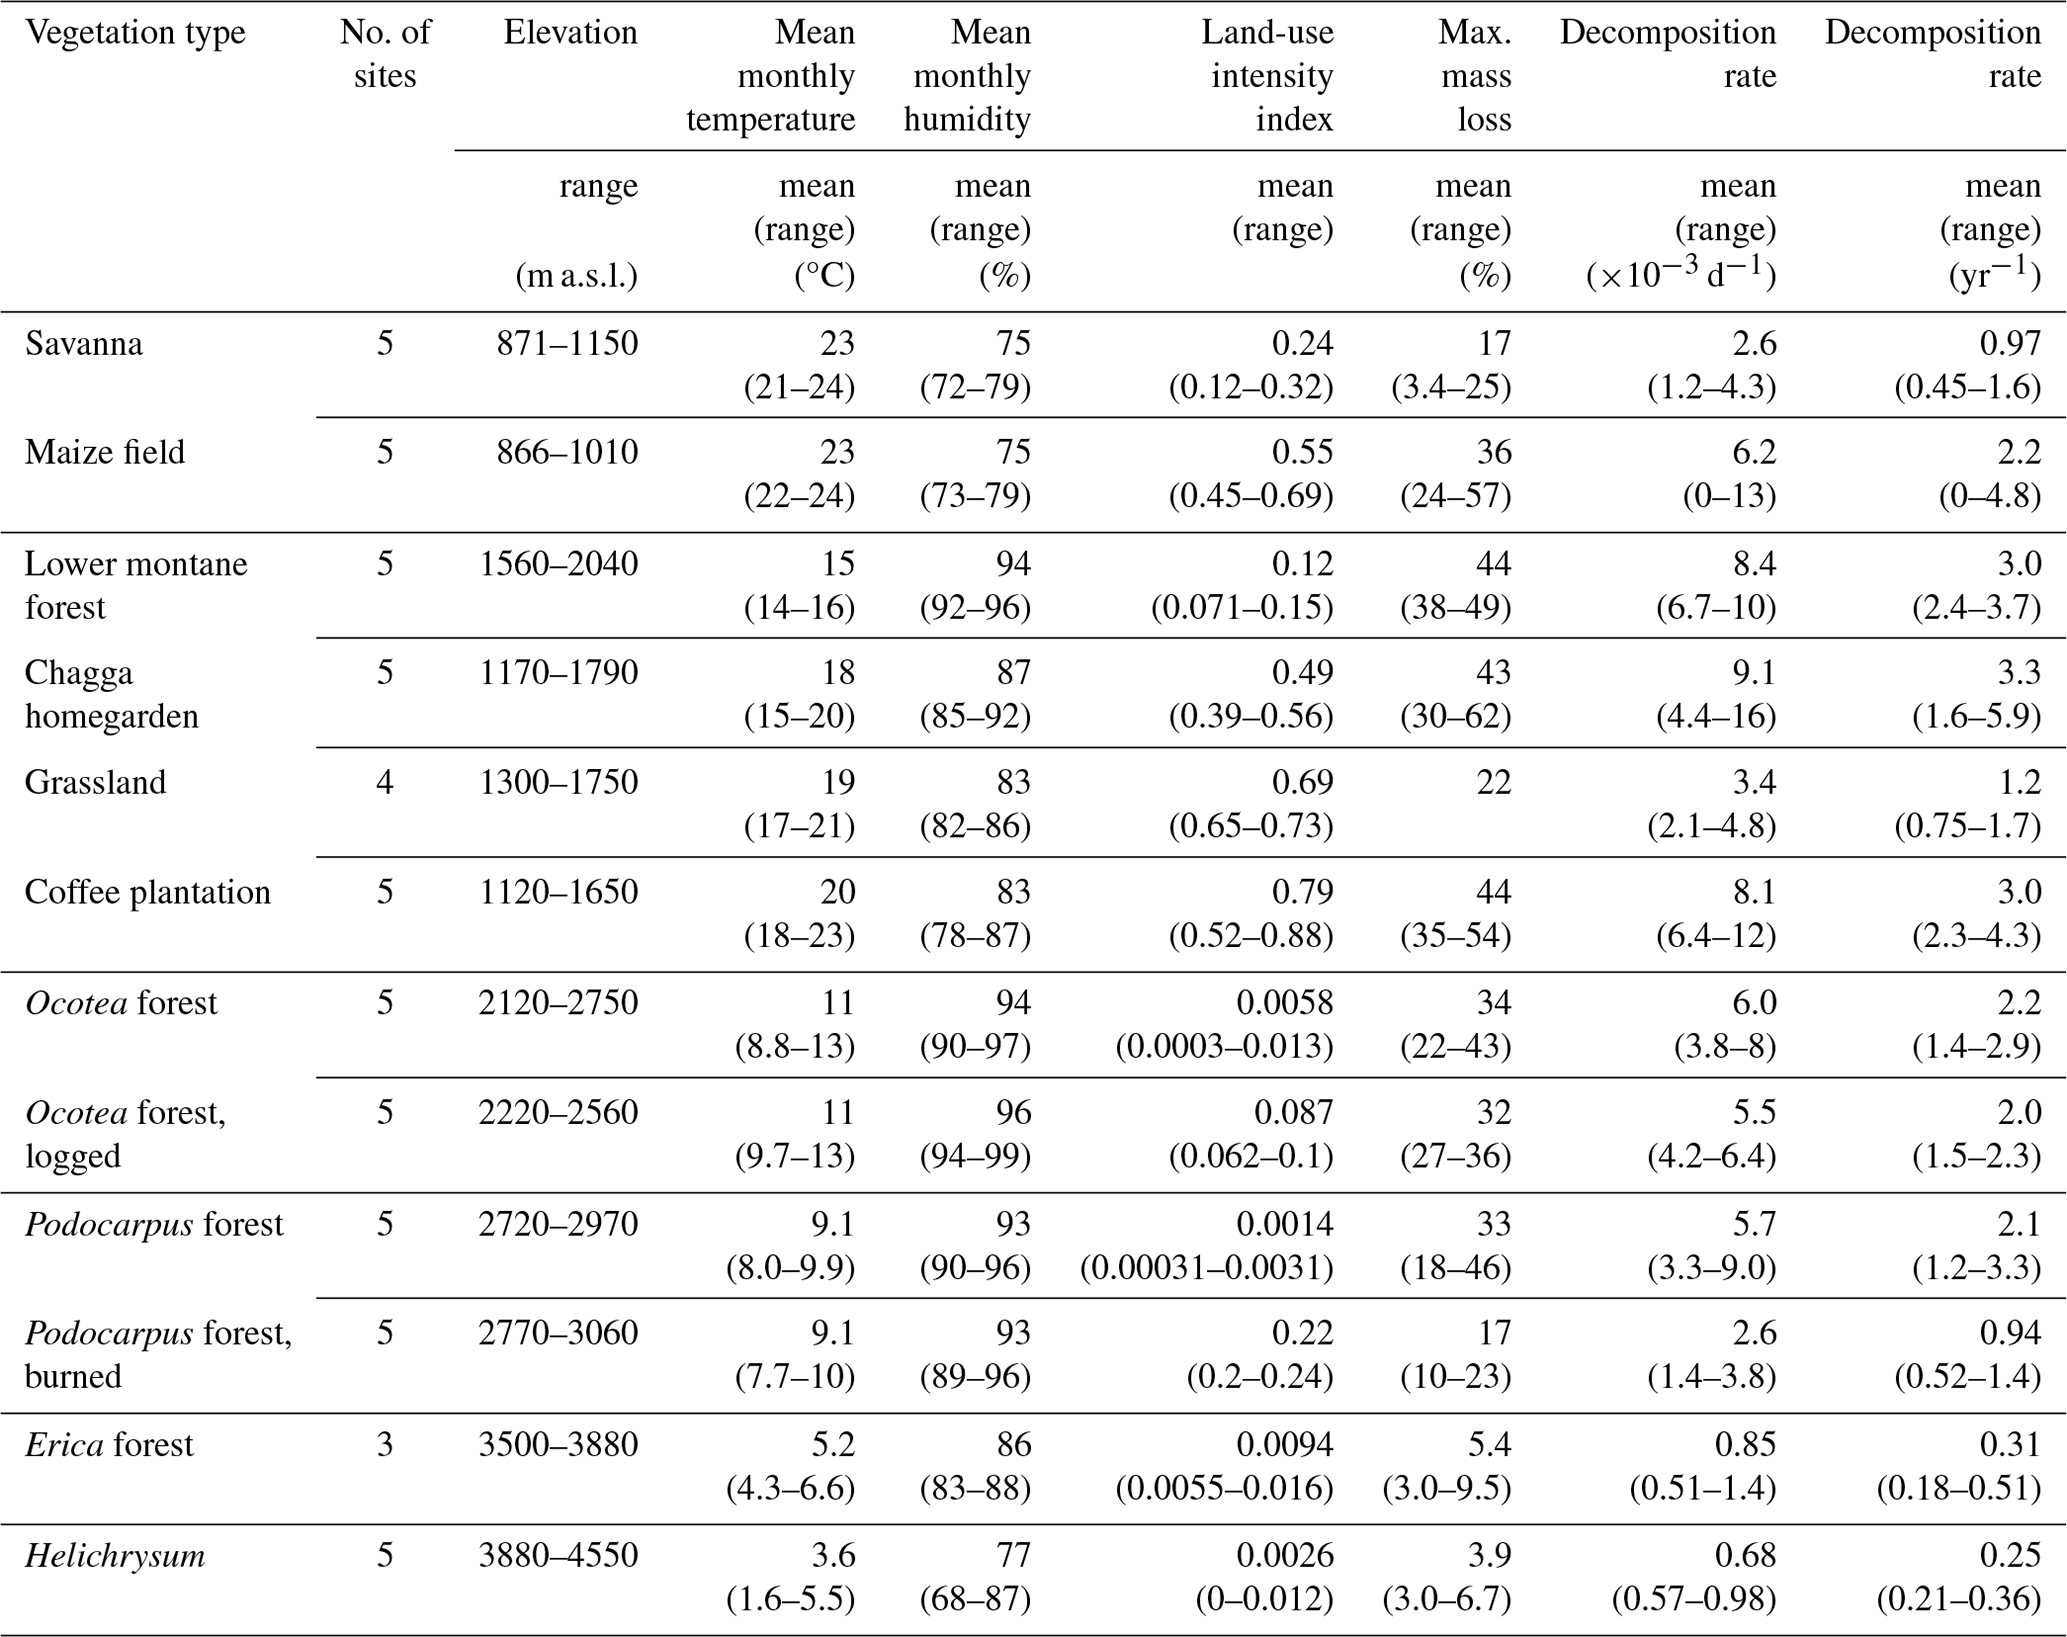
Table 1Environmental conditions and decomposition rates on study sites in March–May 2012. Temperature and humidity values were calculated from mean monthly temperature and mean monthly humidity; weighted by the number of days the bags were exposed in the respective months (e.g. mean temperature during sampling on site X, bags exposed on 9 March 2012, collected 24 May 2012: d total = 15.5 °C). Land-use intensity considered annual removal of plant biomass, chemical inputs to the ecosystem, vegetation structure, and the proportion of managed vegetation types in the surrounding landscape (for details, see Classen et al., 2015). Litter bags from three of four grassland sites were collected after 42–47 d, with mass loss of 8.7 %–18 %. We only included mass loss of one grassland in this table where litter bags were collected also after 72 d, to make results comparable with other vegetation types. For mass loss and decomposition rate per site and collection time, see Table A1.
In September 2012, at the beginning of the warm wet season, we placed six bags per site in two natural and four disturbed vegetation types, i.e. in all sites of the two lower elevation levels. Due to logistical challenges, we could only sample one of five elevation transects, so we focused our analyses on four vegetation types along the land-use gradient. We collected 6 bags per site after ca. 10 weeks (between 67 and 84 d). Of 186 exposed bags, 155 were valid, and 92 bags from the second to lowest elevation zone were used in the analyses. Results for all valid samples from both seasons are listed in Table A1.
We chose this rather short exposure time because (1) on sites below 2000 m a.s.l. long exposure times of litter bags were not feasible due to management (e.g. tilling and sometimes willful damage); (2) we wanted to restrict sampling to the wet seasons (Peña-Peña and Irmler, 2016); (3) the highest mass loss occurs shortly after exposure, revealing differences between vegetation types within short time (e.g. González and Seastedt, 2001); and (4) decomposition is very fast in wet tropical forests, reducing half-time decomposition to a few weeks (Wall et al., 2008).
2.5 Processing of samples
Upon collection, each litter bag was placed into a paper bag, dried at 72 °C for at least 2 d or at 40 °C for at least 4 d, and then stored in a dry place until they were brought to the laboratory. In the laboratory, contaminations like roots, plants, or twigs were removed, the litter samples were dried again at 70 °C, and weighed again before all of the litter bag contents were burned at 550 °C for 30 min in a muffle furnace (CEM SAM255; Potthoff and Loftfield, 1998). There was no further loss in organic matter after 1 and 2 h of burning, so we used 30 min to process most samples. The remaining sample was weighed again to determine remaining ash-free organic matter content. We chose this method of sample processing to address soil contamination.
Several samples lost more organic matter during loss on ignition than was originally present in the litter bags. Most of these samples came from maize fields (about half of the collected bags) and savanna (about a third of the bags). These litter bags were caked with soil, and the remaining litter was too fragmented to be extracted by hand. There was additional organic matter in the soil on these samples; therefore, these samples were excluded from subsequent analyses because the fraction of litter remaining could not be determined. If mass loss was negative only after we corrected for water and ash content, we used the samples but set mass loss to 0. Some samples contained significant amounts of soil but contained more organic matter before than after exposure. We used these samples in the analyses, although this could have resulted in an underestimation of the actual decomposition (Idol et al., 2002). There was no soil contamination of litter bags in forest sites or at higher elevations.
2.6 Environmental data
All study sites were equipped with sensors for temperature and relative humidity that were installed approximately 2 m above the ground. Details on the design and set-up of sensors and on the processing of collected data were described by Appelhans et al. (2015, 2016). For the analyses, mean temperature and mean humidity per sampling period were calculated from mean monthly temperature and mean monthly relative air humidity data aggregated from measurements at the sites, weighted by the number of days the bags were exposed in the respective months (example given in Table 1). Along the elevation gradient, disturbance was modelled using a binary factor (natural–disturbed). To measure disturbance along the land-use gradient, a composite metric was used that considered annual removal of plant biomass, chemical inputs to the ecosystem, vegetation structure, and the proportion of managed vegetation types in the surrounding landscape (Classen et al., 2015; Peters et al., 2019). For a more detailed description of the index, please refer to Classen et al. (2015), where more information on the methodology is provided in the supplement.
2.7 Data analysis
Bags at lower elevations tended to be exposed slightly longer than bags at higher elevations. We used a single exponential model (Olson, 1963) to estimate mean decomposition rates per site per day based on the ash-free mass loss per bag and the number of days the bags were in the field. We estimated the decomposition rate constant k as the slope of a log-linear regression based on Eq. (1):
with
and
We restricted all analyses concerning elevation or elevation level to samples from March–May 2012, because this was the only sampling period to cover the full elevation gradient. Decomposition rates were log-transformed to approach a normal distribution of errors. We used a two-way ANOVA with disturbance and elevation levels as factors to compare decomposition rates for pairs of natural and disturbed vegetation types at four and three elevation levels. We used a one-way ANOVA to test for differences between the four vegetation types along the land-use gradient. If there were significant differences detected by the ANOVA, we used a Tukey honestly significant difference (HSD) post hoc test with a confidence level of 0.95. We further used generalized additive models (GAMs) to correlate decomposition rates with temperature, humidity, and disturbance (factor; elevation gradient) and with land-use intensity index (continuous; land-use gradient), respectively. Continuous variables were z transformed prior to analyses. We used a default basis dimension of k=5 for analyses along the elevation gradient and k=3 for analyses along the land-use gradient to account for a limited number of data points. The GAMs used Gaussian error distribution and thin plate regression splines to fit the curves for main effects and for interactions of main effects and disturbance as a factor (package mgcv v.1.8-31 in R; Wood, 2003, 2011). The GAM modelling decomposition along the land-use gradient used tensor product interactions to fit curves for the interaction terms (Wood, 2006, 2017).
3.1 Overall patterns of environmental variables and mass loss
Mean monthly temperature declined linearly with increasing elevation, with a lapse rate of −0.62 °C 100 m−1 (Fig. 1). Mean monthly relative air humidity showed a hump-shaped pattern, with a peak at 2440 m a.s.l. Land-use intensity declined with increasing elevation (Fig. 1) and was highest in coffee plantations, followed by grasslands, maize fields, and homegardens (Table 1). Temperature increased and humidity decreased linearly with increasing land-use intensity (Fig. 1). Humidity peaked at temperatures of 12.1 °C and decreased towards lower and higher temperatures (Fig. 1).
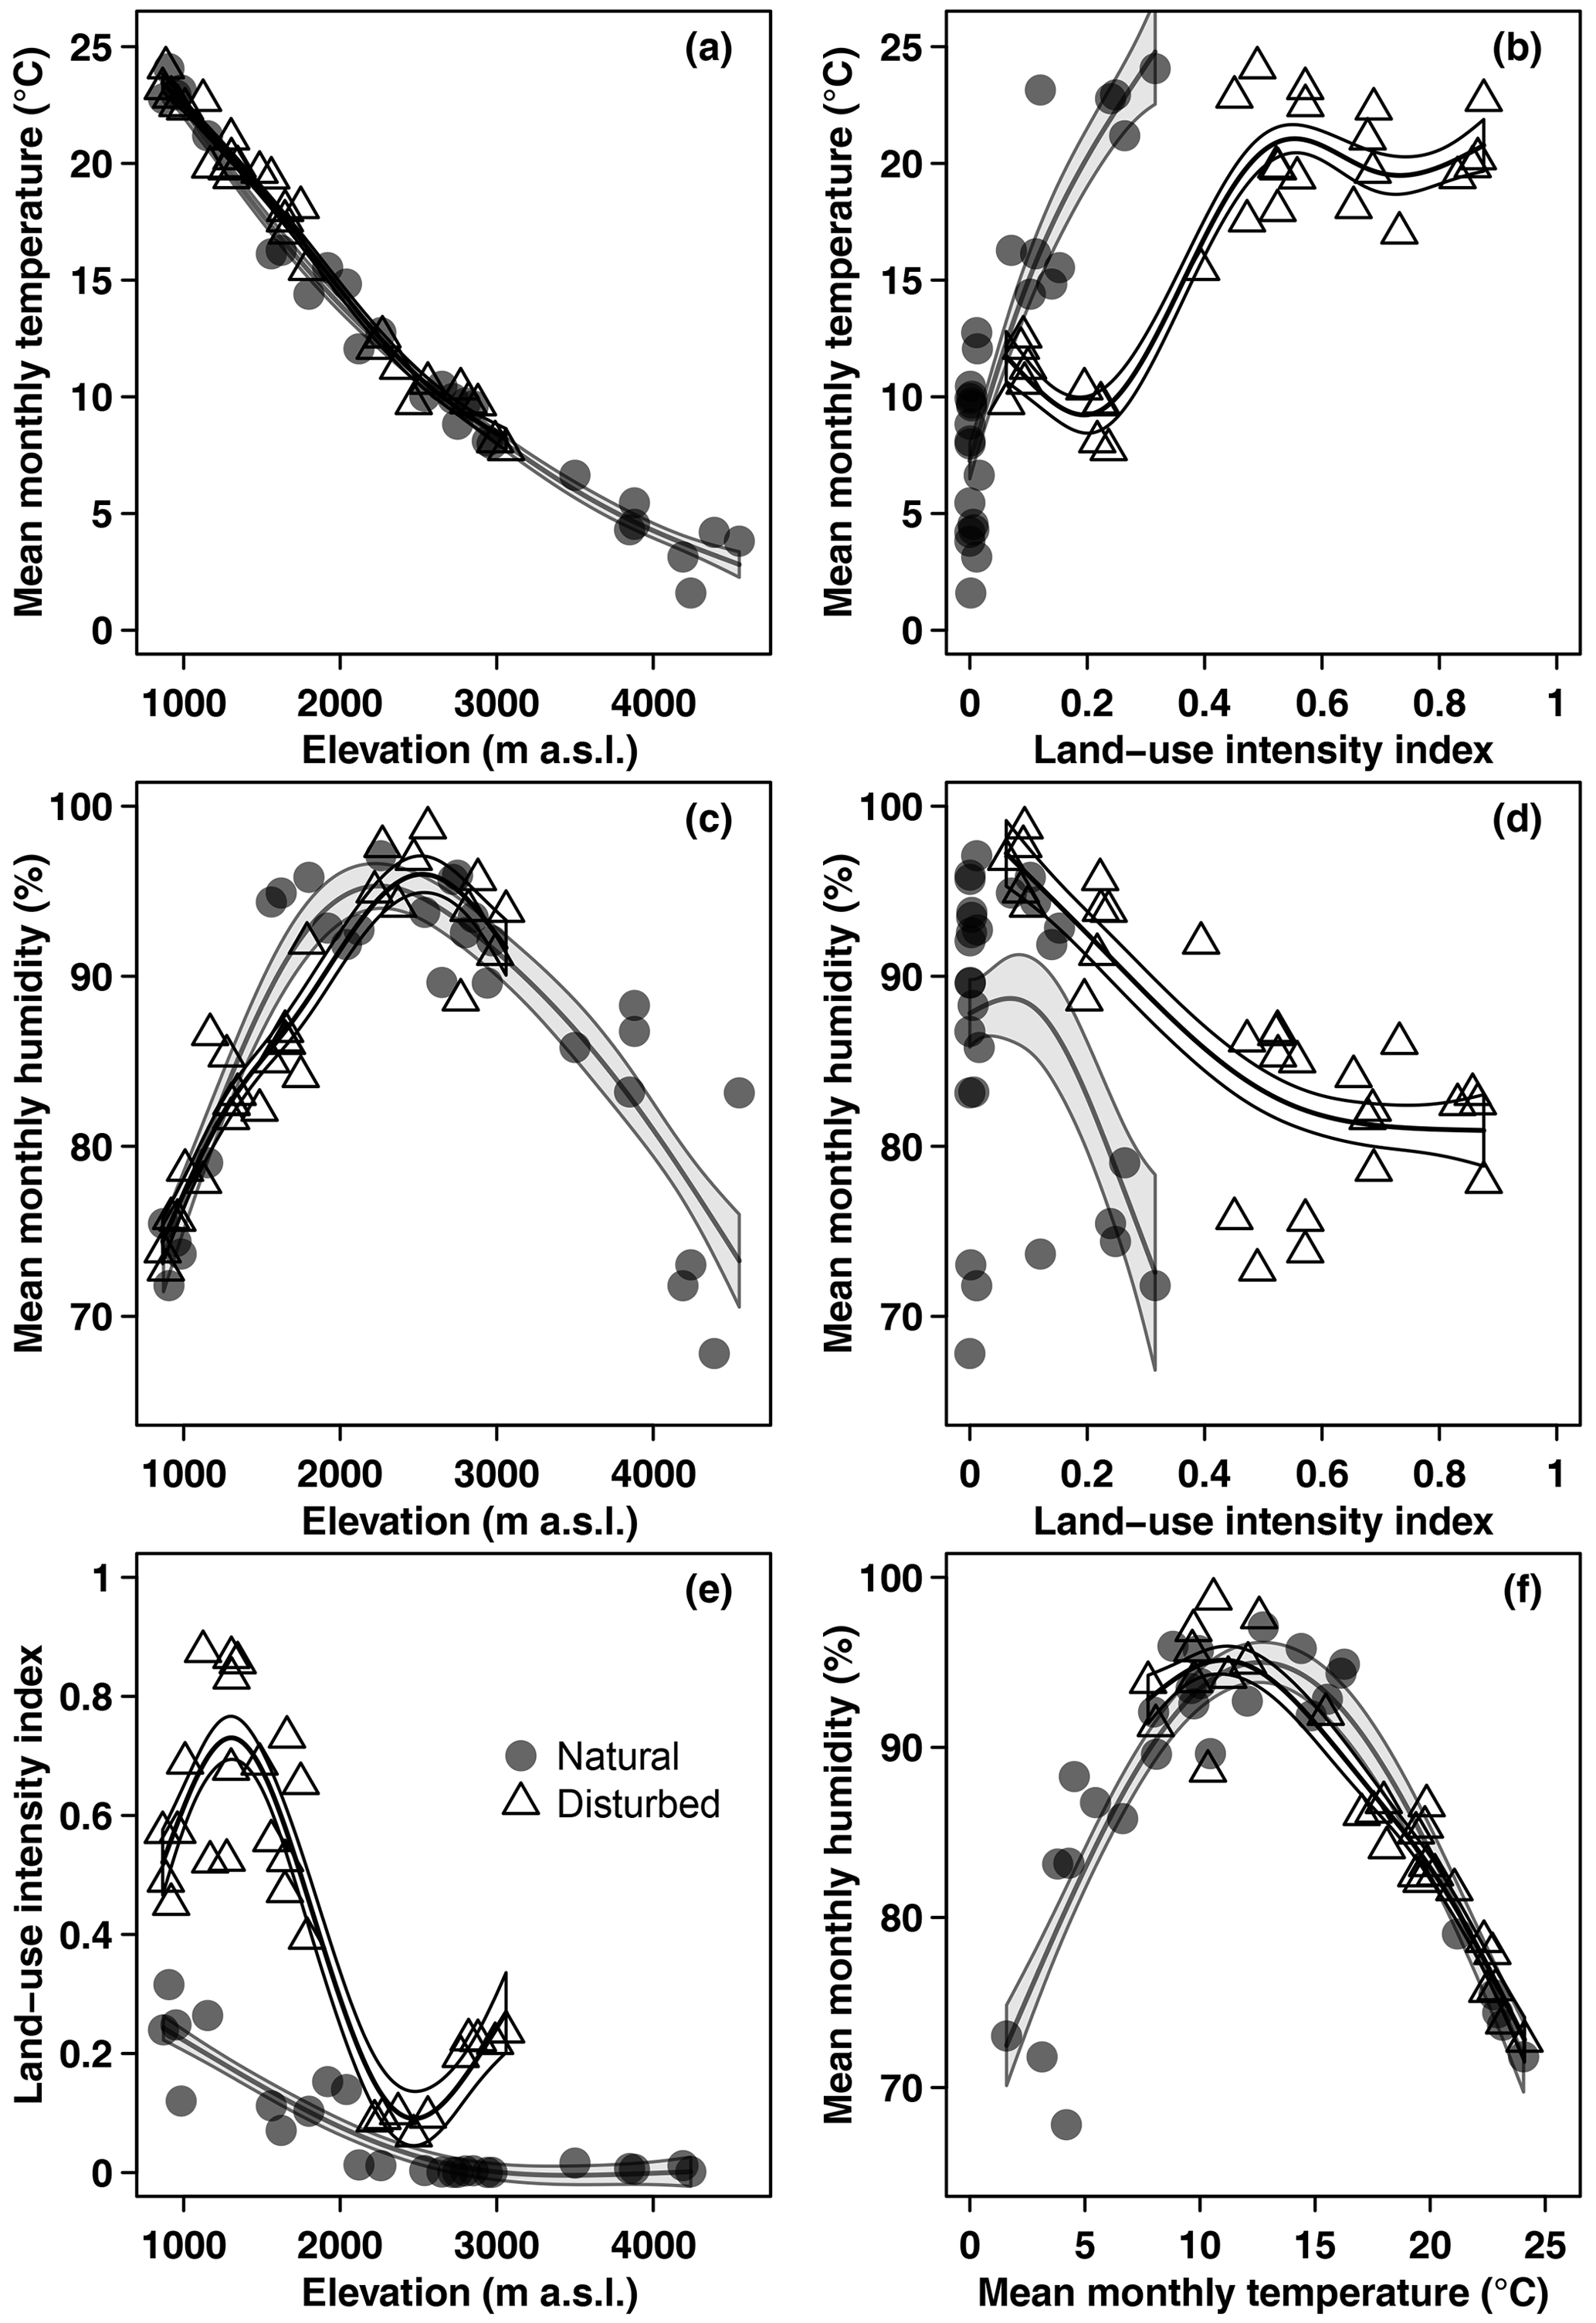
Figure 1Overview of environmental variables in the cold wet season (March–May 2012): (a) temperature, (c) humidity, and (e) land-use intensity per site along the elevation gradient, (b) temperature and (d) humidity related to land-use intensity, and (f) humidity related to temperature. Shown are raw mean temperature and humidity values for the longest time of exposure per site. Curves are GAM curves for natural (grey points) and disturbed (empty triangles) sites. Shading indicates standard errors.
In the cold wet season, mass loss per site ranged between 3.0 % (Helichrysum and Erica) and 62 % (homegarden) after 70 and 63 d, respectively (Table 1, Fig. A2). Mean mass loss per vegetation type was 5.4 % or lower for Helichrysum communities and Erica forest and highest in the second to lowest elevation zone, i.e. in lower montane forest (mean = 44 %), coffee plantations (44 %), and homegardens (43 %, Table 1). Mass loss in grasslands, which were at similar elevations, was about half of the mass loss found in the other three vegetation types of the same elevation zone (22 %, Table 1).
In the warm wet season, mass loss per vegetation type was overall lower than in the cold wet season (Table A1). Mass loss in maize fields (13 %) was about a third of that in the cold wet season (36 %). In the second to lowest elevation zone, mass loss was between a third (grasslands 15 %, forest 28 %, coffee plantations 32 %) and about half (homegardens, 24 %) lower than in the cold wet season (Table A1).
3.2 Decomposition rates in natural and disturbed vegetation types along the elevation gradient
In natural vegetation types, decomposition rates peaked at mid-elevations in the forest belt (Fig. 2, Table 1). The highest decomposition rates were recorded at a lower montane forest site ( d−1), and the lowest decomposition rates were recorded at an Erica forest site ( d−1), closely followed by four Helichrysum sites (between 0.57 and d−1, Table 1). In disturbed vegetation types, decomposition rates declined linearly with increasing elevation (Fig. 2). Decomposition was fastest in homegardens and coffee plantations, followed by maize fields and grasslands, and slowest in disturbed Podocarpus forests (Table 1).

Figure 2Decomposition rates along the elevation gradient in March–May 2012 (a) and per vegetation type and season (b). In panel (a), curves are GAM curves for natural (grey points) and disturbed (empty triangles) sites; shading indicates standard error. In panel (b), elevation levels are sorted from low elevations to high elevations from left to right. Shown are raw mean values. Vegetation types within elevation levels are sorted from low to high land-use intensity from left to right. For the lower six vegetation types, we show decomposition rates from the cold wet season on the left and from the warm wet season on the right side (striped boxes). Boxes show median and 25 %–75 % interval; whiskers extend to max. 1.5× of box length. Abbreviations: sav – savanna, mai – maize field, flm – lower montane forest, hom – homegarden, gra – grassland, cof – coffee plantation, foc – Ocotea forest, fod – disturbed Ocotea forest, fpo – Podocarpus forest, fpd – disturbed Podocarpus forest, fer – Erica forest, hel – Helichrysum community.
In a two-way ANOVA with elevation level and disturbance as factors, we found that elevation level had a significant effect on decomposition rates when we considered vegetation types at four elevation levels (, p<0.001, Fig. 2a, Table A2). Decomposition rates in lower montane forests and homegardens were significantly higher than decomposition rates in savanna and maize fields (p=0.0011) and significantly higher than decomposition rates in natural and disturbed Podocarpus forests (p<0.001). Disturbance had no significant effect on decomposition rates (, p=0.76), but the interaction of disturbance and elevation level was significant (, p<0.001). Within elevation levels, disturbance only had a significant effect for savanna and maize fields (p=0.010), with slower decomposition in savanna sites compared to the fields (Fig. 2a).
When we calculated a two-way ANOVA only for the pairs of natural and disturbed forest types in the forest zone of Mount Kilimanjaro, disturbance had a significant effect, with lower decomposition rates in disturbed forests than in natural forests (, p=0.035, Table A3). Elevation level (, p<0.001) and the interaction of elevation level and disturbance (, p=0.032) were also significant. Decomposition rates declined from lower to higher elevations, with lower montane forests > Ocotea forests > Podocarpus forests (Table A3). Within elevation levels, decomposition was faster in natural Podocarpus forests than in disturbed Podocarpus forests (p=0.016), but there were no differences for natural and disturbed forests at lower elevations (flm–hom, foc–fod; p>0.05 in both cases, Table A3).
Along the elevation gradient, both temperature and humidity had significant positive effects on decomposition rates when we included all vegetation types in the model (Table 2). Decomposition rates increased linearly with increasing temperatures, while the significantly positive relationship of decomposition rates and humidity was slightly more complex (Fig. 3). Disturbance (factor) was not significant (Table 2). The interaction of temperature and disturbed sites was significant, with decomposition rates increasing linearly with increasing temperature on disturbed sites. Other interactions were not significant (Table 2).
Table 2GAM results for decomposition rates related to temperature and humidity: for all 12 vegetation types, for 3 pairs of forest types, and for decomposition rates along the land-use gradient in the cold wet season (March–May 2012) and in the warm wet season (September–December 2012). Significant results are bold. edf – estimated degrees of freedom, ref. df – reference degrees of freedom.
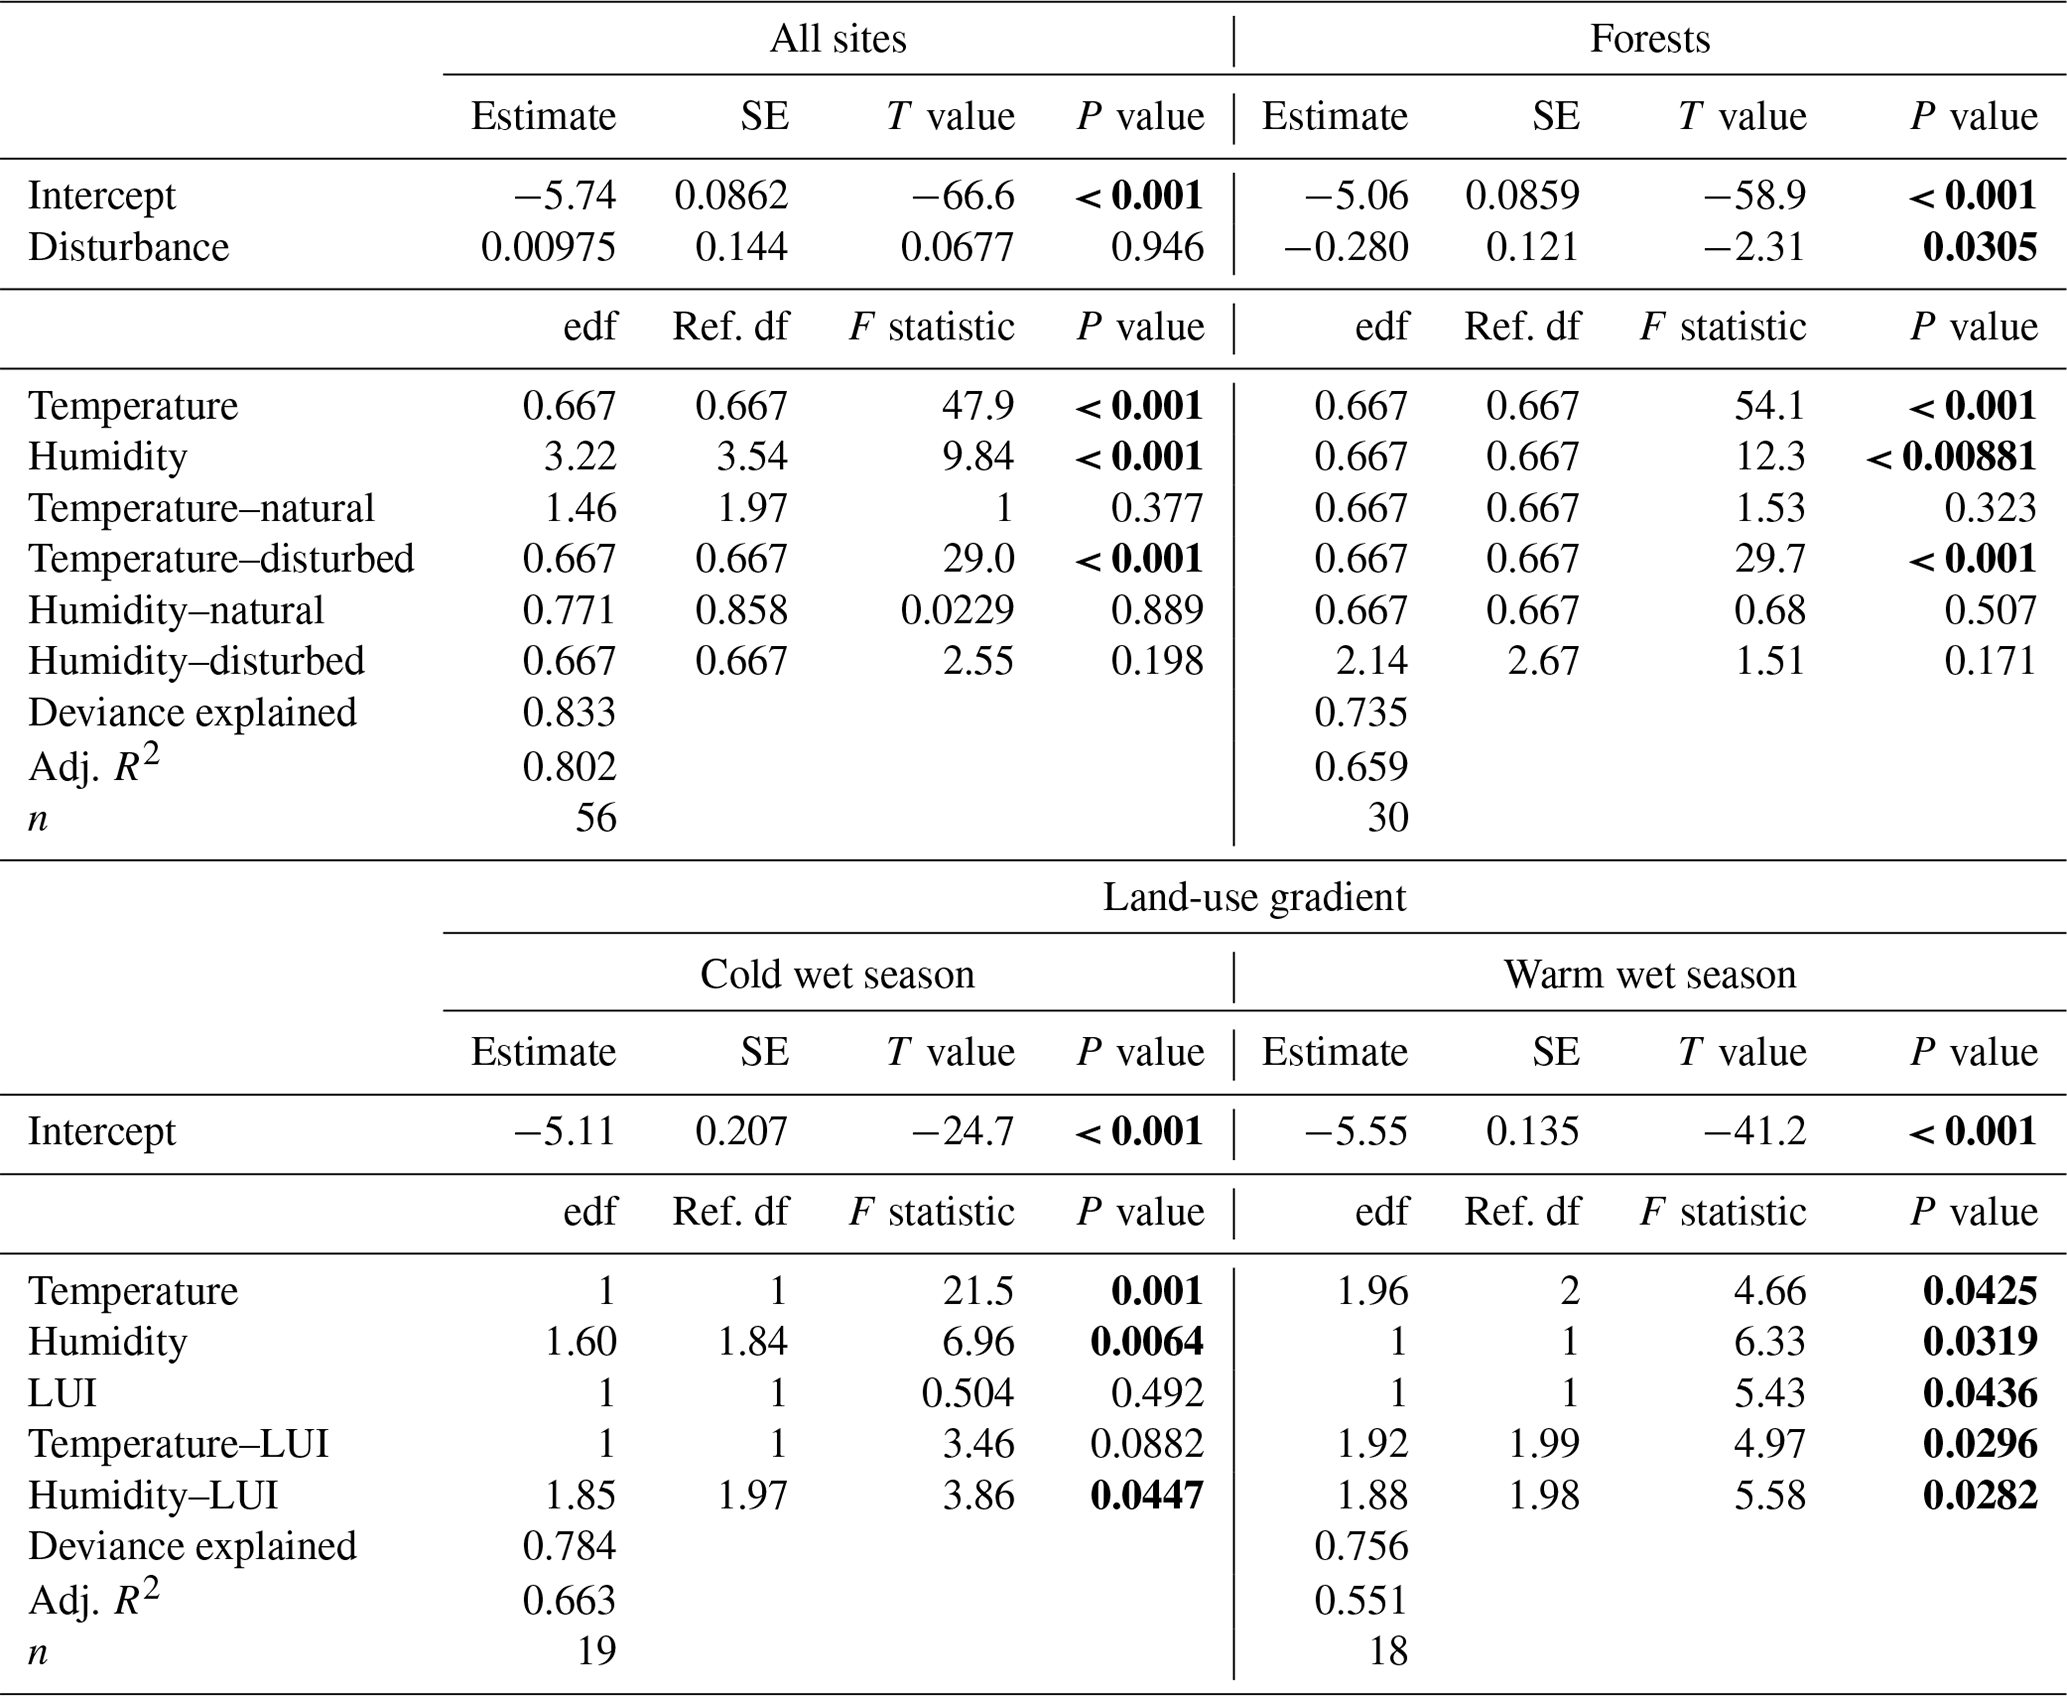
When we restricted the analysis to three pairs of forest types, temperature and humidity still had significant positive effects on decomposition rates (Table 2). However, decomposition rates were significantly lower in disturbed sites compared to natural sites for this subset of vegetation types. Again, only the interaction of temperature and disturbed sites was significant, with decomposition rates increasing linearly with increasing temperatures on disturbed sites (Table 2).
3.3 Decomposition along the land-use gradient
Along the land-use gradient, decomposition rates increased significantly with increasing temperature and with increasing humidity, but only in the cold wet season (Table 2, Fig. 3). In the cold wet season, the interaction of land-use intensity and humidity was also significant, with highest decomposition rates when humidity was high and land-use intensity was intermediate, and lowest decomposition rates when humidity was low and land-use intensity was medium. Land-use intensity as a main effect and the interaction of land-use intensity and temperature had no significant effects in this season (Table 2). In the warm wet season, all main effects and all interactions had significant effects on decomposition (Table 2). However, the patterns were different than in the cold wet season: temperature was related to decomposition in a hump-shaped pattern, with highest decomposition rates at low and high temperatures, and lowest decomposition rates at medium temperatures. Decomposition rates decreased with both increasing humidity and with increasing land-use intensity. Regarding the interaction of humidity and land-use intensity, decomposition was low when both humidity and land-use intensity were high, and decomposition was high when land-use intensity was high, but humidity was low. Regarding the interaction of temperature and land-use intensity, decomposition was low when both temperature and land-use intensity were high, and decomposition was high when temperature was high but land-use intensity was low.
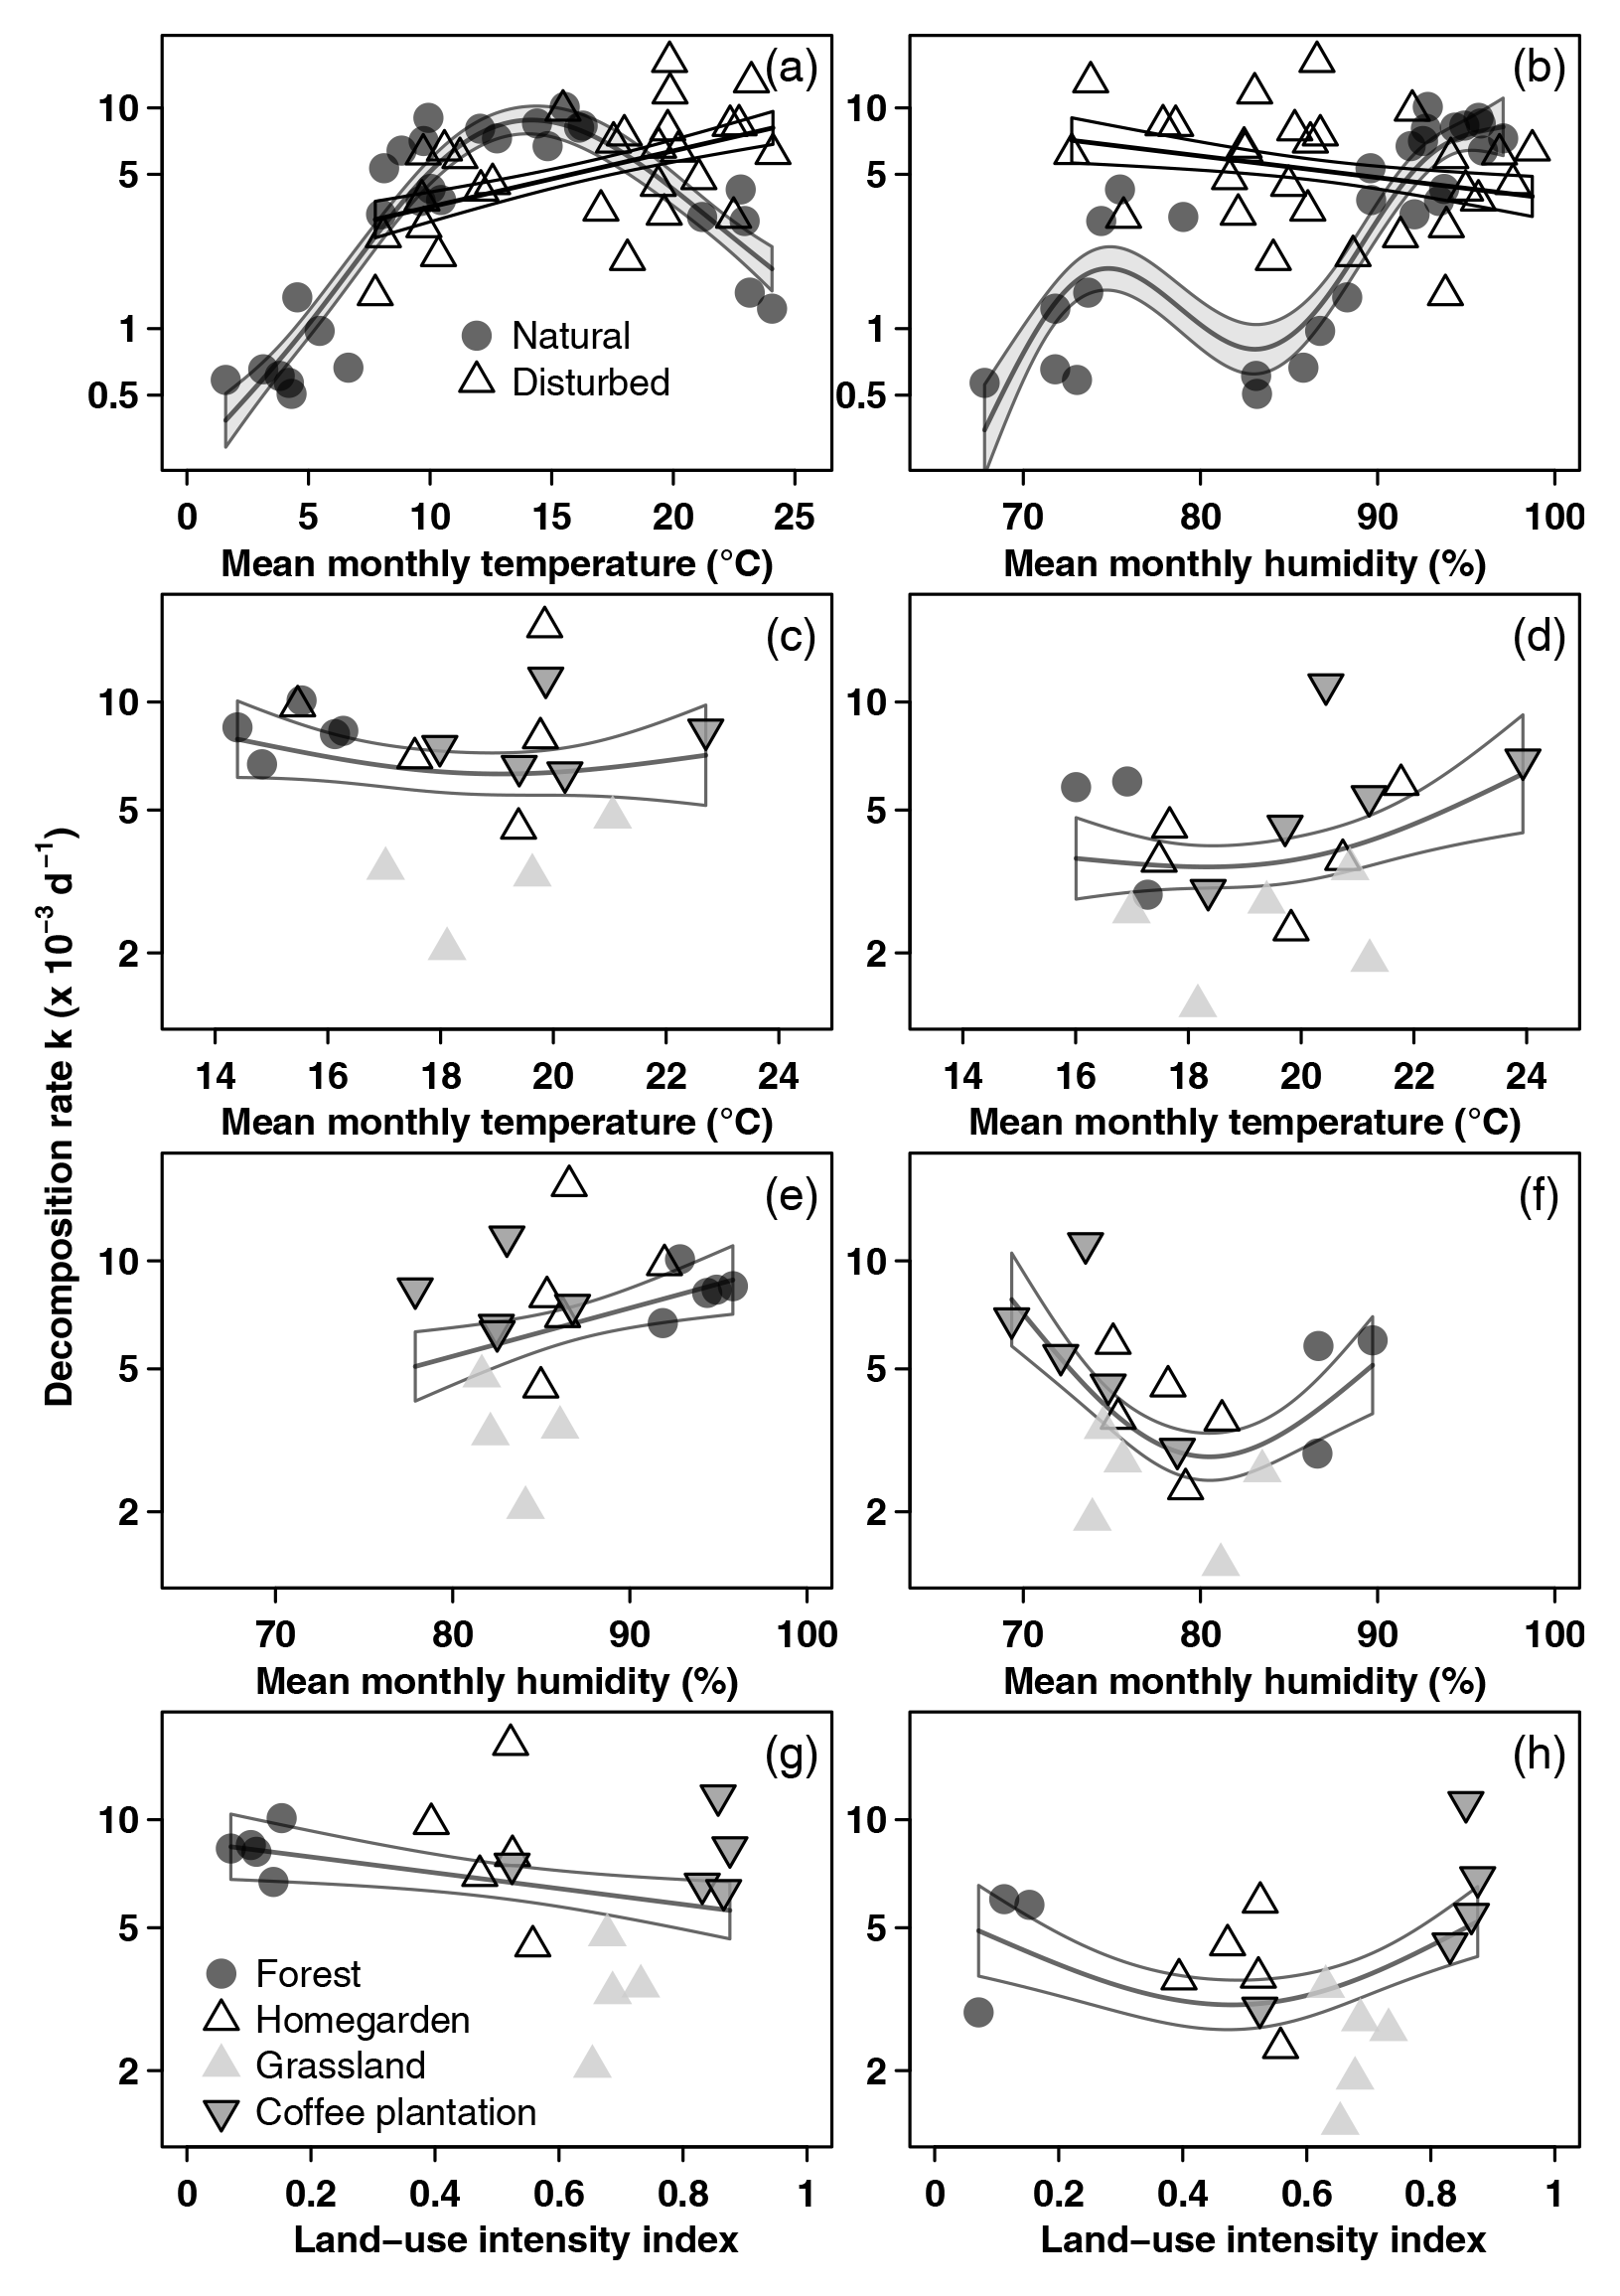
Figure 3Decomposition rates related to environmental variables. (a, b) All sites along the elevation gradient in the cold wet season (March–May 2012), (c, e, g) vegetation types along the land-use gradient in the cold wet season (March–May 2012), and (d, f, h) vegetation types along the land-use gradient in the warm wet season (September–December 2012). Curves are GAM curves, and shading indicates standard error. In panels (a) and (b), there are separate GAM curves for natural (grey points) and for disturbed sites (empty triangles). In panels (c)–(h), we show one GAM curve for all sites together. Shown are raw mean values. Please note that scales on both axes in panels (a) and (b) are different from panels (c)–(h).
When we used an ANOVA to compare decomposition rates in the four vegetation types that constituted the land-use gradient, we found significant differences in both seasons (cold wet season: , p=0.0015, Table A4; warm wet season: , p=0.022, Table A5). However, decomposition rates in grasslands were more different from the other vegetation types in one season than in the other: in the cold wet season, grasslands had significantly lower decomposition rates compared to any of the other three vegetation types (flm–gra, hom–gra, cof–gra p<0.01 in all three cases). Mean decomposition rates of lower montane forests, homegardens, and coffee plantations were not significantly different (flm–hom, flm–cof, hom–cof, p>0.05 in all three cases, Table A4). In the warm wet season, grasslands only had lower decomposition rates than the coffee plantations (p=0.016). There was no difference in mean decomposition rates between any of the other combinations of vegetation types (p>0.05 in all five cases, Table A5). When we compared decomposition rates in the lower six vegetation types across seasons, decomposition rates were significantly higher in the cold wet season compared to the warm wet season (, p<0.001, Fig. 2b, Table A6).
Depending on the subset of vegetation types included in the analysis, effects of disturbance on decomposition were negative or non-significant. When we analysed pairs of natural and disturbed forest types, we found a significantly negative effect of disturbance on decomposition. When we included natural and disturbed vegetation types from lower elevations, or all 12 studied vegetation types, disturbance had no overall significant effect. Land-use intensity had a significant negative effect on decomposition rates along the land-use gradient, but only in the warm wet season. Overall, temperature and humidity explained most of the variance in decomposition rates along both the elevation gradient and the land-use gradient.
4.1 Range of mass loss and different stages of decomposition
We found decomposition rates between 0.25 and 3.3 yr−1 across all vegetation types and between 0.31 and 3.0 yr−1 in forests. These values are well within the range of decomposition rates reported by other studies in the tropics and in tropical forests: Gholz et al. (2000) reported decomposition rates of 3.7 yr−1 for a broadleaved standard litter in the seasonal forest of Barro Colorado Island (BCI), 0.14 yr−1 for pine needles in a tropical dry forest, or between 0.22 yr−1 (pine needles) and 1.2 yr−1 for the broadleaved species in tropical montane forests. Wall et al. (2008) found decomposition rates between 1.4 and 3.2 yr−1 for wet tropical sites and 1.8 and 2.1 yr−1 for two savannas, also for a standard litter.
Our aim was to compare decomposition rates in very different vegetation types along an elevation gradient of 3600 m within a single season, i.e. within a short time frame. Although decomposition is fast in the tropics, and although we chose a wet season, mass loss at the upper and lower ends of our elevation gradient was low or very low. Decomposition has been divided in three stages, characterized by leaching of soluble compounds in the early stage, onset of lignin decomposition in the late stage, and little to no further mass loss in the very late stage (Berg and Staaf, 1980; Currie et al., 2009; Berg and Lönn, 2022; but see Duboc et al., 2014). The onset of late stage decomposition depends on litter quality, but between 20 % and 30 % are rough estimates of the corresponding mass loss (Berg and Staaf, 1980; Gholz et al., 2000). We did not track litter quality in this study, but we assume that samples with less than 5 % of mass loss (most samples from Erica forest and Helichrysum) were still in the leaching stage and their decomposition likely depending on different factors compared to samples with 20 % or more mass loss. If we use 20 % mass loss as a proxy, decomposition was in its early stages in 3 of 12 vegetation types, while it likely advanced to late stage decomposition in the rest – despite the short time frame. To reach at least 20 % mass loss under similar climatic conditions, the experiment would have had to last at least 84 d in savanna and at least 263 and 326 d in Erica forest and in Helichrysum communities. However, climatic conditions at low and at high elevations are highly seasonal along this gradient (Appelhans et al., 2016). Consequently, decomposition rates increased 2.5-fold in Erica forest and 3-fold in Helichrysum from cold to warm wet season for litter bags (Table A1) and by almost 50 % for buried tea bags (Becker and Kuzyakov, 2018). Unfortunately, we could not sample the full elevation gradient in the warm wet season to analyse seasonal differences along the elevation gradient.
4.2 Standard litter
We used a natural standard litter to compare decomposition rates across several vegetation types that did not share any common plant species. This approach has been adopted by a multitude of decomposition studies (e.g. Wall et al., 2008; Cusack et al., 2009; Keuskamp et al., 2013). Studies at local (Esquivel et al., 2020) and global scales (Makkonen et al., 2012) showed that the relative speed of decomposition of different litter species was predicted by litter quality and that the ranking from fast to slow decomposing litter species was stable across vegetation types and across biomes, despite very different local decomposer communities and climatic conditions. The C:N ratio of our standard litter (156) was higher than the C:N ratios of the natural litterfall at these sites (range mean C:N between 16.8 (hom) and 44.9 (flm); Becker et al., 2015). A high C:N ratio has been assumed to be an indicator of low litter quality and low decomposability (e.g. Makkonen et al., 2012). But litter quality of maize husks may not be as low as this ratio suggests. For example, Burgess et al. (2002) found that mass loss of maize husks was almost as fast as mass loss of maize leaves, despite very different initial C:N ratios (husks 103, leaves 42). Peña-Peña and Irmler (2016) used a mix of maize leaves and husks as a standard litter and found that it decomposed faster than native litter mixtures. In their study, decomposition rates increased with decreasing lignin content and were unrelated to C:N ratios. We did not measure lignin content, but the literature reports rather low lignin ratios of 7 %–8 % () for maize husks (Burgess et al., 2002; Bernhardt et al., 2019). With a mean mass loss of 28 % and up to 62 % in only 10–12 weeks, our standard litter was therefore suitable to compare at least 9 of 12 of the studied vegetation types, under the assumption that the relative decomposition rates of maize husks compared to local leaf litter was stable across vegetation types and climatic conditions (Makkonen et al., 2012; Esquivel et al., 2020).
4.3 Decomposition along the elevation gradient
Climate explained large parts of the variance of decomposition rates as has previously been shown for elevation gradients (Coûteaux et al., 2002; Bothwell et al., 2014; Canessa et al., 2021) and on a global scale (Aerts, 1997; Gholz et al., 2000; Wall et al., 2008; Zhang et al., 2008). Short-term decomposition is well predicted by single-exponential models (Wall et al., 2008) and is often driven by climate (Johansson et al., 1995; Wall et al., 2008; Currie et al., 2009). Our study agrees with these findings, as temperature and humidity explained large and significant amounts of variation in all models.
The hump-shaped pattern of decomposition rates in natural vegetation types along the elevation gradient followed patterns of humidity and precipitation (Appelhans et al., 2016), productivity (Detsch et al., 2016), aboveground living (Ensslin et al., 2015) and dead biomass (Komposch et al., 2022), carbon, nitrogen, and other nutrient contents of natural litterfall (Becker et al., 2015), and soil microbial biomass, water extractable carbon, soil moisture, and an inverse pattern of soil pH (Pabst et al., 2013). Peters et al. (2019) provided an overview of ecosystem processes measured on the same study sites. We found decomposition rates that were ca. 55 %–65 % lower compared to a study on a small subset of the same study sites (Becker and Kuzyakov, 2018). However, Becker and Kuzyakov (2018) used buried tea bags, while our litter bags were placed on the soil surface. Buried litter often decomposes faster compared to litter on the soil surface (e.g. Burgess et al., 2002; Fanin et al., 2020), at least at sites with < 3000 mm mean annual precipitation (Powers et al., 2009).
As expected, decomposition rates increased with increasing temperatures and with increasing humidity, with peaks on the lower slopes of the mountain where both temperatures and humidity were high (Fig. 2). However, combinations of temperature and relative air humidity for the highest decomposition rates were different in natural (ca. 10–15 °C, 90 %–100 %) and in disturbed sites (ca. 20–25 °C, 75 %–90 %; Fig. 3). Homegardens and coffee plantations are irrigated (Classen et al., 2014; Kimaro et al., 2019), and most of the maize fields we studied were rather small (< 10 000 m2), weeded by hand, and could therefore develop a herbal and grass layer during maize cultivation that decreased evaporation (Classen et al., 2015; Lasway et al., 2022). Therefore, soil moisture was probably considerably higher than relative air humidity suggested, facilitating decomposition in managed vegetation types. Consequently, we did not find an overall negative effect of disturbance on decomposition rates.
4.4 Decomposition in natural and disturbed forests
In natural forests, decomposition was significantly faster than in disturbed forests along the elevation gradient. Other studies focused either on disturbance (Attignon et al., 2004; Barlow et al., 2007; Cizungu et al., 2014; Martínez-Falcón et al., 2015) or on elevation gradients (Salinas et al., 2011; Bothwell et al., 2014; Marian et al., 2017; Esquivel et al., 2020) or compared forests with other vegetation types (Bohara et al., 2019). Lower decomposition rates in plantation forests or selectively logged forests were often attributed to a warmer and drier microclimate (Attignon et al., 2004; Barlow et al., 2007; Cizungu et al., 2014) or to lower richness and/or activity of invertebrates (Attignon et al., 2004; Martínez-Falcón et al., 2015) or to higher leaching of limiting nutrients from the soils (Both et al., 2017). However, some of these studies and others did not find any differences between primary and secondary or selectively logged forests. When decomposition rates were similar this was related to similar vegetation structure and resulting similar microclimate (Attignon et al., 2004; Vasconcelos and Laurance, 2005; Barlow et al., 2007), higher variation within than between forest types (Burghouts et al., 1992), and restored ecosystem functions like quantity and quality of litterfall (Burghouts et al., 1992; Barlow et al., 2007). In our study, the significant difference between natural and disturbed forests was largely driven by the large difference between natural and previously burned Podocarpus forests, probably due to differences in vegetation structure (Rutten et al., 2015). Mean decomposition rates in natural and selectively logged Ocotea forest or natural forest and agroforestry were not statistically different (Fig. 2). Therefore, disturbed forests can provide important ecosystem functions, but only when disturbance is not too severe.
4.5 Decomposition along the land-use gradient
Decomposition rates decreased with increasing land-use intensity, but only in the warm wet season. In the cold wet season, climate and an interaction of humidity and land-use intensity were the only significant terms. The study sites in each vegetation type were selected to cover the entire elevation range of the vegetation type. For the land-use gradient, this meant that study sites within a vegetation type covered at least 445 m of elevation (grasslands), a maximum of 620 m of elevation (homegardens), and 915 m overall (Table 1). This was a considerable climatic gradient, which seems to have been more important for decomposition in the cold wet season than any land-use-related differences between vegetation types. In the same vegetation types, soil organic carbon (Pabst et al., 2016) and soil microbial biomass decreased (Pabst et al., 2013), and soil organic matter turnover increased (Becker et al., 2015) with increasing land-use intensity, which is common for tropical forests that are converted to agricultural systems (Don et al., 2011). Still, these differences were not strong enough to reflect in decomposition rates at the soil surface in both seasons.
Instead, the relationship of decomposition rates and land-use intensity was seasonal. In the warm wet season, land-use intensity had the expected significantly negative effect on decomposition rates. On a small subset of the same study sites, mean annual decomposition rates of buried tea bags also decreased from lower montane forest to coffee plantation to homegarden, but only when decomposition rates were aggregated over a full year (Becker and Kuzyakov, 2018). In the cold wet season, Becker and Kuzyakov (2018), like us, found no differences in decomposition rates between these three vegetation types. They did not consider a grassland site. Other studies also found seasonal differences between land-use types, but not when they aggregated decomposition rates over a full year: Cuke and Srivastava (2016) found 9 % higher decomposition rates in orange plantations compared to natural forest, but only in a wet season. Peña-Peña and Irmler (2016) found higher decomposition rates in Cerrado forest compared to cropland and grasslands, but only in a dry season. Although there are studies emphasizing the importance of climatic conditions during the start of a decomposition experiment (e.g. Paudel et al., 2015a), the number of studies considering seasonal differences between land-use types is low, with ambiguous results (Mugendi and Nair, 1996; Cuke and Srivastava, 2016; and Irmler, 2016; Becker and Kuzyakov, 2018). Therefore, further studies are necessary to explore the relative effects of climate and land-use specific vegetation characteristics on seasonal decomposition patterns.
4.6 Low decomposition rates in grasslands
Decomposition rates in grasslands were only between one-half and two-thirds of those recorded for the other three land-use types at similar elevations (Table 1, Fig. 2b). Other studies comparing grasslands and forests related lower decomposition rates in grasslands to a more variable and more extreme microclimate due to missing structural complexity and canopy cover (Lorenzo et al., 2014; Paudel et al., 2015a). Forests are buffering microclimate, resulting in lower temperatures, higher humidity, and lower climatic variability (Thom et al., 2020; Guarderas et al., 2022). Vegetation structure in homegardens was comparable to forests, and the sampled coffee plantations were irrigated, fertilized, and featured shade trees (Rutten et al., 2015). However, decomposition in tropical grasslands can also be similar to forests at similar elevations when termite abundance was higher in grasslands than in forests (Kagezi et al., 2016, 2011), or even higher, when soils were moister in grasslands than in forests on ridges (Bohara et al., 2019). In our study, termite abundance was low (Röder et al., 2017), and topography was similar for grasslands and forests. Additionally, recurring fire events in grasslands and savanna probably contributed to lower decomposition rates in these vegetation types (Gerschlauer et al., 2019).
4.7 Savanna and maize fields
Despite higher land-use intensity, decomposition rates were higher in maize fields compared to savanna in the cold wet season. This could have been a “home-field advantage”, due to a decomposer community adapted to maize straw (Hunt et al., 1988). However, Becker and Kuzyakov (2018) found the same pattern in the same season and overall using buried tea bags, which makes this explanation unconvincing. Instead, the results of Pabst et al. (2016) suggest that microbial communities in maize fields have a high substrate demand but small nutrient use efficiency. And this high demand for easily available substrates resulted in an up to 2-fold increase in glucose decomposition rates in maize fields compared to savanna soils (Mganga and Kuzyakov, 2014). Available substrate is rare, though, because most of the maize residues are used as fodder or burned (Becker et al., 2015; Gerschlauer et al., 2019). Therefore, fast decomposition is possible in maize fields, if there is suitable substrate. And when soil moisture is not limiting, nitrogen fertilization can further increase early stage decomposition rates (Gill et al., 2021), which agrees with our findings. In the warm wet season, some of the fields were left bare, i.e. without crops, watering, and herbal undergrowth. This was probably the reason for lower decomposition rates in this season.
Our study showed that not all studied types of disturbance had negative effects on litter decomposition. Instead, climate was the major driver of decomposition in this study. Effects of disturbance were dependent on the subset of analysed vegetation types and on the season. We found significantly lower rates of decomposition in disturbed forests compared to natural forests along the elevation gradient, but only when we did not include other vegetation types in the analyses. High land-use intensity resulted in lower decomposition rates, but only in the warm wet season, when decomposition rates were overall lower than in the cold wet season. A drawback of this study is the short duration of the decomposition experiments. An experiment covering at least 1 full year would be desirable, but it would face severe logistic challenges, especially in the managed vegetation types. We lost a high number of bags to accidental or willful damage and to soil contamination. Despite these challenges, our study provides litter decomposition data for a large range of vegetation types in a region that is still understudied. While there are decomposition studies along gradients of land-use intensity in the tropics, there are few from the Afrotropics. This study is also only the fourth litter decomposition study along an elevation gradient in this region (Negash and Starr, 2021; Becker and Kuzyakov, 2018; Mugendi and Nair, 1996). More studies are needed to better understand changes in carbon cycling due to climate change, deforestation, and land conversion in this heterogenous mix of land-use types, with consequences for soil fertility and productivity.
Table A1Mean mass loss and decomposition rates per study site in the cold wet and in the warm wet season 2012. Decomposition rate constant k was estimated as the slope of a log-linear regression of a single exponential model using all bags per site per season. Therefore, there is only one value per site per season. Abbreviations of vegetation types: sav – savanna, mai – maize field, flm – lower montane forest, hom – homegarden, gra – grassland, cof – coffee plantation, foc – Ocotea forest, fod – disturbed Ocotea forest, fpo – Podocarpus forest, fpd – disturbed Podocarpus forest, fer – Erica forest, hel – Helichrysum community, Seasons: cw – cold wet, ww – warm wet. Collections: 1 – after ca. 5 weeks, 2 – after ca. 10 weeks. MMT – mean monthly temperature, MMH – mean monthly humidity (for calculation see Table 1), LUI – land-use intensity index (from Classen et al., 2015).
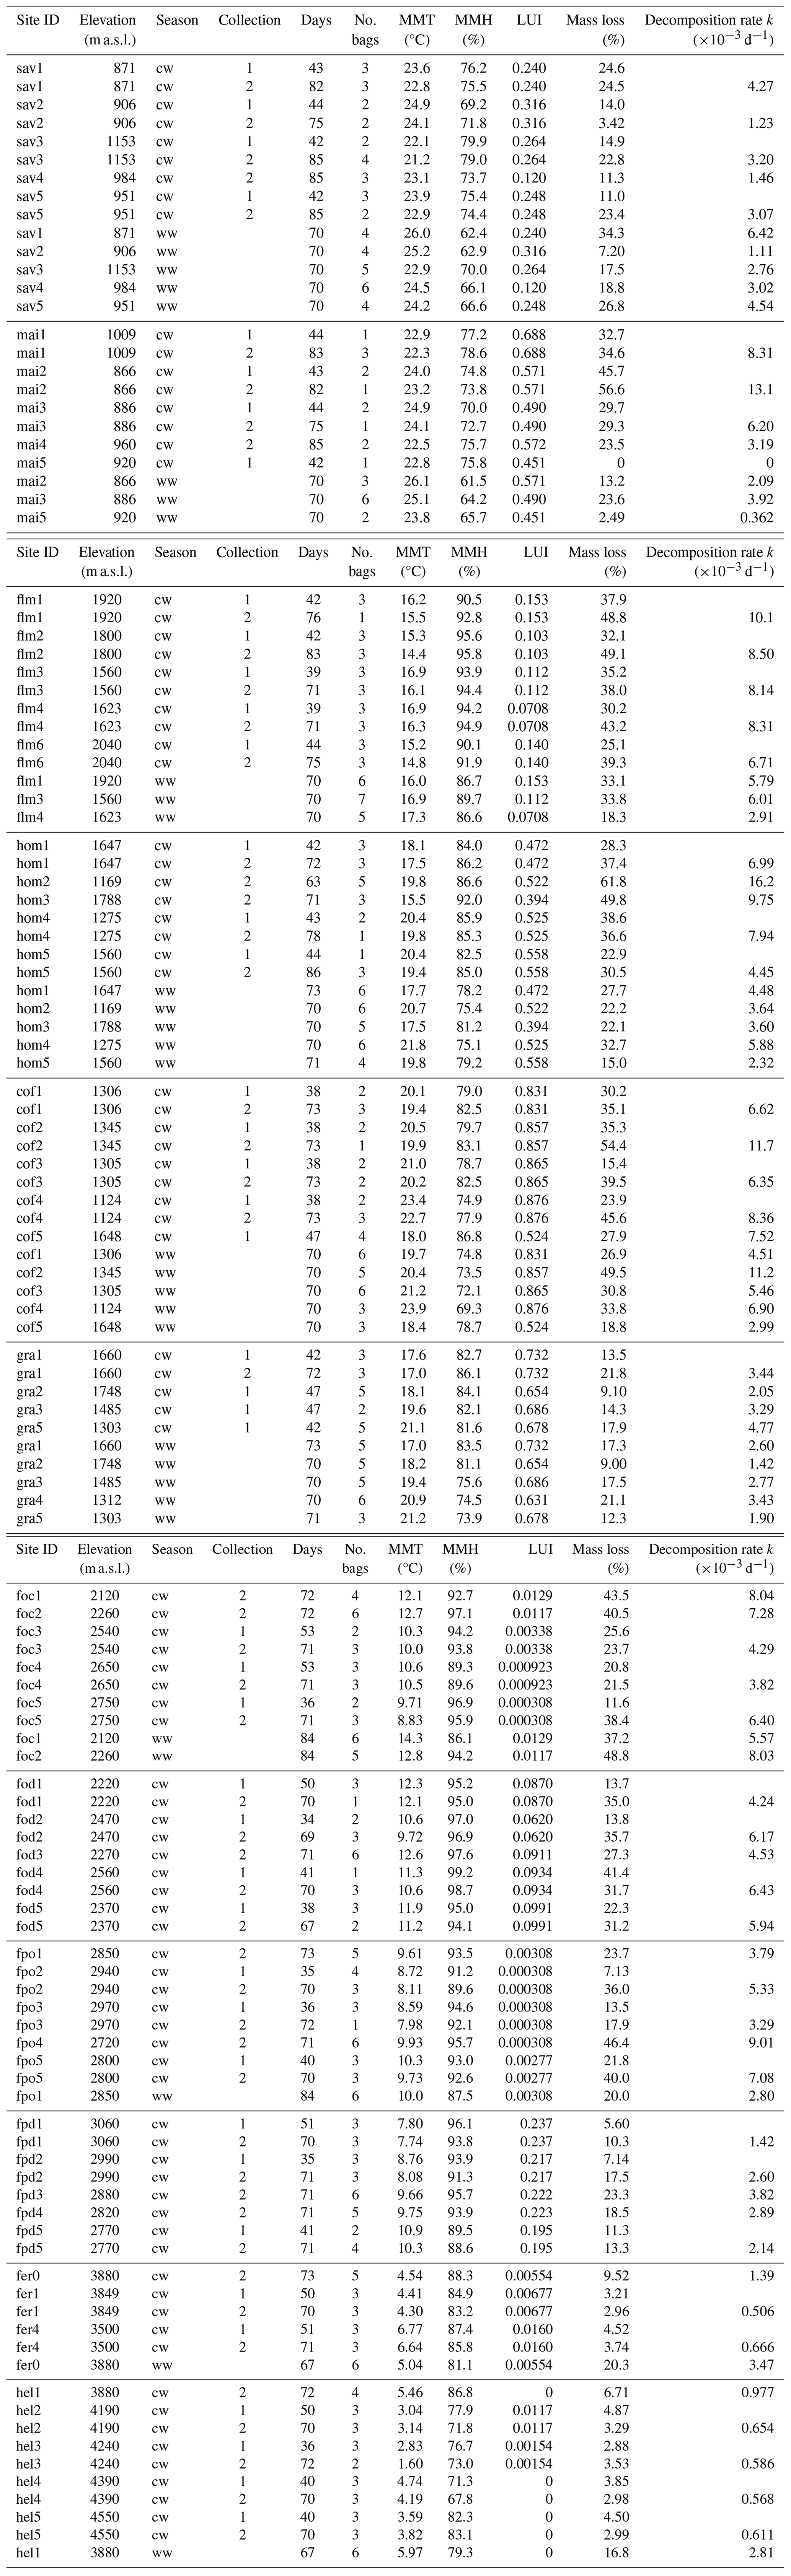
Table A2ANOVA results for pairs of vegetation types at four elevation levels. CI – 95 % confidence interval.
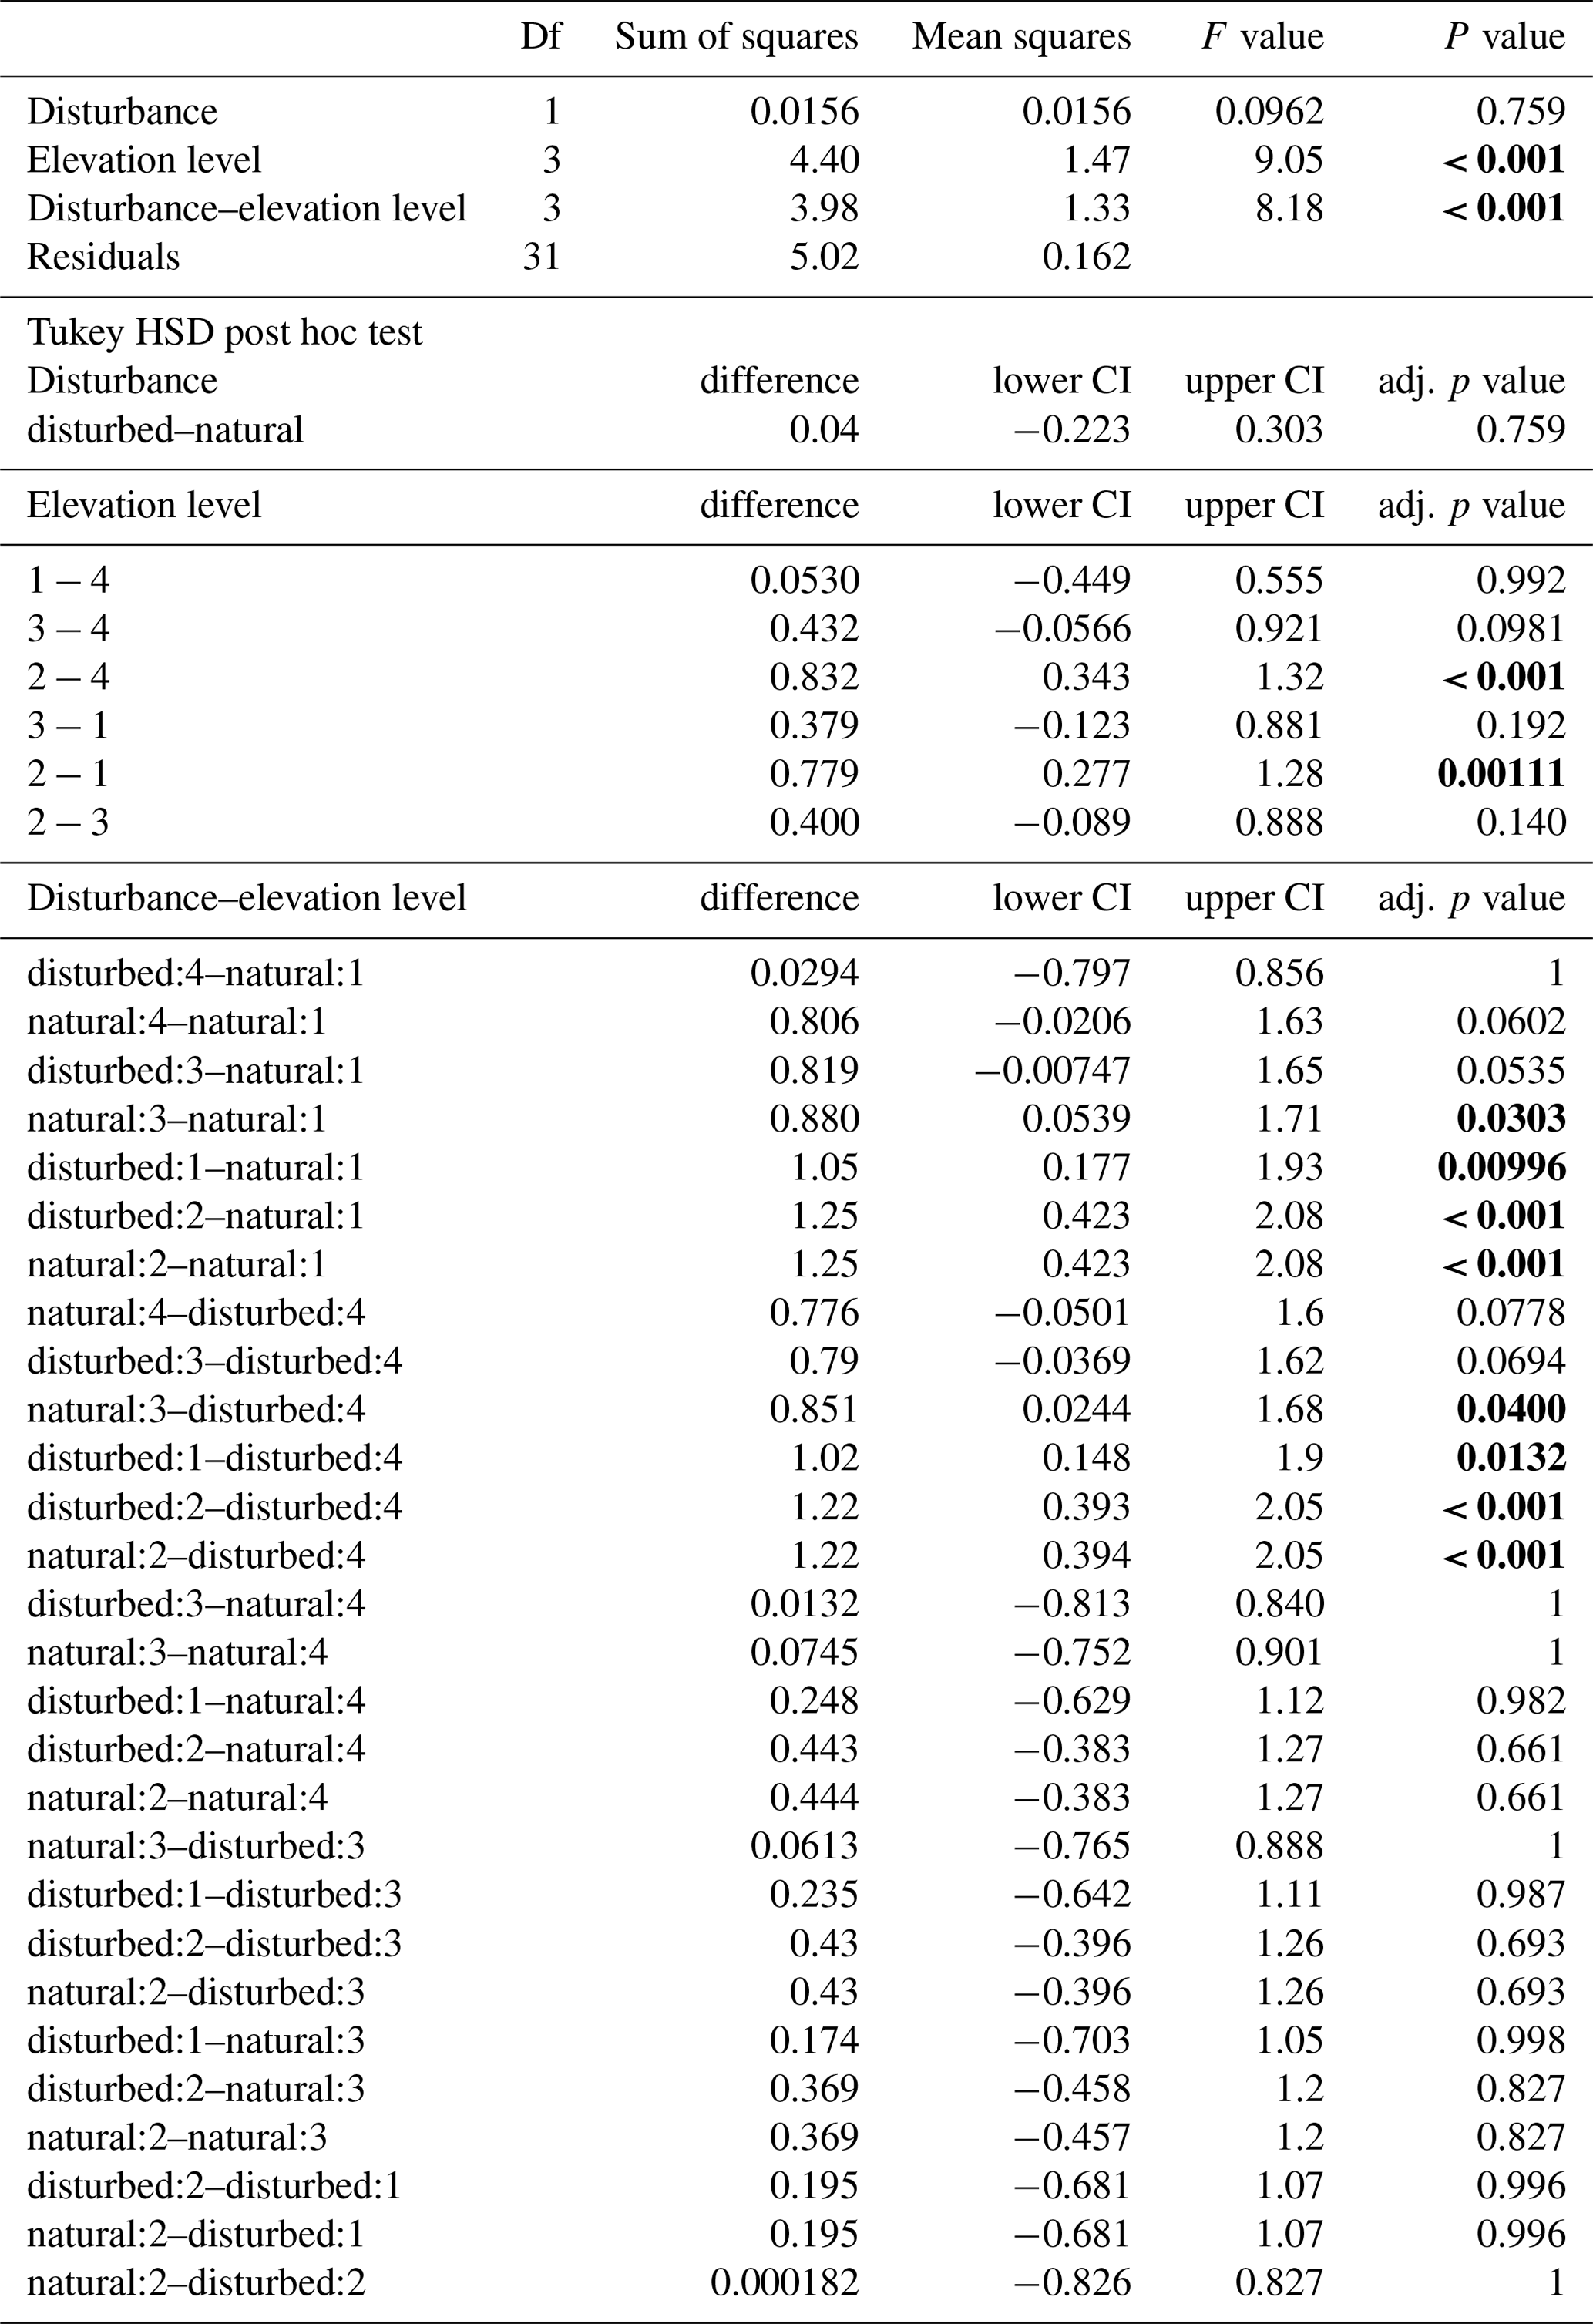
Table A3ANOVA results for pairs of forest types at three elevation levels. CI – 95 % confidence interval.
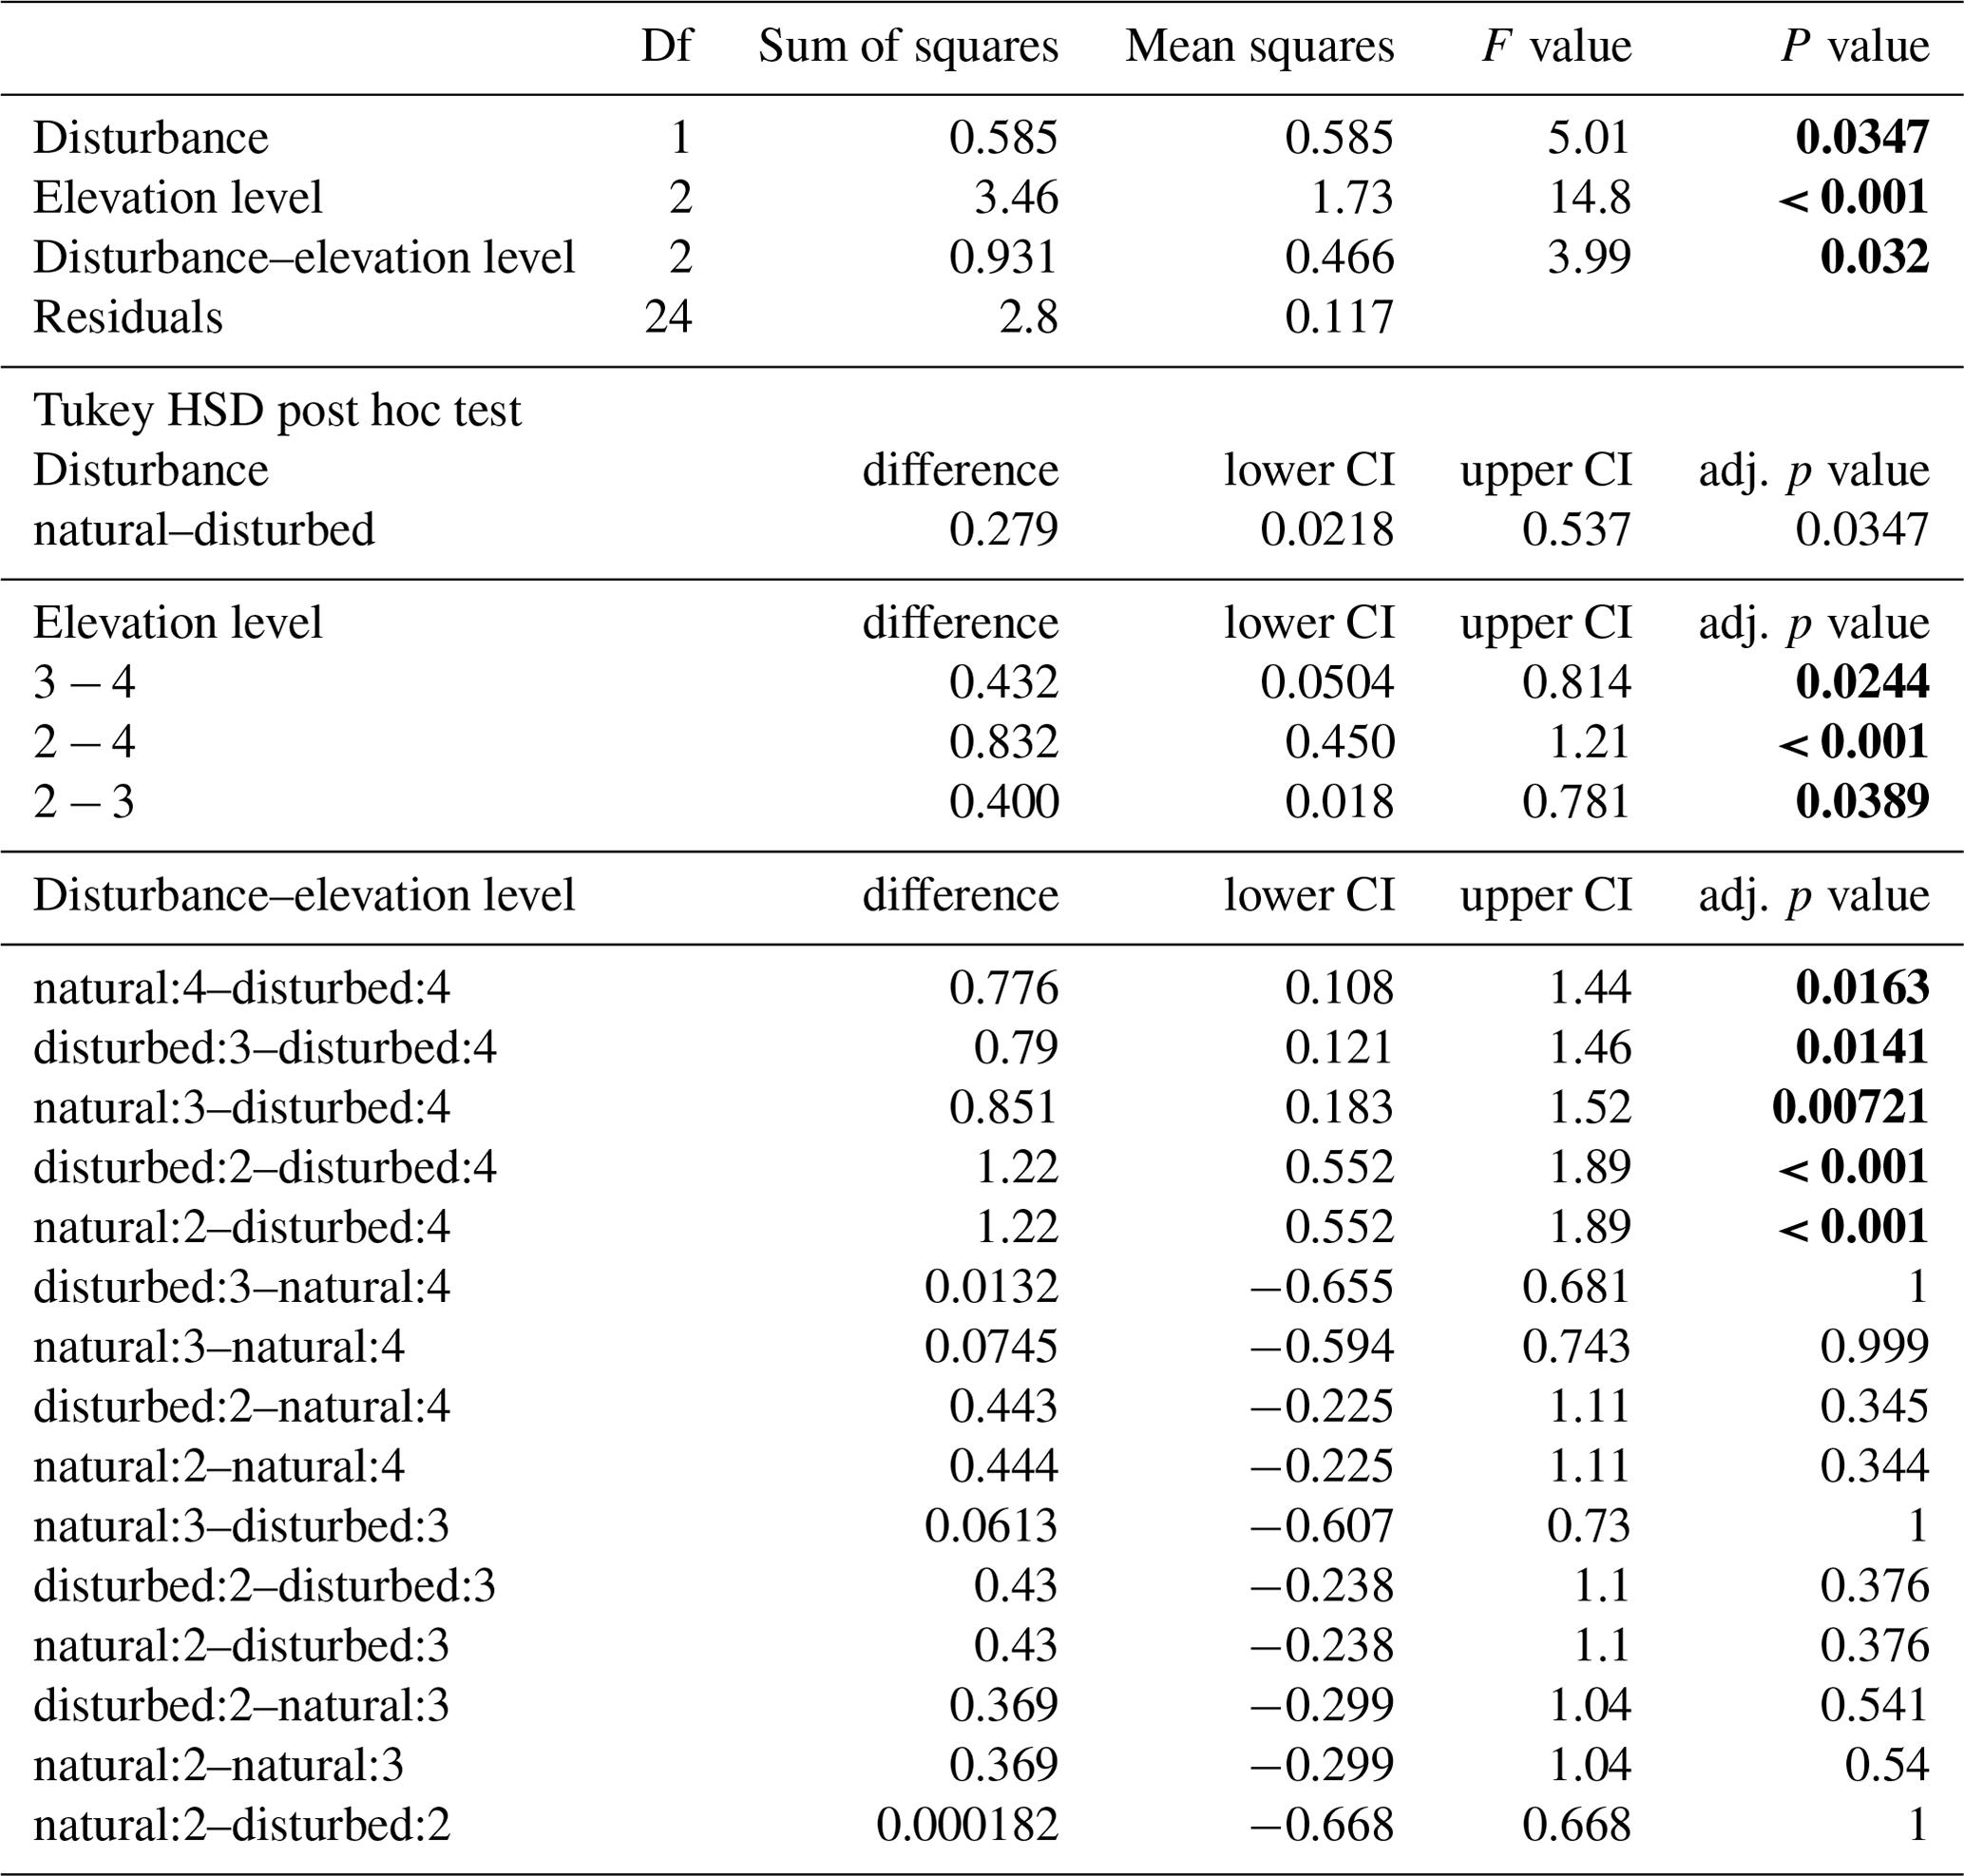
Table A4ANOVA results for the four vegetation types along the land-use gradient in the cold wet season (March–May 2012). CI – 95 % confidence interval.
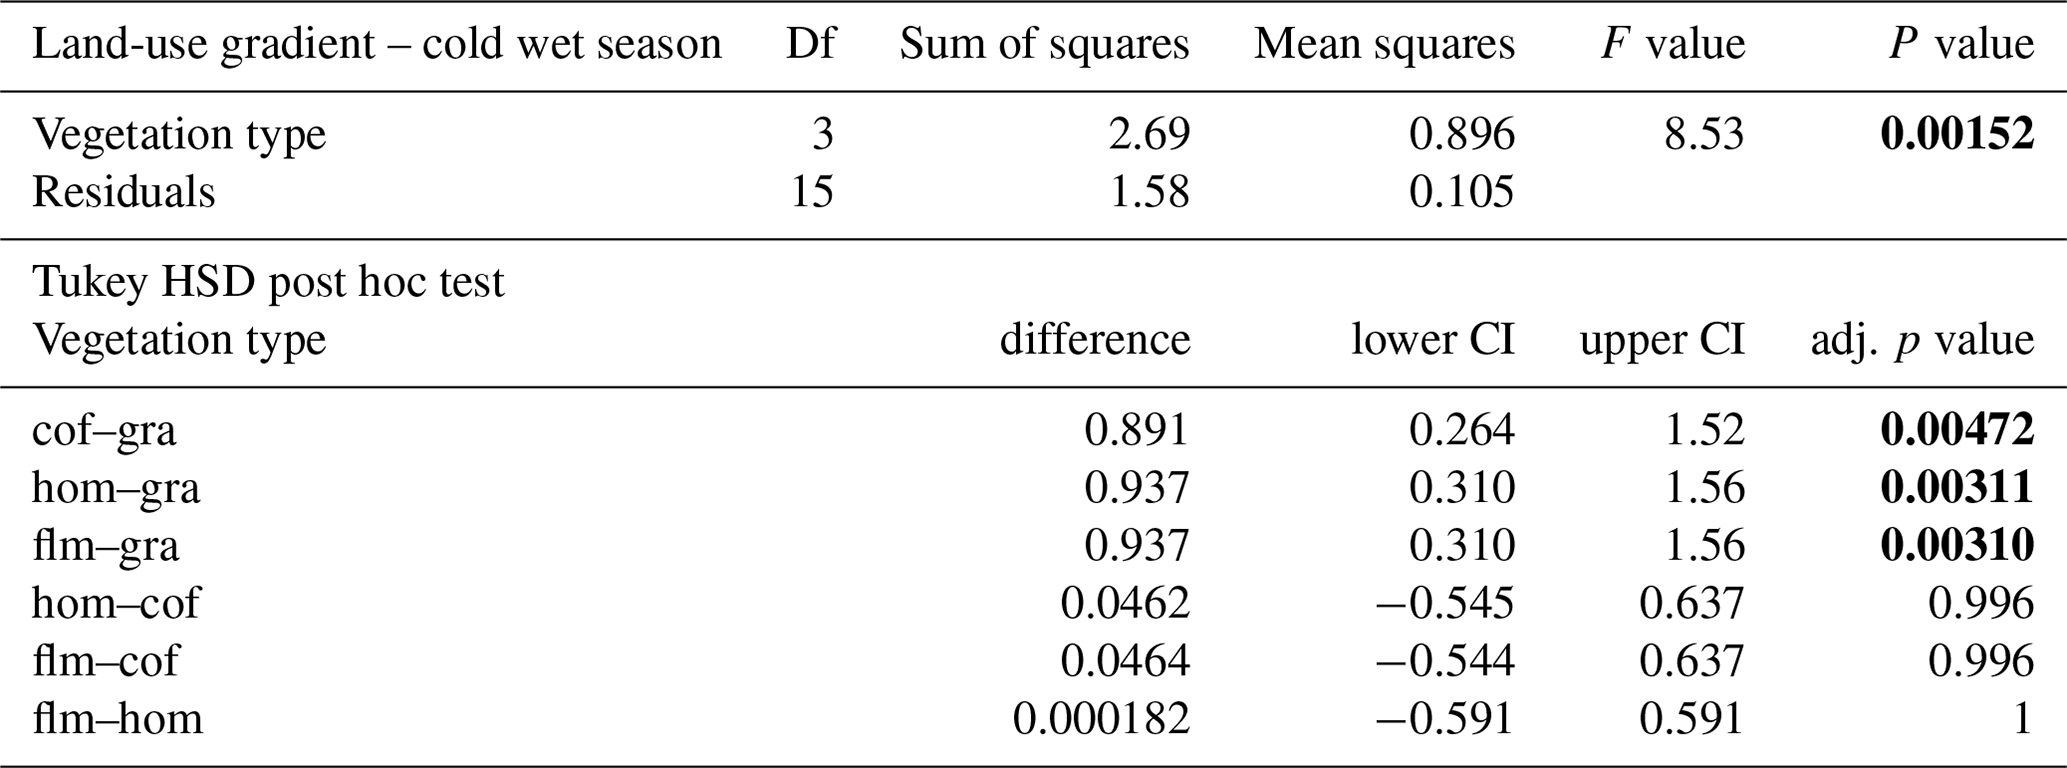
Table A5ANOVA results for the four vegetation types along the land-use gradient in the warm wet season (September–December 2012). CI – 95 % confidence interval.
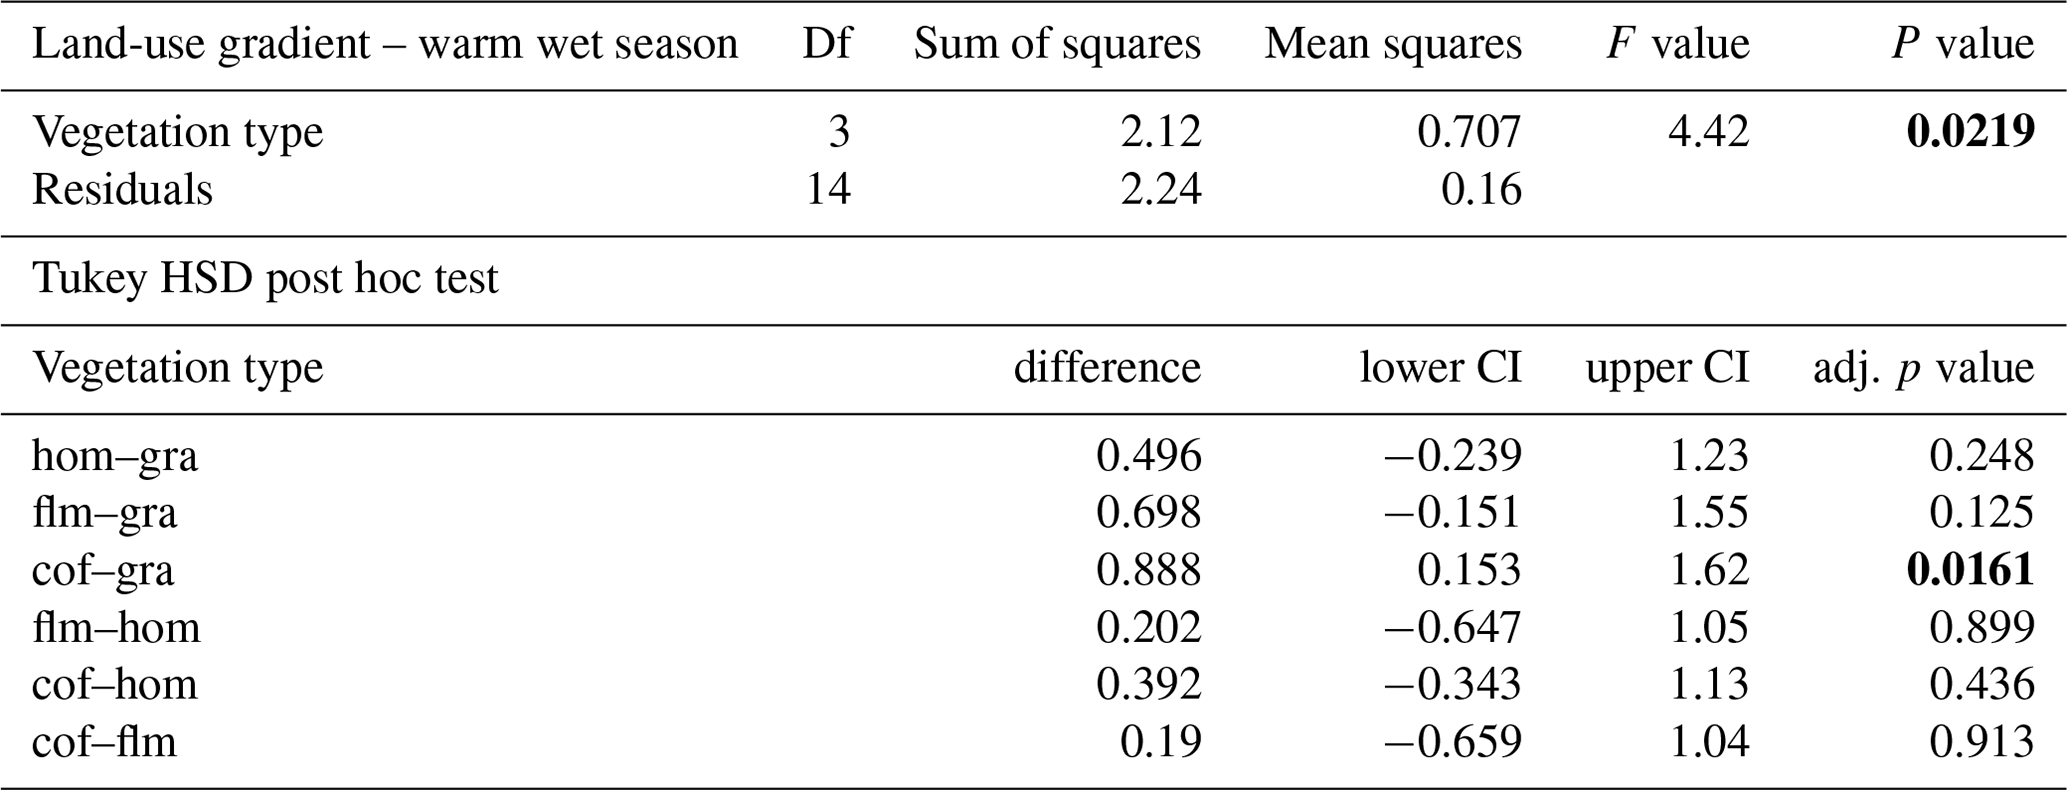
Table A6ANOVA results for the lower six vegetation types comparing decomposition rates in the cold wet season and in the warm wet season. CI – 95 % confidence interval.
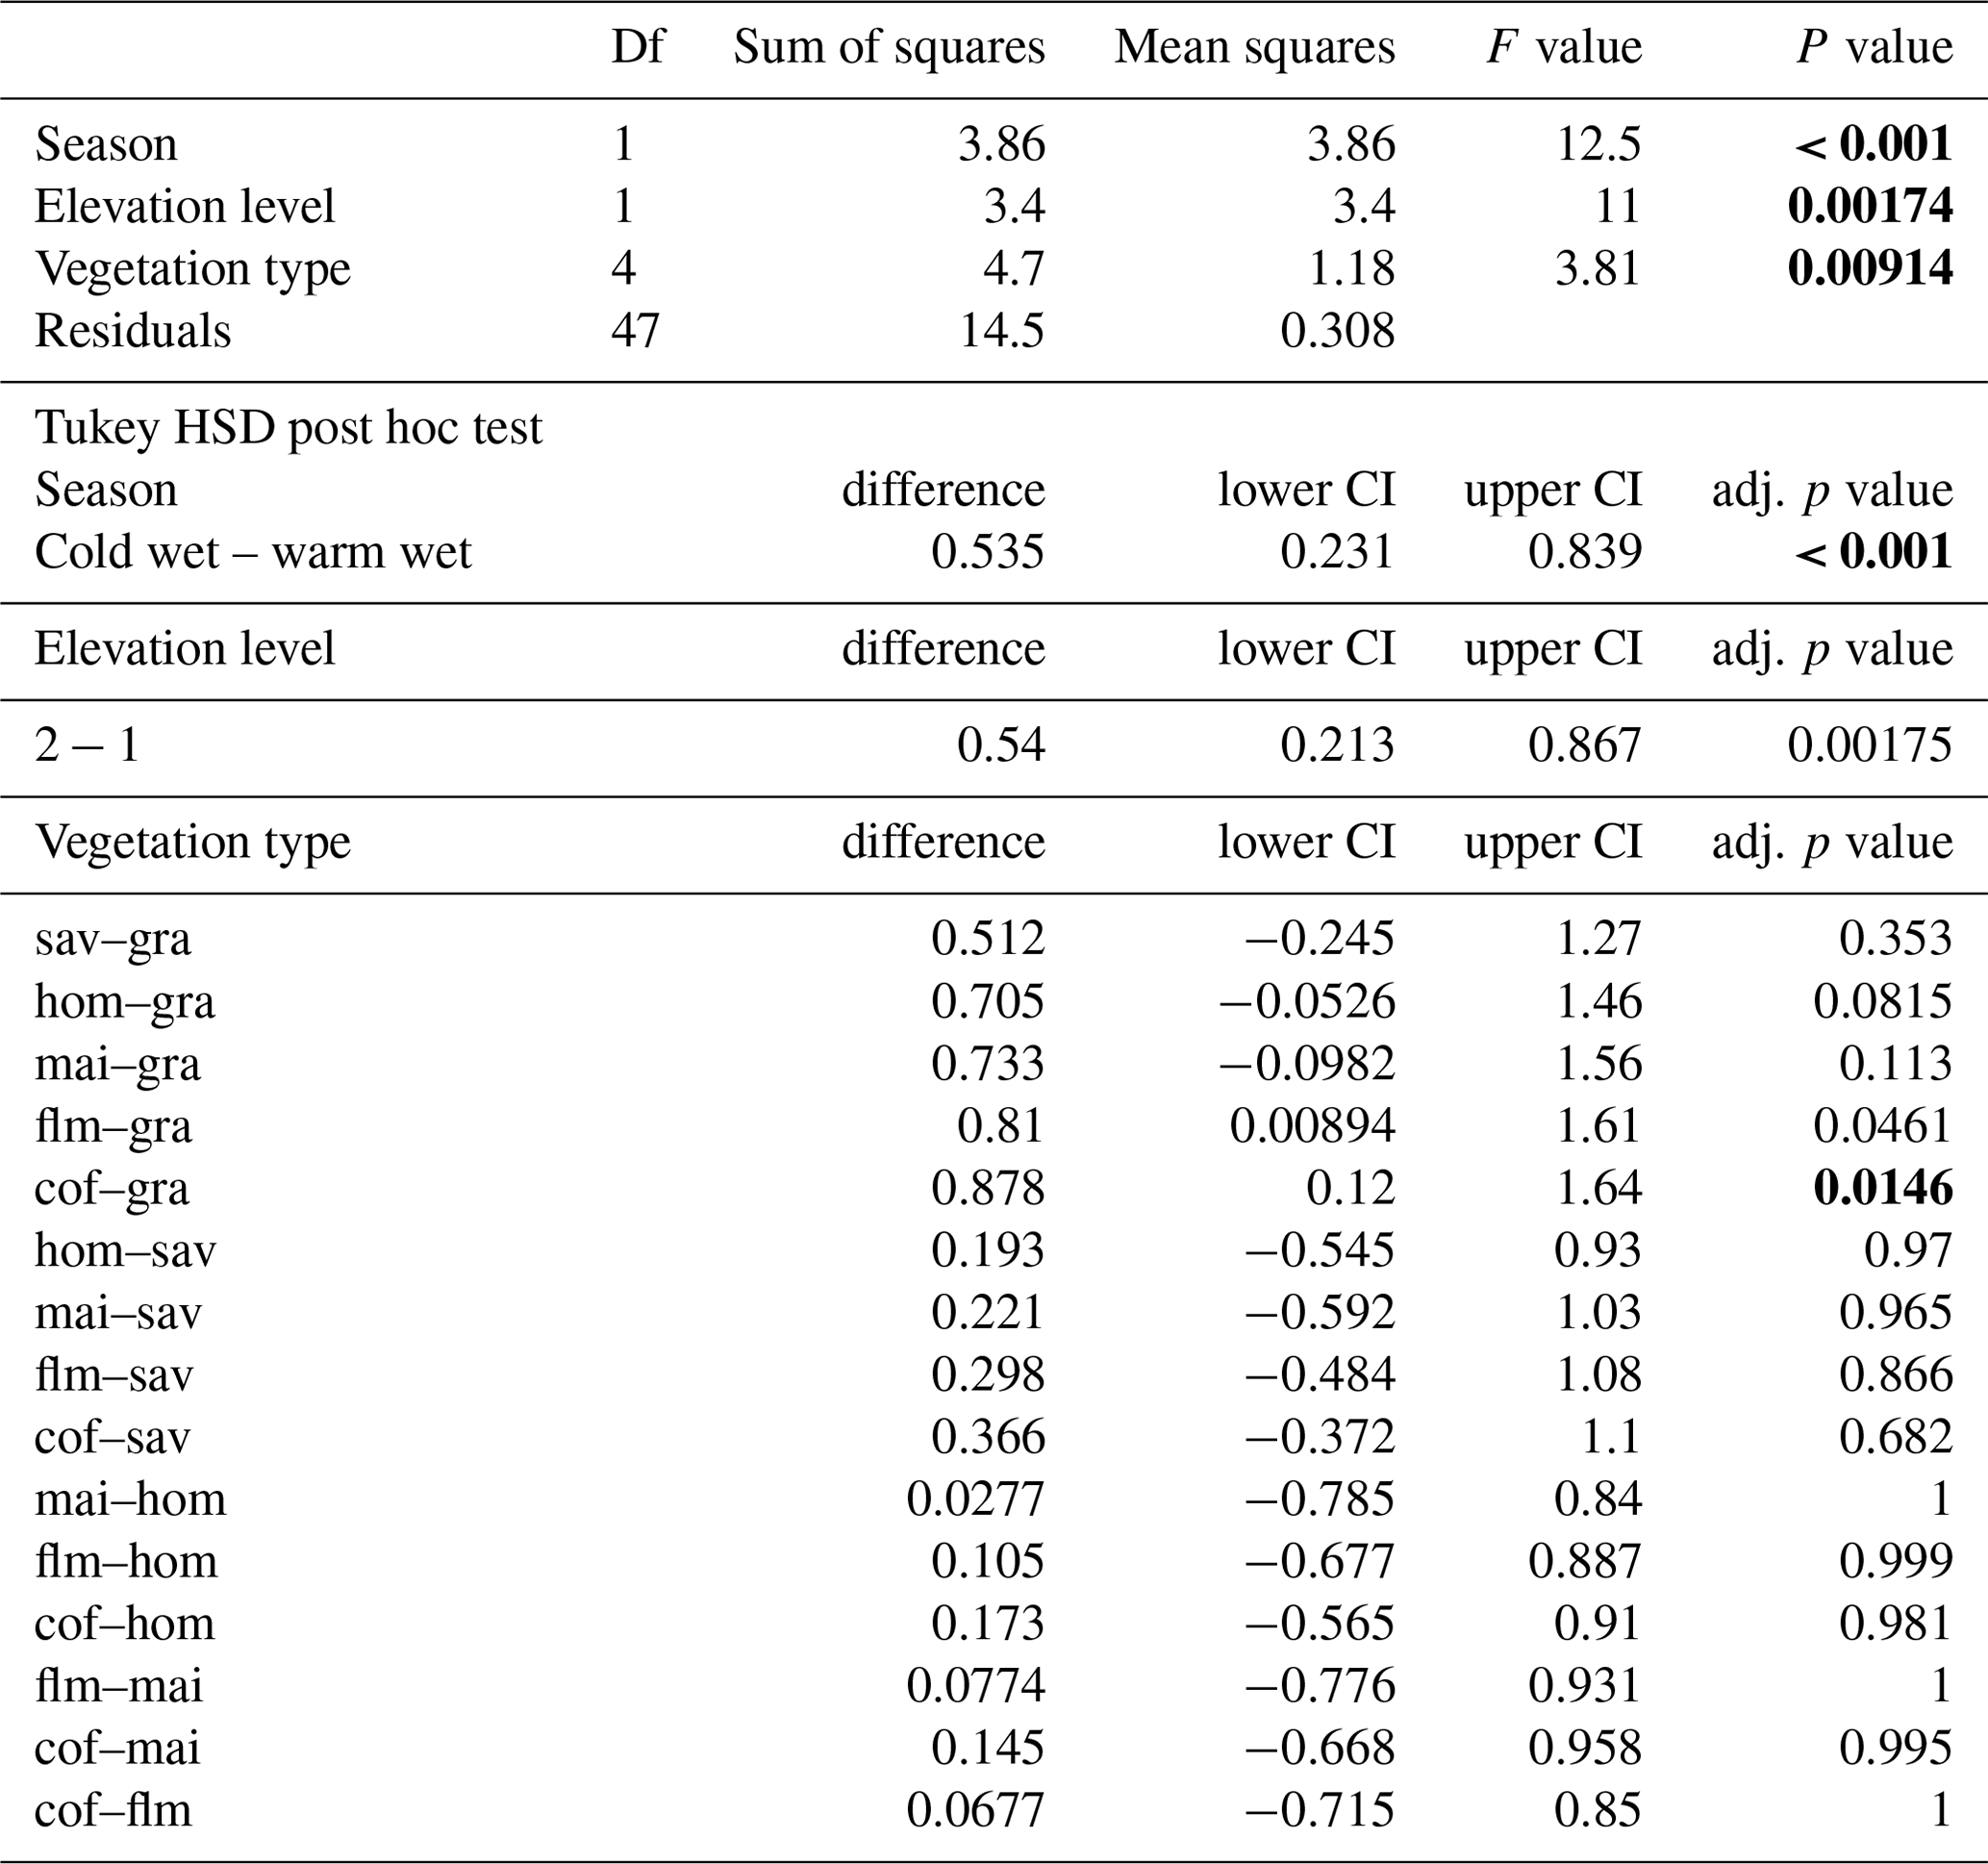
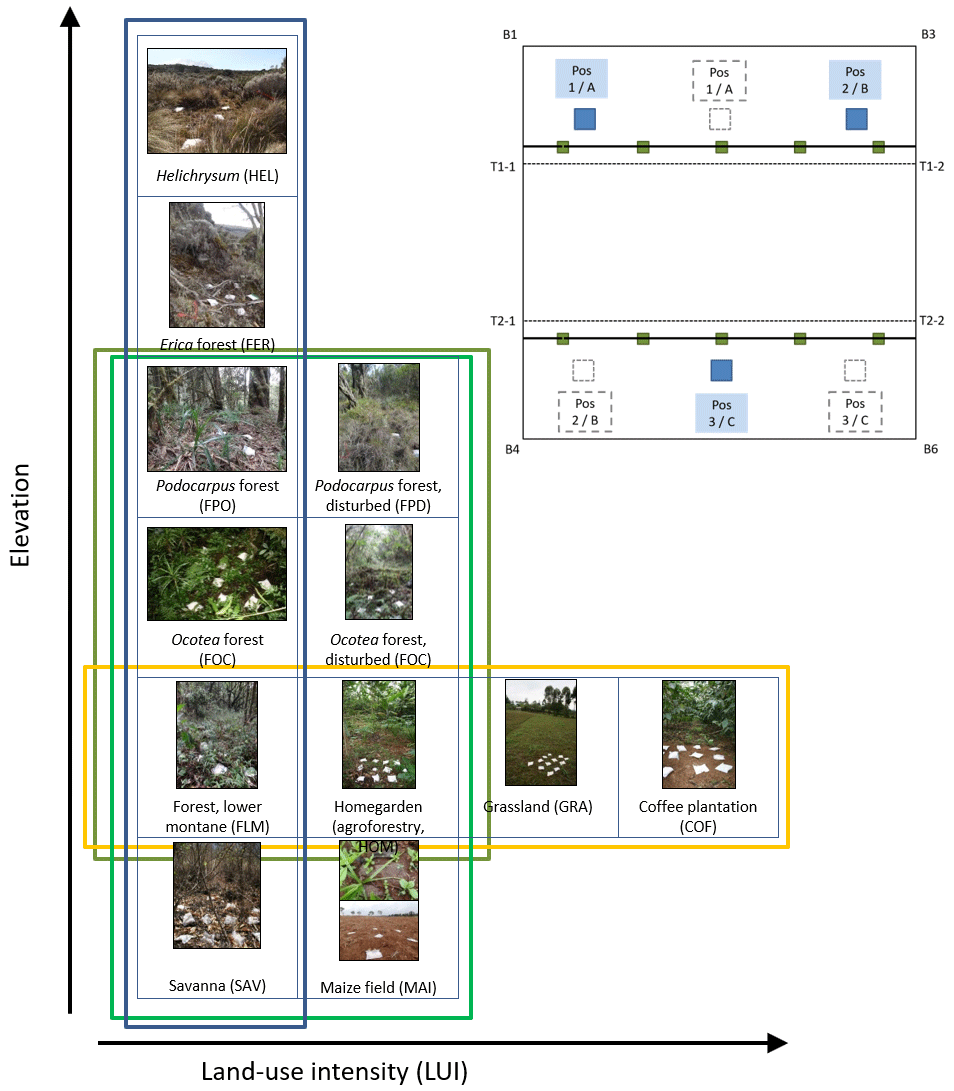
Figure A1Overview of vegetation types, disturbance, and land-use intensity in the KiLi project study design. Blue box indicates natural vegetation types along an elevation gradient of 3600 m. Light green box indicates four pairs of natural and disturbed vegetation types at four different elevation levels. Dark green box indicates three pairs of natural and disturbed forest types at three different elevation level. Yellow box indicates four vegetation types sorted by increasing land-use intensity at similar elevations. Pictures show one of three subplots fit with litter bags on one of the study sites for each of the vegetation types. Inset with experimental design: litter bags were arranged in three subplots per study site to cover site inherent heterogeneity. Transect lines T1 and T2 are parallel to the slope. Photographs by Juliane Röder.
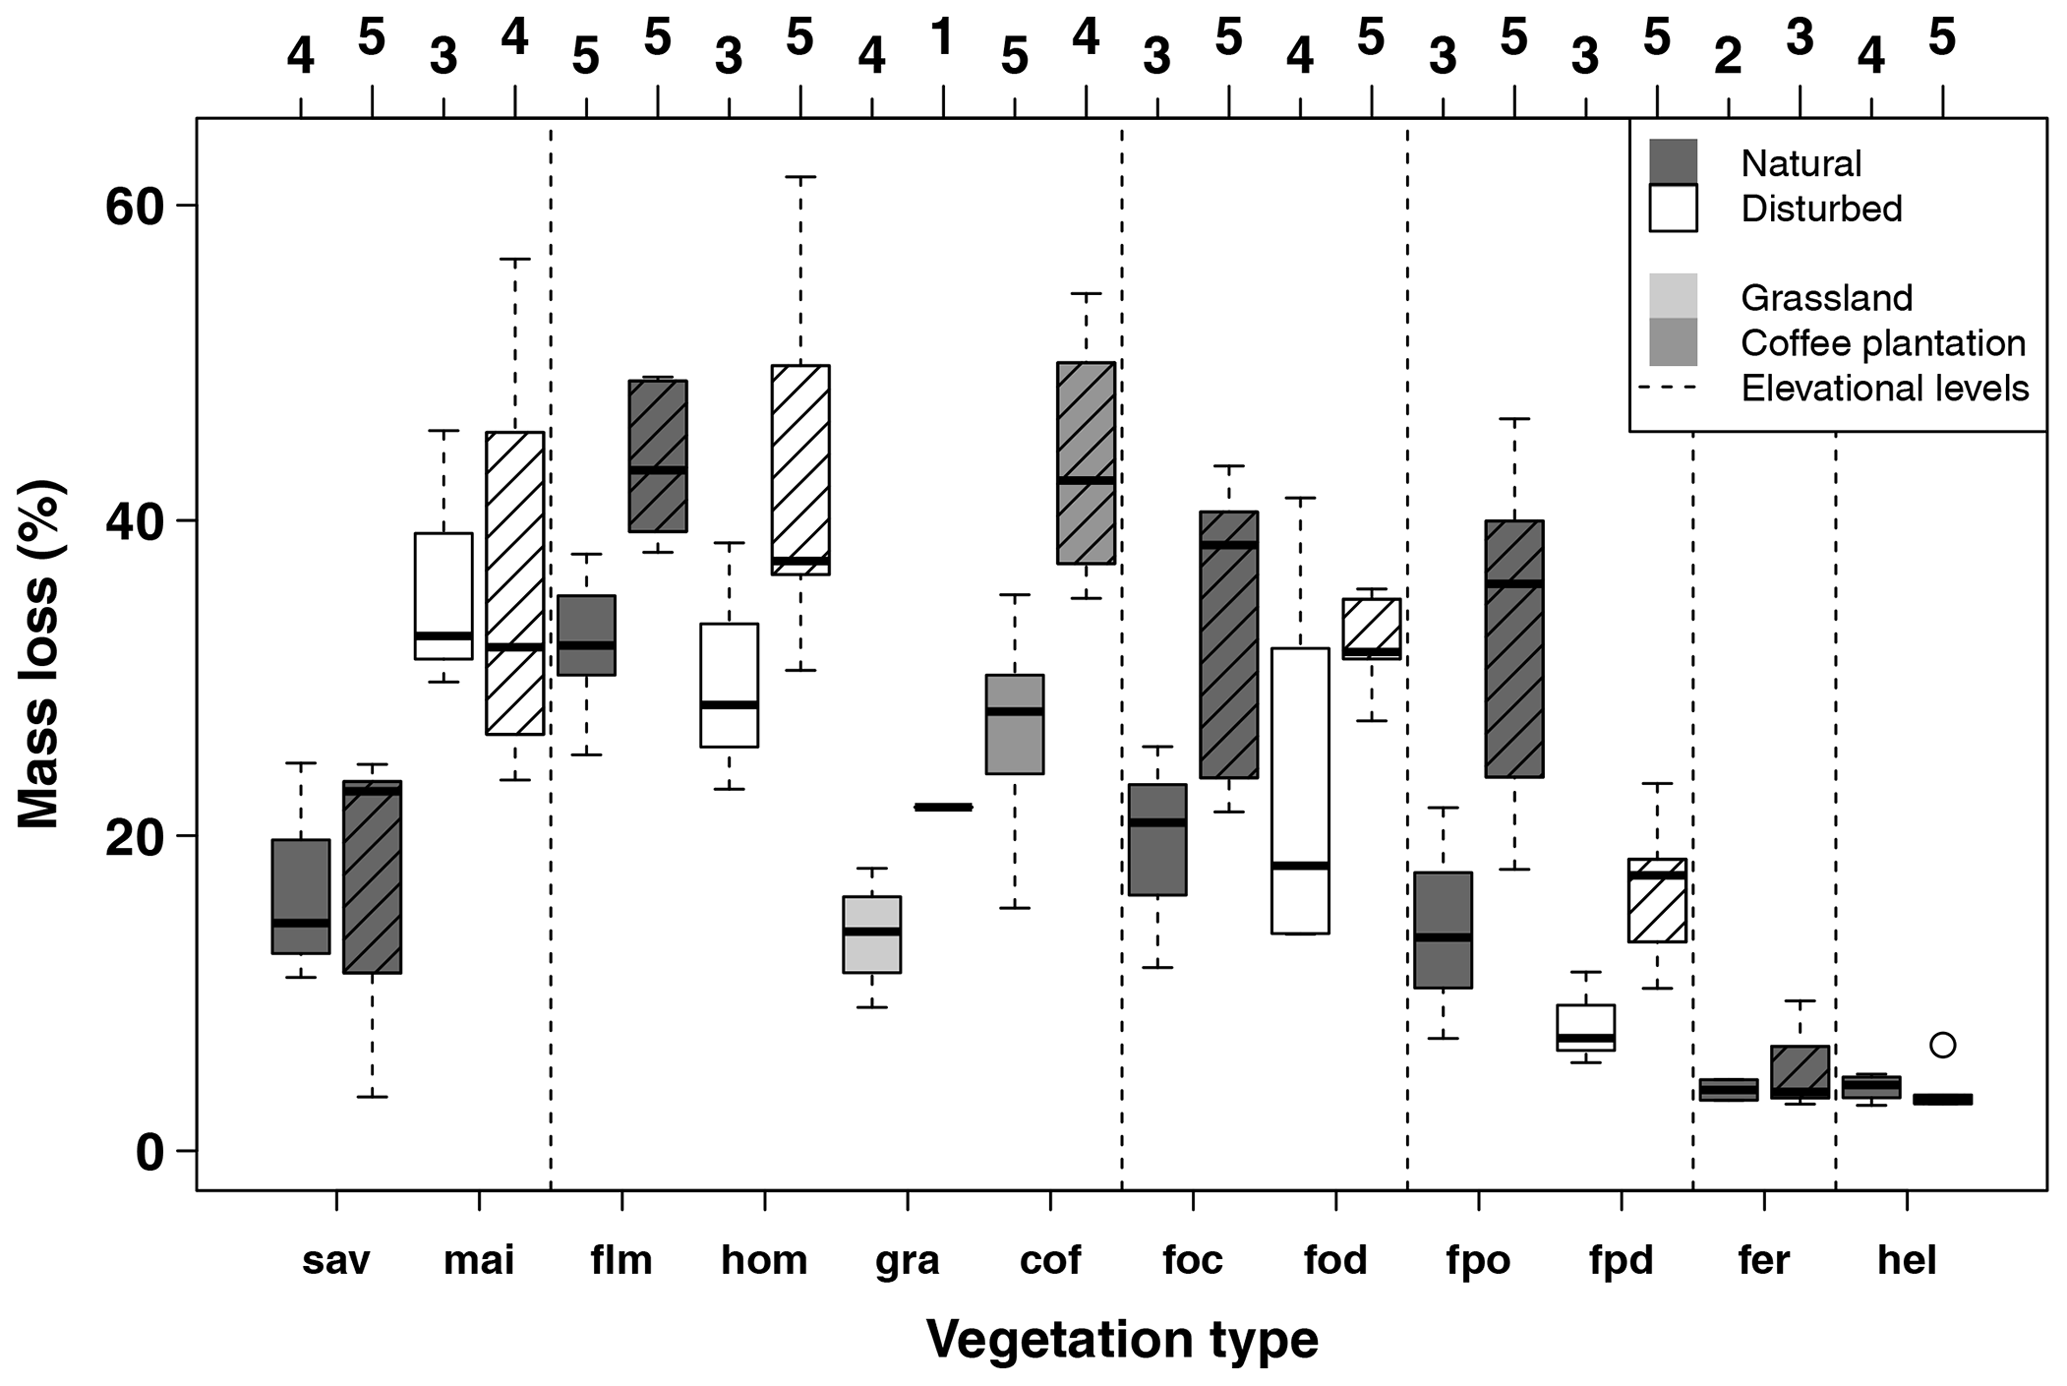
Figure A2Mass loss per site per vegetation type for the first (34–53 d, left) and second (63–86 d, right, striped boxes) collection in the cold wet season (March–May 2012). Numbers on top of the boxes indicate the number of sites considered per box. Blue boxes indicate natural vegetation types; orange to red boxes indicate disturbed vegetation types. Vertical dashed lines separate six elevation levels, sorted from left to right according to increasing elevation. Vegetation types within elevation levels are sorted from low to high land-use intensity from left to right. Boxes show median and 25 %–75 % interval; whiskers extend to max. 1.5 × of box length. Abbreviations: sav – savanna, mai – maize field, flm – lower montane forest, hom – homegarden, gra – grassland, cof – coffee plantation, foc – Ocotea forest, fod – disturbed Ocotea forest, fpo – Podocarpus forest, fpd – disturbed Podocarpus forest, fer – Erica forest, hel – Helichrysum community.
Code is available from the corresponding author upon reasonable request.
Raw data are available at PANGAEA (decomposition data: https://doi.org/10.1594/PANGAEA.964727, Röder and Brandl, 2024; climate data: https://doi.org/10.1594/PANGAEA.942822, Appelhans et al., 2022).
RB and TN conceptualized and acquired funding for the project and planned the field campaigns together with JR, TA, and MKP. JR and TA conducted the field campaigns and supervised field and lab assistants who helped to acquire and process the samples. JR analysed and visualized the data and wrote the manuscript draft. RB, TN, MKP, and TA reviewed and edited the manuscript.
At least one of the (co-)authors is a member of the editorial board of Web Ecology. The peer-review process was guided by an independent editor, and the authors also have no other competing interests to declare.
Publisher’s note: Copernicus Publications remains neutral with regard to jurisdictional claims made in the text, published maps, institutional affiliations, or any other geographical representation in this paper. While Copernicus Publications makes every effort to include appropriate place names, the final responsibility lies with the authors.
We thank the Tanzania Wildlife Research Institute (TaWiRI) and the Tanzanian Commission for Science and Technology (COSTECH) for granting Juliane Röder, Tim Appelhans, and Marcell K. Peters research permits (Juliane Röder: 2010-363-NA-96-44 and 2011-346-ER-96-44; Tim Appelhans: 2010-350-NA-96-44; Marcell K. Peters: 2010-369-NA-96-44) and several private landowners and the Kilimanjaro National Park (KINAPA) for permission to conduct research on their property and in the national park. We thank Andreas and Claudia Hemp for general logistic support in Tanzania and Jumanne Mwinyi and Raimund Zaria for support in the field. This study was conducted in the framework of the DFG research unit FOR 1246: “Kilimanjaro ecosystems under global change: Linking biodiversity, biotic interactions and biogeochemical ecosystem processes”.
This research has been supported by the Deutsche Forschungsgemeinschaft (DFG project number 107847609, grant nos. BR 1293/10-1, BR 1293/10-2, NA 783/5-1, NA 783/5-2, and AP 243/1-2).
This paper was edited by Erinne Stirling and reviewed by two anonymous referees.
Aerts, R.: Climate, leaf litter chemistry and leaf litter decomposition in terrestrial ecosystems: A triangular relationship, Oikos, 79, 439–449, https://doi.org/10.2307/3546886, 1997.
Appelhans, T., Mwangomo, E., Hardy, D. R., Hemp, A., and Nauss, T.: Evaluating machine learning approaches for the interpolation of monthly air temperature at Mt. Kilimanjaro, Tanzania, Spat. Stat.-Neth., 14, 91–113, https://doi.org/10.1016/j.spasta.2015.05.008, 2015.
Appelhans, T., Mwangomo, E., Otte, I., Detsch, F., Nauss, T., and Hemp, A.: Eco-meteorological characteristics of the southern slopes of Kilimanjaro, Tanzania, Int. J. Climatol., 36, 3245–3258, https://doi.org/10.1002/joc.4552, 2016.
Appelhans, T., Mwangomo, E., Otte, I., Detsch, F., Wöllauer, S., Zeuss, D., Nauss, T., and Hemp, A.: Processed climate station data for the southern slopes of Kilimanjaro, Tanzania, PANGAEA [data set], https://doi.org/10.1594/PANGAEA.942822, 2022.
Attignon, S. E., Weibel, D., Lachat, T., Sinsin, B., Nagel, P., and Peveling, R.: Leaf litter breakdown in natural and plantation forests of the Lama forest reserve in Benin, Appl. Soil Ecol., 27, 109–124, https://doi.org/10.1016/j.apsoil.2004.05.003, 2004.
Barlow, J., Gardner, T. A., Ferreira, L. V., and Peres, C. A.: Litter fall and decomposition in primary, secondary and plantation forests in the Brazilian Amazon, Forest Ecol. Manag., 247, 91–97, https://doi.org/10.1016/j.foreco.2007.04.017, 2007.
Becker, J., Pabst, H., Mnyonga, J., and Kuzyakov, Y.: Annual litterfall dynamics and nutrient deposition depending on elevation and land use at Mt. Kilimanjaro, Biogeosciences, 12, 5635–5646, https://doi.org/10.5194/bg-12-5635-2015, 2015.
Becker, J. N. and Kuzyakov, Y.: Teatime on Mount Kilimanjaro: Assessing climate and land-use effects on litter decomposition and stabilization using the Tea Bag Index, Land Degrad. Dev., 29, 2321–2329, https://doi.org/10.1002/ldr.2982, 2018.
Berg, B. and Lönn, M.: Long-term effects of climate and litter chemistry on rates and stable fractions of decomposing Scots pine and Norway spruce needle litter–A synthesis, Forests, 13, 125, https://doi.org/10.3390/f13010125, 2022.
Berg, B. and Staaf, H.: Decomposition rate and chemical changes of Scots pine needle litter. II. Influence of chemical composition, Ecol. Bull., 373–390, 1980.
Bernhardt, D. C., Ponce, N. M. A., Basanta, M. F., Stortz, C. A., and Rojas, A. M.: Husks of Zea mays as a potential source of biopolymers for food additives and materials' development, Heliyon, 5, e01313, https://doi.org/10.1016/j.heliyon.2019.e01313, 2019.
Bohara, M., Yadav, R. K. P., Dong, W., Cao, J., and Hu, C.: Nutrient and isotopic dynamics of litter decomposition from different land uses in naturally restoring Taihang Mountain, North China, Sustainability, 11, 1752, https://doi.org/10.3390/su11061752, 2019.
Both, S., Elias, D. M. O., Kritzler, U. H., Ostle, N. J., and Johnson, D.: Land use not litter quality is a stronger driver of decomposition in hyperdiverse tropical forest, Ecol. Evol., 7, 9307–9318, https://doi.org/10.1002/ece3.3460, 2017.
Bothwell, L. D., Selmants, P. C., Giardina, C. P., and Litton, C. M.: Leaf litter decomposition rates increase with rising mean annual temperature in Hawaiian tropical montane wet forests, PeerJ, 2, e685, https://doi.org/10.7717/peerj.685, 2014.
Burgess, M. S., Mehuys, G. R., and Madramootoo, C. A.: Decomposition of grain-corn residues (Zea mays L.): A litterbag study under three tillage systems, Can. J. Soil Sci., 82, 127–138, https://doi.org/10.4141/S01-013, 2002.
Burghouts, T., Ernsting, G., Korthals, G., and Devries, T.: Litterfall, leaf litter decomposition and litter invertebrates in primary and selectively logged dipterocarp forest in Sabah, Malaysia, Philos. T. R. Soc. B, 335, 407–416, https://doi.org/10.1098/rstb.1992.0032, 1992.
Canessa, R., Brink, L., Saldaña, A., Rios, R. S., Hättenschwiler, S., Mueller, C. W., Prater, I., Tielbörger, K., and Bader, M. Y.: Relative effects of climate and litter traits on decomposition change with time, climate and trait variability, J. Ecol., 109, 447–458, https://doi.org/10.1111/1365-2745.13516, 2021.
Castillo-Figueroa, D.: Carbon cycle in tropical upland ecosystems: a global review, Web Ecol., 21, 109–136, https://doi.org/10.5194/we-21-109-2021, 2021.
Chan, R. Y., Vuille, M., Hardy, D. R., and Bradley, R. S.: Intraseasonal precipitation variability on Kilimanjaro and the East African region and its relationship to the large-scale circulation, Theor. Appl. Climatol., 93, 149–165, https://doi.org/10.1007/s00704-007-0338-9, 2008.
Cizungu, L., Staelens, J., Huygens, D., Walangululu, J., Muhindo, D., Van Cleemput, O., and Boeckx, P.: Litterfall and leaf litter decomposition in a central African tropical mountain forest and Eucalyptus plantation, Forest Ecol. Manag., 326, 109–116, https://doi.org/10.1016/j.foreco.2014.04.015, 2014.
Classen, A., Peters, M. K., Ferger, S. W., Helbig-Bonitz, M., Schmack, J. M., Maassen, G., Schleuning, M., Kalko, E. K. V., Böhning-Gaese, K., and Steffan-Dewenter, I.: Complementary ecosystem services provided by pest predators and pollinators increase quantity and quality of coffee yields, P. R. Soc. B, 281, 20133148, https://doi.org/10.1098/rspb.2013.3148, 2014.
Classen, A., Peters, M. K., Kindeketa, W. J., Appelhans, T., Eardley, C. D., Gikungu, M. W., Hemp, A., Nauss, T., and Steffan-Dewenter, I.: Temperature versus resource constraints: which factors determine bee diversity on Mount Kilimanjaro, Tanzania?, Global Ecol. Biogeogr., 24, 642–652, https://doi.org/10.1111/geb.12286, 2015.
Coûteaux, M. M., Sarmiento, L., Bottner, P., Acevedo, D., and Thiéry, J. M.: Decomposition of standard plant material along an altitudinal transect (65–3968m) in the tropical Andes, Soil Biol. Biochem., 34, 69–78, https://doi.org/10.1016/S0038-0717(01)00155-9, 2002.
Cuke, M. and Srivastava, D. S.: Divergent effects of tropical forest fragmentation and conversion on leaf litter decomposition, Landscape Ecol., 31, 1037–1050, https://doi.org/10.1007/s10980-015-0316-z, 2016.
Currie, W. S., Harmon, M. E., Burke, I. C., Hart, S. C., Parton, W. J., and Silver, W.: Cross-biome transplants of plant litter show decomposition models extend to a broader climatic range but lose predictability at the decadal time scale, Glob. Change Biol., 16, 1744–1761, https://doi.org/10.1111/j.1365-2486.2009.02086.x, 2009.
Cusack, D. F., Chou, W. W., Yang, W. H., Harmon, M. E., Silver, W. L., and The LIDET Team: Controls on long-term root and leaf litter decomposition in neotropical forests, Glob. Change Biol., 15, 1339–1355, https://doi.org/10.1111/j.1365-2486.2008.01781.x, 2009.
Dawoe, E. K., Isaac, M. E., and Quashie-Sam, J.: Litterfall and litter nutrient dynamics under cocoa ecosystems in lowland humid Ghana, Plant Soil, 330, 55–64, https://doi.org/10.1007/s11104-009-0173-0, 2010.
Detsch, F., Otte, I., Appelhans, T., Hemp, A., and Nauss, T.: Seasonal and long-term vegetation dynamics from 1-km GIMMS-based NDVI time series at Mt. Kilimanjaro, Tanzania, Remote Sens. Environ., 178, 70–83, https://doi.org/10.1016/j.rse.2016.03.007, 2016.
Dillon, M. E., Frazier, M. R., and Dudley, R.: Into thin air: Physiology and evolution of alpine insects, Integr. Comp. Biol., 46, 49–61, https://doi.org/10.1093/icb/icj007, 2006.
Don, A., Schumacher, J., A. Freibauer, A. Freibauer, Freibauer, A., and Freibauer, A.: Impact of tropical land-use change on soil organic carbon stocks - a meta-analysis, Glob. Change Biol., 17, 1658–1670, https://doi.org/10.1111/j.1365-2486.2010.02336.x, 2011.
Downie, C., Humphries, D. W., Wilcockson, W. H., and Wilkinson, P.: Geology of Kilimanjaro, Nature, 178, 828–830, 1956.
Duboc, O., Dignac, M.-F., Djukic, I., Zehetner, F., Gerzabek, M. H., and Rumpel, C.: Lignin decomposition along an Alpine elevation gradient in relation to physicochemical and soil microbial parameters, Glob. Change Biol., 20, 2272–2285, https://doi.org/10.1111/gcb.12497, 2014.
Ensslin, A., Rutten, G., Pommer, U., Zimmermann, R., Hemp, A., and Fischer, M.: Effects of elevation and land use on the biomass of trees, shrubs and herbs at Mount Kilimanjaro, Ecosphere, 6, 45, https://doi.org/10.1890/ES14-00492.1, 2015.
Esquivel, J., Park, B. B., Casanoves, F., Delgado, D., Park, G., and Finegan, B.: Altitude and species identity drive leaf litter decomposition rates of ten species on a 2950 m altitudinal gradient in Neotropical rain forests, Biotropica, 52, 11–21, https://doi.org/10.1111/btp.12730, 2020.
Fanin, N., Bezaud, S., Sarneel, J. M., Cecchini, S., Nicolas, M., and Augusto, L.: Relative importance of climate, soil and plant functional traits during the early decomposition stage of standardized litter, Ecosystems, 23, 1004–1018, https://doi.org/10.1007/s10021-019-00452-z, 2020.
García-Palacios, P., Maestre, F. T., Kattge, J., and Wall, D. H.: Climate and litter quality differently modulate the effects of soil fauna on litter decomposition across biomes, Ecol. Lett., 16, 1045–1053, https://doi.org/10.1111/ele.12137, 2013.
Gerschlauer, F., Saiz, G., Schellenberger Costa, D., Kleyer, M., Dannenmann, M., and Kiese, R.: Stable carbon and nitrogen isotopic composition of leaves, litter, and soils of various ecosystems along an elevational and land-use gradient at Mount Kilimanjaro, Tanzania, Biogeosciences, 16, 409–424, https://doi.org/10.5194/bg-16-409-2019, 2019.
Gholz, H. L., Wedin, D. A., Smitherman, S. M., Harmon, M. E., and Parton, W. J.: Long-term dynamics of pine and hardwood litter in contrasting environments: toward a global model of decomposition, Glob. Change Biol., 6, 751–765, https://doi.org/10.1046/j.1365-2486.2000.00349.x, 2000.
Gill, A. L., Schilling, J., and Hobbie, S. E.: Experimental nitrogen fertilisation globally accelerates, then slows decomposition of leaf litter, Ecol. Lett., 24, 802–811, https://doi.org/10.1111/ele.13700, 2021.
González, G. and Seastedt, T. R.: Soil fauna and plant litter decomposition in tropical and subalpine forests, Ecology, 82, 955–964, https://doi.org/10.1890/0012-9658(2001)082[0955:sfapld]2.0.co;2, 2001.
Guarderas, P., Smith, F., and Dufrene, M.: Land use and land cover change in a tropical mountain landscape of northern Ecuador: Altitudinal patterns and driving forces, PLoS ONE, 17, e0260191, https://doi.org/10.1371/journal.pone.0260191, 2022.
Hemp, A.: Continuum or zonation? Altitudinal gradients in the forest vegetation of Mt. Kilimanjaro, Plant Ecol., 184, 27–42, https://doi.org/10.1007/s11258-005-9049-4, 2006.
Hemp, A.: Climate change and its impact on the forests of Kilimanjaro, Afr. J. Ecol., 47, 3–10, https://doi.org/10.1111/j.1365-2028.2008.01043.x, 2009.
Hunt, H. W., Ingham, E. R., Coleman, D. C., Elliott, E. T., and Reid, C. P. P.: Nitrogen limitation of production and decomposition in prairie, mountain meadow, and pine forest, Ecology, 69, 1009–1016, https://doi.org/10.2307/1941256, 1988.
Idol, T. W., Holzbaur, K. A., Pope, P. E., and Ponder, F.: Control-bag correction for forest floor litterbag contamination, Soil Science Society of America Journal, 66, 620–623, 2002.
Johansson, M.-B., Berg, B., and Meentemeyer, V.: Litter mass-loss rates in late stages of decomposition in a climatic transect of pine forests. Long-term decomposition in a Scots pine forest. IX., Can. J. Botany, 73, 1509–1521, https://doi.org/10.1139/b95-163, 1995.
Kagezi, G. H., Kaib, M., Nyeko, P., Bakuneeta, C., Schädler, M., and Brandl, R.: Decomposition of tissue baits and termite density along a gradient of human land-use intensification in Western Kenya, Afr. J. Ecol., 49, 267–276, https://doi.org/10.1111/j.1365-2028.2011.01263.x, 2011.
Kagezi, G. H., Kaib, M., Nyeko, P., Bakuneeta, C., Schädler, M., Stadler, J., and Brandl, R.: Impacts of land-use intensification on litter decomposition in western Kenya, Web Ecol., 16, 51–58, https://doi.org/10.5194/we-16-51-2016, 2016.
Keuskamp, J. A., Dingemans, B. J. J., Lehtinen, T., Sarneel, J. M., and Hefting, M. M.: Tea Bag Index: a novel approach to collect uniform decomposition data across ecosystems, Methods Ecol. Evol., 4, 1070–1075, https://doi.org/10.1111/2041-210X.12097, 2013.
Kimaro, J. G., Scharsich, V., Kolb, A., Huwe, B., and Bogner, C.: Distribution of traditional irrigation canals and their discharge dynamics at the Southern slopes of Mount Kilimanjaro, Front. Environ. Sci., 7, 24, https://doi.org/10.3389/fenvs.2019.00024, 2019.
Komposch, A., Ensslin, A., Fischer, M., and Hemp, A.: Aboveground deadwood biomass and composition along elevation and land-use gradients at Mount Kilimanjaro, Front. Ecol. Evol., 9, 732092, https://doi.org/10.3389/fevo.2021.732092, 2022.
Lambrechts, C., Woodley, B., Hemp, A., Hemp, C., and Nnyiti, P.: Aerial survey of the threats to Mt. Kilimanjaro forests, United Nations Development Programme (UNDP), Dar Es Salaam, Tanzania, https://www.unep.org/resources/report/aerial-survey-threats-mt-kilimanjaro-forests (last access: 9 February 2024), 2002.
Lasway, J. V., Peters, M. K., Njovu, H. K., Eardley, C., Pauly, A., and Steffan-Dewenter, I.: Agricultural intensification with seasonal fallow land promotes high bee diversity in Afrotropical drylands, J. Appl. Ecol., 59, 3014–3026, https://doi.org/10.1111/1365-2664.14296, 2022.
Lavelle, P., Blanchart, E., Martin, A., Martin, S., and Spain, A.: A hierarchical model for decomposition in terrestrial ecosystems: Application to soils of the humid tropics, Biotropica, 25, 130–150, https://doi.org/10.2307/2389178, 1993.
Linnaeus, C.: Zea mays, in: Species plantarum, Vol. 2, Laurentius Salvius, Stockholm, Sweden, p. 971, https://doi.org/10.5962/bhl.title.669, 1753.
Lomolino, M. V.: Elevation gradients of species-density: historical and prospective views, Global Ecol. Biogeogr., 10, 3-13, https://doi.org/10.1046/j.1466-822x.2001.00229.x, 2001.
Lorenzo, L., Pérez-Harguindeguy, N., Casanoves, F., and De Oliveira, A. A.: Recovering from forest-to-pasture conversion: leaf decomposition in Central Amazonia, Brazil, Journal of Tropical Ecology, 30, 93–96, https://doi.org/10.1017/S0266467413000771, 2014.
Makkonen, M., Berg, M. P., Handa, I. T., Hättenschwiler, S., van Ruijven, J., van Bodegom, P. M., and Aerts, R.: Highly consistent effects of plant litter identity and functional traits on decomposition across a latitudinal gradient, Ecol. Lett., 15, 1033–1041, https://doi.org/10.1111/j.1461-0248.2012.01826.x, 2012.
Marian, F., Sandmann, D., Krashevska, V., Maraun, M., and Scheu, S.: Leaf and root litter decomposition is discontinued at high altitude tropical montane rainforests contributing to carbon sequestration, Ecol. Evol., 7, 6432–6443, https://doi.org/10.1002/ece3.3189, 2017.
Martínez-Falcón, A. P., Moreno, C. E., and Pavón, N. P.: Litter fauna communities and litter decomposition in a selectively logged and an unmanaged pine-oak forest in Mexico, Bosque (Valdivia), 36, 81–93, https://doi.org/10.4067/S0717-92002015000100009, 2015.
Martius, C., Höfer, H., Garcia, M. V., Garcia, M., Römbke, J., and Hanagarth, W.: Litter fall, litter stocks and decomposition rates in rainforest and agroforestry sites in central Amazonia, Nutr. Cycl. Agroecosys., 68, 137–154, https://doi.org/10.1023/b:fres.0000017468.76807.50, 2004.
Mganga, K. Z. and Kuzyakov, Y.: Glucose decomposition and its incorporation into soil microbial biomass depending on land use in Mt. Kilimanjaro ecosystems, Eur. J. Soil Biol., 62, 74–82, https://doi.org/10.1016/j.ejsobi.2014.02.015, 2014.
Mugendi, D. N. and Nair, P. K. R.: Predicting the decomposition patterns of tree biomass in tropical highland microregions of Kenya, Agroforest. Syst., 35, 187–201, https://doi.org/10.1007/BF00122779, 1996.
Negash, M. and Starr, M.: Litter decomposition of six tree species on indigenous agroforestry farms in south-eastern Ethiopia in relation to litterfall carbon inputs and modelled soil respiration, Agroforest. Syst., 95, 755–766, https://doi.org/10.1007/s10457-021-00630-w, 2021.
Nonnotte, P., Guillou, H., Le Gall, B., Benoit, M., Cotten, J., and Scaillet, S.: New K–Ar age determinations of Kilimanjaro volcano in the North Tanzanian diverging rift, East Africa, J. Volcanol. Geoth. Res., 173, 99–112, https://doi.org/10.1016/j.jvolgeores.2007.12.042, 2008.
Olson, J. S.: Energy-storage and balance of producers and decomposers in ecological systems, Ecology, 44, 322–331, https://doi.org/10.2307/1932179, 1963.
Ostertag, R., Restrepo, C., Dalling, J. W., Martin, P. H., Abiem, I., Aiba, S., Alvarez-Dávila, E., Aragón, R., Ataroff, M., Chapman, H., Cueva-Agila, A. Y., Fadrique, B., Fernández, R. D., González, G., Gotsch, S. G., Häger, A., Homeier, J., Iñiguez-Armijos, C., Llambí, L. D., Moore, G. W., Næsborg, R. R., Poma López, L. N., Pompeu, P. V., Powell, J. R., Ramírez Correa, J. A., Scharnagl, K., Tobón, C., and Williams, C. B.: Litter decomposition rates across tropical montane and lowland forests are controlled foremost by climate, Biotropica, 54, 309–326, https://doi.org/10.1111/btp.13044, 2022.
Pabst, H., Kühnel, A., and Kuzyakov, Y.: Effect of land-use and elevation on microbial biomass and water extractable carbon in soils of Mt. Kilimanjaro ecosystems, Appl. Soil Ecol., 67, 10–19, https://doi.org/10.1016/j.apsoil.2013.02.006, 2013.
Pabst, H., Gerschlauer, F., Kiese, R., and Kuzyakov, Y.: Land use and precipitation affect organic and microbial carbon stocks and the specific metabolic quotient in soils of eleven ecosystems of Mt. Kilimanjaro, Tanzania, Land Degrad. Dev., 27, 592–602, https://doi.org/10.1002/ldr.2406, 2016.
Paudel, E., Dossa, G. G. O., de Blécourt, M., Beckschäfer, P., Xu, J., and Harrison, R. D.: Quantifying the factors affecting leaf litter decomposition across a tropical forest disturbance gradient, Ecosphere, 6, 267, https://doi.org/10.1890/es15-00112.1, 2015a.
Paudel, E., Dossa, G. G. O., Xu, J., and Harrison, R. D.: Litterfall and nutrient return along a disturbance gradient in a tropical montane forest, Forest Ecol. Manag., 353, 97–106, https://doi.org/10.1016/j.foreco.2015.05.028, 2015b.
Peña-Peña, K. and Irmler, U.: Moisture seasonality, soil fauna, litter quality and land use as drivers of decomposition in Cerrado soils in SE-Mato Grosso, Brazil, Appl. Soil Ecol., 107, 124–133, https://doi.org/10.1016/j.apsoil.2016.05.007, 2016.
Peters, M. K., Hemp, A., Appelhans, T., Becker, J. N., Behler, C., Classen, A., Detsch, F., Ensslin, A., Ferger, S. W., Frederiksen, S. B., Gebert, F., Gerschlauer, F., Gütlein, A., Helbig-Bonitz, M., Hemp, C., Kindeketa, W. J., Kühnel, A., Mayr, A. V., Mwangomo, E., Ngereza, C., Njovu, H. K., Otte, I., Pabst, H., Renner, M., Röder, J., Rutten, G., Schellenberger Costa, D., Sierra-Cornejo, N., Vollstädt, M. G. R., Dulle, H. I., Eardley, C. D., Howell, K. M., Keller, A., Peters, R. S., Ssymank, A., Kakengi, V., Zhang, J., Bogner, C., Böhning-Gaese, K., Brandl, R., Hertel, D., Huwe, B., Kiese, R., Kleyer, M., Kuzyakov, Y., Nauss, T., Schleuning, M., Tschapka, M., Fischer, M., and Steffan-Dewenter, I.: Climate–land-use interactions shape tropical mountain biodiversity and ecosystem functions, Nature, 568, 88–92, https://doi.org/10.1038/s41586-019-1048-z, 2019.
Potthoff, M. and Loftfield, N.: How to quantify contamination of organic litter bag material with soil?, Pedobiologia, 42, 147–153, 1998.
Powers, J. S., Montgomery, R. A., Adair, E. C., Brearley, F. Q., DeWalt, S. J., Castanho, C. T., Chave, J., Deinert, E., Ganzhorn, J. U., Gilbert, M. E., González-Iturbe, J. A., Bunyavejchewin, S., Grau, H. R., Harms, K. E., Hiremath, A., Iriarte-Vivar, S., Manzane, E., de Oliveira, A. A., Poorter, L., Ramanamanjato, J.-B., Salk, C., Varela, A., Weiblen, G. D., and Lerdau, M. T.: Decomposition in tropical forests: a pan-tropical study of the effects of litter type, litter placement and mesofaunal exclusion across a precipitation gradient, J. Ecol., 97, 801–811, https://doi.org/10.1111/j.1365-2745.2009.01515.x, 2009.
Röder, J. and Brandl, R.: Raw litter decomposition data from five elevational transects on the southern slopes of Mount Kilimanjaro, Tanzania, PANGAEA [data set], https://doi.org/10.1594/PANGAEA.964727, 2024.
Röder, J., Detsch, F., Otte, I., Appelhans, T., Nauss, T., Peters, M. K., and Brandl, R.: Heterogeneous patterns of abundance of epigeic arthropod taxa along a major elevation gradient, Biotropica, 49, 217–228, https://doi.org/10.1111/btp.12403, 2017.
Røhr, P. C. and Killingtveit, Å.: Rainfall distribution on the slopes of Mt Kilimanjaro, Hydrol. Sci. J., 48, 65–77, https://doi.org/10.1623/hysj.48.1.65.43483, 2003.
Rutten, G., Ensslin, A., Hemp, A., and Fischer, M.: Vertical and horizontal vegetation structure across natural and modified habitat types at Mount Kilimanjaro, PLoS ONE, 10, e0138822, https://doi.org/10.1371/journal.pone.0138822, 2015.
Salinas, N., Malhi, Y., Meir, P., Silman, M., Roman Cuesta, R., Huaman, J., Salinas, D., Huaman, V., Gibaja, A., Mamani, M., and Farfan, F.: The sensitivity of tropical leaf litter decomposition to temperature: results from a large-scale leaf translocation experiment along an elevation gradient in Peruvian forests, New Phytol., 189, 967–977, https://doi.org/10.1111/j.1469-8137.2010.03521.x, 2011.
Soini, E.: Land use change patterns and livelihood dynamics on the slopes of Mt. Kilimanjaro, Tanzania, Agr. Syst., 85, 306–323, https://doi.org/10.1016/j.agsy.2005.06.013, 2005.
Thom, D., Sommerfeld, A., Sebald, J., Hagge, J., Müller, J., and Seidl, R.: Effects of disturbance patterns and deadwood on the microclimate in European beech forests, Agr. Forest Meteorol., 291, 108066, https://doi.org/10.1016/j.agrformet.2020.108066, 2020.
van der Plas, G. W., Rucina, S. M., Hemp, A., Marchant, R. A., Hooghiemstra, H., Schüler, L., and Verschuren, D.: Climate-human-landscape interaction in the eastern foothills of Mt. Kilimanjaro (equatorial East Africa) during the last two millennia, Holocene, 31, 556–569, https://doi.org/10.1177/0959683620981694, 2021.
Vasconcelos, H. L. and Laurance, W. F.: Influence of habitat, litter type, and soil invertebrates on leaf-litter decomposition in a fragmented Amazonian landscape, Oecologia, 144, 456–462, https://doi.org/10.1007/s00442-005-0117-1, 2005.
Wall, D. H., Bradford, M. A., St. John, M. G., Trofymow, J. A., Behan-Pelletier, V., Bignell, D. E., Dangerfield, J. M., Parton, W. J., Rusek, J., Voigt, W., Wolters, V., Gardel, H. Z., Ayuke, F. O., Bashford, R., Beljakova, O. I., Bohlen, P. J., Brauman, A., Flemming, S., Henschel, J. R., Johnson, D. L., Jones, T. H., Kovarova, M., Kranabetter, J. M., Kutny, L., Lin, K.-C., Maryati, M., Masse, D., Pokarzhevskii, A., Rahman, H., Sabar, M. G., Salamon, J.-A., Swift, M. J., Varela, A., Vasconcelos, H. L., White, D., and Zou, X.: Global decomposition experiment shows soil animal impacts on decomposition are climate-dependent, Glob. Change Biol., 14, 2661–2677, https://doi.org/10.1111/j.1365-2486.2008.01672.x, 2008.
Wood, S. N.: Thin plate regression splines, J. R. Stat. Soc. B, 65, 95–114, https://doi.org/10.1111/1467-9868.00374, 2003.
Wood, S. N.: Low-rank scale-invariant tensor product smooths for generalized additive mixed models, Biometrics, 62, 1025–1036, https://doi.org/10.1111/j.1541-0420.2006.00574.x, 2006.
Wood, S. N.: Fast stable restricted maximum likelihood and marginal likelihood estimation of semiparametric generalized linear models, J. R. Stat. Soc. B, 73, 3–36, https://doi.org/10.1111/j.1467-9868.2010.00749.x, 2011.
Wood, S. N.: Generalized additive models: an introduction with R, 2nd edn., CRC Press/Taylor & Francis Group, Boca Raton, 476 pp., ISBN 978-1-4987-2833-1, 2017.
Zech, M.: Evidence for Late Pleistocene climate changes from buried soils on the southern slopes of Mt. Kilimanjaro, Tanzania, Palaeogeogr. Palaeocl., 242, 303–312, https://doi.org/10.1016/j.palaeo.2006.06.008, 2006.
Zech, M., Leiber, K., Zech, W., Poetsch, T., and Hemp, A.: Late Quaternary soil genesis and vegetation history on the northern slopes of Mt. Kilimanjaro, East Africa, Quatern. Int., 243, 327–336, https://doi.org/10.1016/j.quaint.2011.05.020, 2011.
Zech, M., Hörold, C., Leiber-Sauheitl, K., Kühnel, A., Hemp, A., and Zech, W.: Buried black soils on the slopes of Mt. Kilimanjaro as a regional carbon storage hotspot, Catena, 112, 125–130, https://doi.org/10.1016/j.catena.2013.05.015, 2014.
Zhang, D., Hui, D., Luo, Y., and Zhou, G.: Rates of litter decomposition in terrestrial ecosystems: global patterns and controlling factors, J. Plant Ecol., 1, 85–93, https://doi.org/10.1093/jpe/rtn002, 2008.