the Creative Commons Attribution 4.0 License.
the Creative Commons Attribution 4.0 License.
Shifts in northern Arizona plant and insect pollinator communities between 2 years with substantially different precipitation totals
Paige R. Chesshire
Liza M. Holeski
The structure of plant–pollinator mutualistic interactions is important for pollination network stability and robustness in the face of environmental change. Even slight changes in seasonal or annual precipitation patterns can disrupt the critical plant–pollinator mutualisms that comprise healthy pollination systems, primarily through changes in the availability of floral resources. Increased instances of drought across regions, especially in the southwestern United States, are a likely threat to plant and pollinator species richness, phenology, and mutualistic associations. In this paper, we evaluated temporal changes in plant–pollinator communities of the San Francisco Peaks in northern Arizona between 2 years with substantially different cumulative precipitation totals. Specifically, we evaluated how plant and pollinator species abundance, richness, mutualistic interactions, and degree of pollinator generalization differed between 2 years, which we refer to as the “wet year” (2017) and “dry year” (2018), and how these shifts may be further impacted at three different life zones (elevation zones). We determined that plant species richness decreased in the dry year across all life zones, and at the highest life zone, Spruce Fir, overall pollinator species generalization increased in the dry year, with a larger number of species considered to be “core generalists”. Additionally, the timing of plant and pollinator activity periods was less consistent in the dry year; there was delayed blooming for many floral resources until after monsoon rains began, and insect activity tended to start and continue later in the season for all life zones. A greater number of pollinator species considered to be core generalists in the dry year at this highest life zone despite fewer floral resources until later in the season may suggest some degree of plasticity when it comes to partner choice, which may be buffering this pollination system from community collapse when resources are scarce. With changing climate, including unpredictable precipitation worldwide, studies to uncover which pollinator species and plant–pollinator associations are most critical for community stability in drier conditions are important for informing conservation decisions on local scales.
- Article
(4028 KB) - Full-text XML
-
Supplement
(270 KB) - BibTeX
- EndNote
Insect pollination networks are structured webs of overlapping links (mutualistic interactions) between plant and pollinator species (Johnson and Steiner, 2000; Waser et al., 1996) that are critical for overall ecosystem functioning. The underlying assembly of these plant–pollinator interactions can influence the system's overall robustness to global change (Doré et al., 2021; Thébault and Fontaine, 2010). Variation in the biotic associations across and within pollination networks is largely driven by spatiotemporal differences in species richness and/or abundance (Lance et al., 2017). Even on small scales, existing plant–pollinator interactions can fluctuate temporally (between years, seasons, or months) or spatially (e.g., across elevations) due to the presence or absence of preferred interaction partners (Alarcón et al., 2008; Schwarz et al., 2020; Cuartas-Hernández and Medel, 2015), where partner availability is often based on the phenology and life history traits of the plant or insect species distributed in that area (Hegland et al., 2009; Adedoja et al., 2020; Lázaro et al., 2008). For example, while lower temperatures and increased canopy cover at high-elevation communities can result in lower bee species richness (Osorio-Canadas et al., 2021; McCabe et al., 2019), fly pollinators tend to dominate at higher elevations (McCabe et al., 2019; Kearns, 1992) or in cooler and wetter environments in general (Adedoja et al., 2020; Devoto et al., 2009; Doré et al., 2021). However, the extent to which these interactions fluctuate in plant–pollinator communities on local scales and how species-level responses may be exacerbated by increasing global change is still unknown.
Besides natural spatiotemporal shifts in abiotic conditions, human-driven climate change (including increases in global temperatures or drought frequency) can also directly impact plant–pollinator interactions (Adedoja et al., 2018). Warming temperatures or shifts in snowmelt date may cause phenological mismatches between plant and pollinator activity periods (Forrest, 2015; Kudo and Ida, 2013; Memmott et al., 2007; Donoso et al., 2016), which can negatively impact the survival and/or reproduction rates of insect partners, especially bees (Memmott et al., 2007; Schenk et al., 2018). Earlier snowmelt could increase frosts that damage the buds of plant partners, and declines in snowpack could affect the overwintering ability of some solitary bee species (Forrest, 2015; Inouye, 2008; Pauli et al., 2013). Additionally, an anticipated increase in drought frequency (Hung et al., 2021; Dai, 2013; IPCC, 2022), where drought is defined as a “period of abnormal precipitation deficit” (Dai, 2013; Phillips et al., 2018), may also impact plant–pollinator communities in certain regions. While drought conditions may be natural features for some arid and semi-arid ecosystems worldwide (Hung et al., 2021), other ecosystems (e.g., temperate) that are not normally subject to drought are being unnaturally exposed to these detrimental conditions, potentially leading these areas to be more severely impacted by environmental change (Phillips et al., 2018; Chen et al., 2013). Even slight changes in seasonal and/or annual precipitation patterns can disrupt the critical plant–pollinator mutualisms that comprise healthy pollination systems (Lance et al., 2017), primarily through changes in the availability of floral resources (Hung et al., 2021; Waser and Price, 2016; Burkle and Runyon, 2016; Schweiger et al., 2010). For example, some annual plants remain dormant over entire seasons when experiencing decreased precipitation, while others produce fewer flowers per plant or shift their blooming phenologies (Phillips et al., 2018; Waser and Price, 2016; Burkle et al., 2013; Adedoja et al., 2020). Since insect pollinators help maintain wild plant biodiversity across ecosystems and are critical for food crop production worldwide (Klein et al., 2007; Potts et al., 2010), understanding how plant–pollinator mutualisms on local scales may respond to periods of decreased precipitation is urgent.
Studies conducted along environmental gradients, either natural or anthropogenic, can be used as model systems to analyze impacts of climate change on pollination communities (Hoiss et al., 2015). For example, elevational gradients offer multiple habitat and temperature zones in a small area and can act as an indirect space-for-time substitution (Fukami and Wardle, 2005; Adedoja et al., 2018; Spehn and Körner, 2005) when predicting the effects of environmental change. We use three distinct life zones (vegetation zones) along the elevational gradient of the San Francisco Peaks in northern Arizona to evaluate temporal differences in plant and pollinator abundance, species richness, and the timing of blooming and foraging periods between 2 years (2017 and 2018). The second year of the study had substantially lower cumulative precipitation (2018, hereafter referred to as the dry year). Specifically, northern Arizona experienced uniquely dry conditions in 2018, with the cumulative winter precipitation (1 December–1 March) being just one-fourth of that produced in the previous winter season, as well as an exceptionally dry spring and a slower start to the summer monsoon rains. The extent to which even slight year-to-year differences in precipitation along elevational gradients may alter pollination systems has only been touched upon (Lance et al., 2017) and is still completely unknown for the San Francisco Peaks. We hypothesize that the drastic changes in precipitation across our 2 study years likely contributed substantially to our observed patterns.
Pollinator species may also respond to shifts in partner availability across environmental gradients (e.g., latitude, elevation) or across temporal scales (e.g., between years) by becoming more or less generalized in their interactions (Alarcón et al., 2008; Adedoja et al., 2018). Breakdowns in plant–pollinator associations and/or fluctuations in species diet breadth or partner choice may occur with changes in precipitation since the degree of pollinator generalization often depends on available plant partners or overall resource abundance. At some high-elevation communities, lower plant diversity due to harsh growing conditions may cause pollinators to discriminate less between floral resources and ultimately have a wider diet breadth (greater generalization) (Hoiss et al., 2015). Conversely, the warmer conditions at lower elevations may promote mass flowering and longer blooming periods of plants, ultimately leading to a more diverse pollinator community (Adedoja et al., 2020, 2018) that can specialize on resources. When plant resource availability is stable and interspecies competition is more prevalent than intra-species competition, pollinators may have a narrower diet breadth where each species can more efficiently use a single resource (Ponisio et al., 2019; Endres et al., 2021). On the other hand, when plant resources are unstable, it can be advantageous for pollinators to discriminate less and increase generalization (Ponisio et al., 2019; Gómez and Zamora, 2006). Ultimately, it is critical to understand how drier conditions may impact pollinator interactions and the degree of generalization on local scales. The degree to which pollinator species generalization on the San Francisco Peaks may change between 2 years with differing levels of cumulative precipitation, and how this varies at different elevation zones, is also unexplored.
Our study location uniquely incorporated a natural spatial gradient (elevational) as well as a precipitation gradient (temporal; wet year vs. dry year). There is great benefit to having both angles in the same study system, as the use of data from an especially dry year (2018) allowed us to not only evaluate year-to-year changes in plant–pollinator communities on the San Francisco Peaks in general but also see how these relationships may be more impacted at certain elevation zones (life zones). Ultimately, we aimed to identify year-to-year variation in plant and pollinator abundance, species richness, activity periods, and pollinator species generalization between a wetter year (2017) and drier year (2018). We had four primary questions. (1) How did average plant and pollinator abundance and species richness change across years at each life zone? (2) How did the seasonal progression of plant and pollinator activity periods vary between the wet and dry years at each life zone? (3) Were there taxon-level differences in pollinator activity, specifically between bees, flies, and butterflies/moths, between the wet and the dry years at each life zone? (4) Did overall pollinator species generalization vary across years and were there differences at each life zone? We addressed how insect pollination communities may change across years along a natural environmental gradient in an especially diverse mountain system (McCabe et al., 2020; Merriam and Stejneger, 1890) and consider changes in yearly precipitation as a potential driver of changes.
To address our study questions, we sampled insect pollinators and recorded plant–pollinator interactions at three distinct life zones on the San Francisco Peaks. We first quantified year-to-year differences in abundance and species richness of both plants and pollinators at each life zone. We then quantified changes in plant and pollinator activity periods by comparing how abundance and species richness tracked with the day of year (Julian date) across years. Julian dates, which are single integers corresponding to a calendar date within a year, range from 1 (1 January) to 366 (31 December). Finally, we used a metric to quantify species-level pollinator generalization and determined how this changed across years. Our analyses also identified whether any changes were more pronounced at certain life zones.
2.1 Study location and sampling methods
The pollination communities along the San Francisco Peaks (35.341031° N, 111.683217° W), roughly 32 km north of Flagstaff, Arizona, provided a unique study area to evaluate impacts on plant–pollinator interactions with changing environmental conditions. Not only is the southwestern United States a known hotspot for bee species richness (McCabe et al., 2020; Orr et al., 2021) but elevational gradients in general also allow for sampling across a diverse range of habitats and temperature zones in a short geographic distance (Smith et al., 2015) and allow for the inclusion of high-elevation fly and bumble bee pollinator species. The San Francisco Peaks are considered one of the United States' “sky islands” (isolated mountain tops) and are characterized by the C. Hart Merriam elevational gradient that spans seven life zones (vegetation zones) (Merriam and Stejneger, 1890; Bowers and McLaughlin, 1996). These life zones range from low-elevation desert ecosystems to alpine forest environments and cover an elevational range of roughly 785 to 3850 m (Chesshire et al., 2021; Merriam and Stejneger, 1890). In July and August 2017 and 2018 (as well as the first 2 d of September in 2017 due to fieldwork timing), we sampled insect pollinators (bees, flies, and butterflies/moths) at three life zones: Ponderosa Pine (∼ 2200–2500 m), Mixed Conifer (∼ 2550–2700 m), and Spruce Fir (∼ 2750–3100 m). We had six distinct sites at each life zone, each of which was further divided into three 60 m × 2 m transects. Along each transect, we used Ryobi hand vacuums (Lance et al., 2017) and sweep nets to collect any insect pollinators touching the reproductive parts of flowering plant species and recorded the host plant interaction. Each transect was sampled for 30 min by a single person, and the number of plants, flowers, and buds was recorded for each plant species. Data were pooled across all three transects each time a site was sampled. We had a total of four sampling periods in the wet year (2017) and five sampling periods in the dry year (2018). This extra sampling period in the dry year was opportunistically conducted in mid-July 2018, in an effort to start sampling the plots as soon as possible after a forest closure was lifted. However, to maintain an equal number of sampling periods across years, we have dropped the extra sampling period from the 2018 data when conducting the analyses below. Additional analysis including the extra sampling period from 2018 showed slight differences and can be found in Appendix A. Each sampling period comprised a series of 3 consecutive days, with each day dedicated to sampling all six sites at one life zone during peak foraging time (09:00–15:00) (Chesshire et al., 2021). Sampling occurred on fair-weather days (no rain, sunny to partly cloudy conditions). If severe thunderstorms did not allow complete sampling on any given day, we returned to the sites on the fourth or fifth consecutive day to finish collections. We randomized the order of sites visited during each sampling period to capture pollinators with different foraging times. The dates of each sampling period are noted in file 1 in the Supplement. All pollinators were taken to the Northern Arizona University (NAU) pollinator lab for curation and identification. For the purposes of our study, we considered all flower-visiting insects captured on plants to be pollinators, although we did not do further pollen analysis on each specimen.
2.2 Species identification
Our methods for specimen curation and species identification are outlined in detail in the methods of Chesshire et al. (2021). Briefly, we identified insects at the NAU pollinator lab using published identification guides, field guides, and textbooks (Marshall, 2012; Norrbom et al., 2010; Skevington et al., 2019; Brock and Kaufman, 2006; Ascher and Pickering, 2024; Michener et al., 1994) as well as expert opinion on certain genera from bee taxonomists, including Karen Wright, Texas A&M University (Melissodes); Jason Gibbs, University of Manitoba (Lasioglossum); Harold Ikerd, USDA-ARS (Andrenidae); and Terry Griswold, USDA-ARS. Many fly individuals were identified to tribe, genus, or species by John Carr, MIT, through examination of photographs taken at NAU's macro-imaging system. Additional photographs of bees, flies, butterflies, and moths were also uploaded to the BugGuide.org “ID Request” page for identification. Insect specimens that could not be confidently identified to species were assigned a morphospecies designation, where individuals with similar morphological characteristics were grouped (McCabe et al., 2020). Each morphospecies was classified by the genus, subgenus if determined, and a unique three-digit number. All pollinator morphospecies were included in the abundance and species richness counts for each analysis. Plants were identified to genus or species in the field and confirmed at the herbarium of NAU through examination of field samples. Images of most plant species were posted to iNaturalist.org, many of which received research-grade identifications that confirmed species determination.
2.3 Climate data
Daily precipitation data were obtained from the Global Historical Climatology Network (GHCN) database through the NOAA National Climatic Data Center (Menne et al., 2012a, b), with precipitation values recorded at the Flagstaff Pulliam Airport weather station. We began calculating cumulative precipitation for 2017 on 1 December 2016, and summed the daily precipitation until 2 September 2017, which was the last day of our sampling season. The same process was repeated for cumulative precipitation totals for 2018, ranging from 1 December 2017 until 2 September 2018. We also compared the precipitation patterns of our 2 study years to the average precipitation patterns seen in the 3 years prior (2014–2016). Specifically, we calculated yearly cumulative precipitation for the years 2014, 2015, and 2016 individually, again starting on 1 December of the previous winter through 2 September for each calendar year, and then averaged the cumulative precipitation values for each calendar day across those 3 years. Since 2016 was a leap year that included a 29th day in February, we used the precipitation values from 28 February for each of the other 4 years as placeholders for the non-existent 29 February.
2.4 Plant and pollinator abundance and species richness across years (question 1)
To evaluate temporal changes in plant and pollinator abundance and species richness between years with differing levels of cumulative precipitation, we analyzed year-to-year differences in the average abundance of plants and pollinators, as well as the average species richness of plant and pollinators, between the wetter year (2017) and drier year (2018) at each life zone. Plant abundance was defined as the number of total flowers observed along all three transects at each site, hereafter referred to as “flower abundance”. First, we constructed generalized linear mixed models (GLMMs) with the lme4 package v1.1-35.1 (Bates et al., 2015) in R Statistical Language v4.3.2 (R Core Team, 2023), with abundance of either plants or pollinators specified as the response variable and the life zone, year, and interaction effect between life zone and year set as the predictor variables (fixed factors). The site and sampling period were set as random-effect terms, with the sampling period nested within the site, as each site was sampled several times across different sampling periods. These analyses were repeated with species richness of either plants or pollinators specified as the response variable. According to the Shapiro–Wilk test for normality, all abundance and species richness data for both insect pollinators and plants at Mixed Conifer and Spruce Fir were non-normally distributed (p > 0.05) but not over-dispersed, so we selected a Poisson family distribution for these GLMMs (Bolker, 2019). Similarly, for plant species richness and abundance data at Ponderosa Pine, data were non-normally distributed (p > 0.05) but not over-dispersed, so we also selected a Poisson family distribution for these GLMMs. However, for insect abundance and species richness at the Ponderosa Pine life zone specifically, a high number of zeros in the data affected models using a Poisson family, so we selected a negative binomial family for both insect-related models at Ponderosa Pine. For these last two models, we used the R package glmmTMB v1.1.9 (Brooks et al., 2023) to incorporate the negative binomial family. For each analysis, we used the Anova() function in the R package car v3.1.2 (Fox et al., 2012) to test for the overall significance of fixed effects (p value < 0.05). The Anova() function allows users to select which method (Type I, II, or III) is used to calculate the sum of squares (SS), with the default selection set to Type II, where all main factors are tested considering every other main effect in the model but not considering interactions (Mangiafico, 2015). For each model, we determined whether there were significant interaction effects between variables by first using this default option, and if the interaction effect was significant, we re-ran the function with the type argument set to the Type III sum of squares, where every term in the model is tested in light of every other term in the model (Mangiafico, 2015). Type III is the best choice for sum of squares if there are significant interaction effects between any of the interaction terms (Mangiafico, 2015). Finally, we used the pairs() function in the R package emmeans v1.8.9 (Lenth et al., 2018) to perform Tukey's post hoc pairwise comparisons for the least-square means of each life zone and year combination. Analyses were restricted to only include plant species with a documented pollinator partner, meaning that at least one pollinator was physically present on the flower of that plant species for at least one life zone. All pollinator data were used in analyses. We used the least-square means from the emmeans() function to visualize the data as bar graphs.
2.5 Temporal changes in plant and pollinator activity across years (question 2)
To compare the seasonal progression of plant and pollinator activity periods between the wet and dry years at each life zone, we created GLMMs to track average plant and pollinator abundance and species richness estimates with the sampling day (numerical values 1–366 assigned to each calendar date, a.k.a. Julian date) for both the 2017 and 2018 sampling periods. Based on methods outlined by Adedoja et al. (2020), we refer to the Julian date as the day of year (DOY). Julian dates are single integers corresponding to calendar dates within a year, ranging from 1 (1 January) to 366 (31 December), and can be used to compare differences in observed plant and pollinator data on similar days between years. Data were separated by life zone, and GLMMs for each life zone were constructed in the R package lme4 v1.1-35.1 (Bates et al., 2015) to examine any year-to-year variation in the seasonal progression of plant and pollinator abundances or species richness estimates over time. In our models, abundance or species richness data of plants or pollinators (kept at a site level) were specified as the response variable, and DOY, year, and the interaction effect between DOY and year were set as the predictor variables (fixed factors). The site and sampling period were again set as random-effect terms, with the sampling period nested within the site, as each site was sampled several times across different sampling periods. We selected a Poisson distribution for all models due to non-normally distributed data that were not over-dispersed. For all analyses, we used the Anova() function in the R package car v3.1.2 (Fox et al., 2012) to test for overall significance of fixed effects (p value < 0.05), and for each model, we again selected either the Type II or Type III method for calculating the sum of squares depending on whether there were significant interactions between fixed effects. Analyses were again restricted to just include plant species for which we had a documented pollinator partner.
2.6 Phenology of pollinator taxa groups across years (question 3)
To determine any taxon-level differences in pollinator activity periods between the wet and dry years, we pooled pollinator abundance data across all six sites of a life zone (for each sampling period) and grouped the data by insect order. This was to evaluate any year-to-year variation in the total abundances of the three different pollinator taxa groups throughout each season. Specifically, the pollinators were grouped by order into Hymenoptera (bee), Diptera (fly), or Lepidoptera (butterfly/moth), each of which has different foraging techniques or morphological traits that contribute to their roles as pollinators. We repeated this process for pollinator species richness data using raw species richness values. Graphs were created separately for each life zone, where abundance or species richness of pollinators (grouped into three distinct taxa groups) was the dependent variable, and sampling day (DOY) was the independent variable. These graphs helped visualize differences in the seasonal progression (timing) of total abundance and total species richness for each taxon group and how peaks may vary within a taxon group across years and between taxa groups within a single year.
2.7 Pollinator species generalization (question 4)
For each year separately, at each life zone, we assigned all pollinator species a numerical generalization value using the formula Gc = (Lance et al., 2017; Dáttilo et al., 2013), where ki is the mean number of interactions across sampling periods for a given pollinator species, and kmean and Ok are the mean and standard deviation among pollinators, respectively, for k. Species with Gc values > 1 represent core generalist pollinators since they have a larger number of plant species interactions relative to other pollinators in the network (Dáttilo et al., 2013). Data were pooled across all six sites of a given life zone but separated by sampling period to calculate the mean number of interactions per pollinator species for a given combination of year and life zone. Ultimately, this resulted in a distinct set of plant/pollinator species and interactions for each life zone in both 2017 and 2018, where we could then identify any variation in species-level generalization across years at a given life zone (e.g., does the Gc value of Bombus huntii change from 2017 to 2018 at Mixed Conifer?). We calculated the following for each life zone: (1) whether the generalization levels for the subsets of pollinators present during both years generally increased or decreased, (2) the total number of core generalist pollinator species for each year, and (3) the percentage of plant–pollinator interactions made up of those generalist pollinators, and/or the percentage of individuals made up of those generalist pollinators, for each year. As a discussion point, we also determined if any pollinator species were considered core generalists at a given life zone during both the wet year and the dry year to identify those insects that may be critical pollinator partners regardless of the drought conditions.
We collected a total of 1404 individuals comprising 139 pollinator species (37 % bees, 41 % flies, 22 % butterflies) over the course of the 2-year study. This comprised 100 species (626 individuals) during the wet year and 94 species (778 individuals) during the dry year, with 55 species overlapping across years. These numbers exclude 299 pollinator individuals that were collected during the extra sampling week in the dry year. A list of 16 species collected in the extra sampling week of the dry year that were not collected during any other time in the 2-year study is provided in file 2 in the Supplement. For plants, we encountered 45 flowering plant species with pollinator partners over the course of the 2-year study (33 species with interaction partners in 2017, 38 species with partners in 2018, with 67 % overlap). Species information for both plants and pollinators is provided in files 2 and 3 in the Supplement.
3.1 Climate data
By the first day of March, cumulative precipitation for the winter of 2017 had reached 287.02 mm compared to just 103.63 mm by that day in 2018 (Fig. 1a). This was primarily due to an overall lower number of daily precipitation events in the late winter of 2018 compared to 2017. Specifically, there were 16 d in January 2017 with some degree of precipitation, whereas only 4 d in January 2018 had precipitation events (file 4 in the Supplement). Further, in late spring and early summer (1 May–1 July), there were fewer daily precipitation events in the 2018 season, and there was a 44 d period (3 May–15 June) with no rainfall at all (Fig. 1b). Notably, the longest period without rain in May–June 2017 (wet year) was still impressive (31 d). Finally, while the monsoon rains characteristic to the southwestern United States started as expected in mid-July both years, the first rainfall event greater than 25 mm in the dry year did not occur until 14 August (33.27 mm), while in the wet year, the first rainfall event of the monsoon period occurred earlier on 23 July (45.47 mm) (file 4 in the Supplement). This led to cumulative precipitation in the dry year failing to catch up to that of the wet year, even by the start of September.
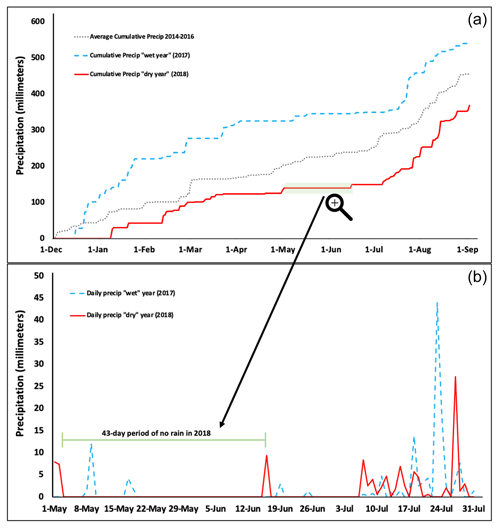
Figure 1Precipitation data for 2017 vs. 2018 in Flagstaff, Arizona. (a) Cumulative precipitation from 1 January through 2 September in 2017 and 2018 compared to the average cumulative precipitation for 2014–2016. (b) Daily precipitation totals across wet vs. dry years in the months of May, June, and July, which include the first portion of the sampling period used in this study and reflects the start of the monsoon rains each year (∼ mid-July).
3.2 Plant and pollinator abundance and species richness across years (question 1)
For flower abundance, there was a significant interaction effect of the year and life zone (Table 1), with flower abundance slightly lower in the dry year overall at Mixed Conifer and Spruce Fir (Fig. 2a). For plant species richness, there were significant effects of year alone (p < 0.001), with slightly lower plant richness overall in the dry year (Fig. 2b). There were no significant differences in flower abundance across paired life zone comparisons, which could be due to high variance across sites sampled within a life zone (Fig. 2). For species richness, however, the number of plant species at Ponderosa Pine in the dry year was significantly lower than that of Ponderosa Pine in the wet year (estimated marginal mean (EMM) – z = −3.497, p = 0.006).
Table 1Results of GLMMs assessing average plant and pollinator abundance and species richness estimates across years. DOF is degrees of freedom. A * symbol shown between two terms represents the interaction of those fixed factors.
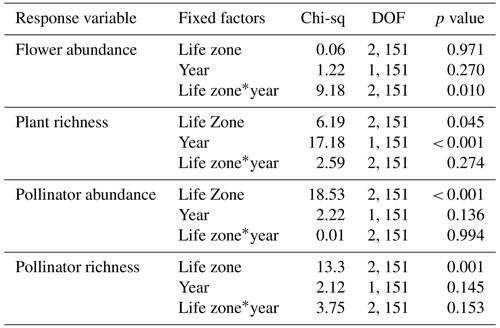
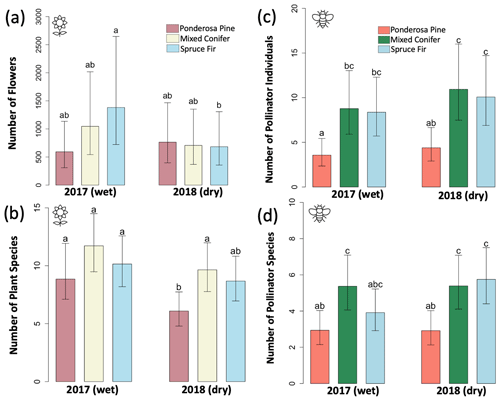
Figure 2Average abundance and average species richness estimates of plants and pollinators across years at each life zone. Values were derived from the least-square means obtained from our models. (a) Average flower abundance, (b) average estimated plant species richness, (c) average pollinator abundance, and (d) average estimated pollinator species richness. Error bars represent 95 % confidence around model predictions. Letters denote significant differences across individual life zone pairs – where life zone pairs that share letters are not significantly different, while pairs that do not share letters are significantly different.
For average pollinator abundance, there was a significant effect of life zone (Table 1; Fig. 2c), with the lowest abundances occurring at Ponderosa Pine, but no significant effects of year or the interaction between life zone and year. Similarly, for pollinator species richness, there were no significant effects of year or the interaction between life zone and year, although there was a significant effect of life zone alone, with the lowest richness estimates occurring at Ponderosa Pine (Table 1; Fig. 2d). There were a few significant differences in average pollinator species richness between life zone pairs across years. For example, insect richness was significantly higher in the dry year at Mixed Conifer (EMM – z = 2.896, p = 0.043) and Spruce Fir (EMM – z = 3.207, p = 0.017) compared to Ponderosa Pine in the wet year. Similarly, insect abundances were significantly higher in the dry year at Mixed Conifer (EMM – z = 3.899, p = 0.001) and Spruce Fir (EMM – z = 3.604, p = 0.004) compared to Ponderosa Pine in the wet year.
3.3 Temporal changes in plant and pollinator abundance and richness across years (question 2)
At Mixed Conifer and Spruce Fir, flower abundance was significantly higher in the wet year than in the dry year (Table 2). Flower abundance peaked earlier in the season at Mixed Conifer during the wet year than it did in the dry year, and at Spruce Fir, while flower abundance showed a similar seasonal progression across years, abundances were generally higher at any given Spruce Fir site in the wet year than they were in the dry year (Fig. 3a). Interestingly, this same trend did not apply at the lowest life zone Ponderosa Pine, where flower abundances were generally higher in the dry year (Fig. 3a). For plant species richness estimates, there was a significant effect of year alone at Ponderosa Pine and Mixed Conifer and a marginally significant effect at Spruce Fir (Table 3), with plant species richness estimates trending higher in the wet year (Fig. 4a). These results support the significant decrease in plant species richness in the dry year produced by our GLMMs used in question 1. Additionally, there was a significant effect of DOY on plant species richness for all life zones (Table 3).
Table 2Summary statistics for the generalized linear mixed models (GLMMs) assessing temporal changes in plant and pollinator abundance across years. A * symbol shown between two terms represents the interaction of those fixed factors.
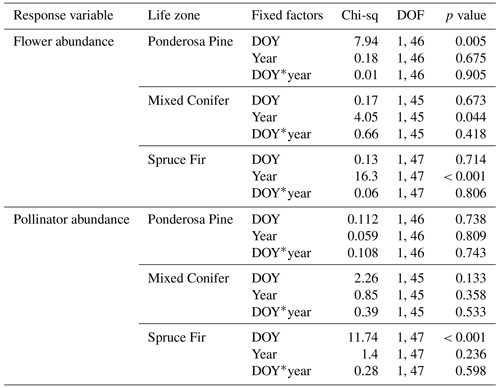
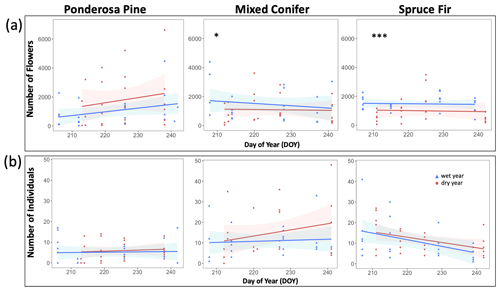
Figure 3Total abundance of flowers (a) and insect pollinators (b) across the day of year (DOY). Results are reported at each life zone. Lines represent the lines of best fit for 2017 data (wet year; in blue) and 2018 data (dry year; in red). Julian dates range from 197 to 245, which encompass 16 July–2 September of a calendar year. Significant effects of the year are denoted with the ∗ symbol, where p < 0.001 is marked with and p < 0.05 is marked with ∗.
Table 3Summary statistics for the generalized linear mixed models (GLMMs) assessing temporal changes in plant and pollinator species richness estimates across years. A * symbol shown between two terms represents the interaction of those fixed factors.
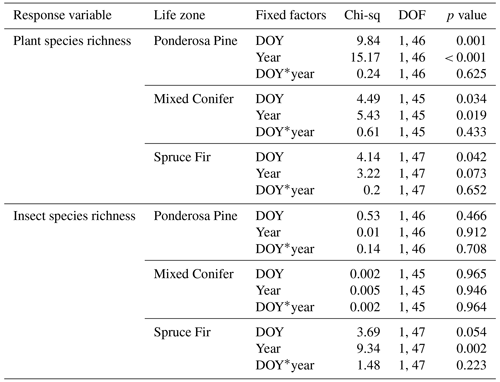
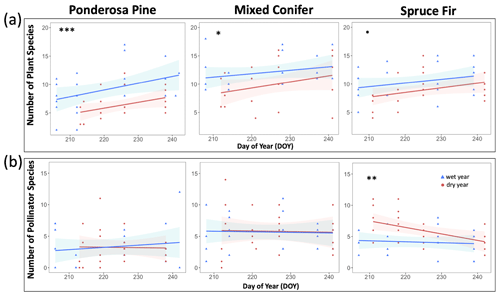
Figure 4Species richness estimates of plants (a) and insect pollinators (b) across the day of year (DOY). Results are reported at each life zone. Lines represent the lines of best fit for 2017 data (wet year; in blue) and 2018 data (dry year; in red). Julian dates range from 197 to 245, which encompass 16 July–2 September of a calendar year. Significant effects of year are denoted with the ∗ symbol, where p < 0.001 is marked with , p < 0.005 is marked with , and p < 0.005 is marked with ∗. Marginally significant results are marked with a • symbol (where p < 0.08).
Pollinator abundance patterns did not significantly differ at particular DOYs across years for Ponderosa Pine or Mixed Conifer, but there was a significant interaction effect of DOY at Spruce Fir (Table 2). However, there was no significant interaction effect of year on flower abundance at any of the life zones. Visually, however, pollinator abundances were generally higher in the dry year throughout the course of the season at both Mixed Conifer and Spruce Fir (Fig. 3b). This did not hold true for Ponderosa Pine, where trends in pollinator abundances were visually similar across years. Pollinator species richness estimates did not differ at particular DOYs across years for Ponderosa Pine or Mixed Conifer, but there was a marginally significant effect of DOY alone and a significant effect of year alone at Spruce Fir (Table 3), with pollinator richness generally being higher in the dry year at this life zone (Fig. 4b).
3.4 Visual patterns of total richness across seasons (question 2 continued)
Additionally, we visualized how the seasonal progression (timing) of plant and pollinator activity varied between years, where abundance and species richness values for a given DOY were used as indicators of activity. We graphed total abundance and raw species richness values for both plants and pollinators to visualize within-year fluctuations in activity (peaks or dips) and how the timing of those fluctuations differed between wet and dry years (Appendix B, Figs. B1–B3).
There were observable differences in the timing of plant and pollinator activity across years, where species richness and abundance values in the wet year (2017) differed from those observed on similar sampling days (DOYs) in the dry year (2018). For example, at Mixed Conifer in the wet year, pollinator species richness was relatively stable until a decline began in late August, and total insect abundance did not drop until the last day of our sampling period (DOY 241). Conversely, in the dry year, total pollinator species richness at Mixed Conifer fluctuated throughout the season, and on the last day of sampling, pollinators were much more speciose than they were on that same day in the wet year (23 species compared to 8 species, respectively). For plants at both Ponderosa Pine and Mixed Conifer, total richness was generally lower in the early weeks of the dry season compared to that of the wet year but then eventually caught up by mid-August, after which the species richness of plants trended higher in the dry year. Similarly, flower abundance peaked later in the dry year at Ponderosa Pine and Mixed Conifer (Fig. B3). At Spruce Fir, total pollinator abundance and richness values were also higher throughout the dry year, especially during the earlier portion of the sampling season. For example, pollinator richness peaked in early August (DOY 218) in the dry year (25 species), but total species richness never reached that number in the wet year. For pollinator abundance at Spruce Fir, on DOY 211, over 100 insect individuals were sampled in the dry year, whereas insect abundances were already on the decline by that day in the previous wet year.
3.5 Phenology of pollinator taxa groups across years (question 3)
The total abundance and species richness of all pollinator taxa groups (bees, flies, and butterflies/moths) mostly increased and decreased in tandem across the course of a season, regardless of life zone or year (Figs. 5 and 6). However, there were a few noticeable exceptions at Spruce Fir (Figs. 5c and 6c).
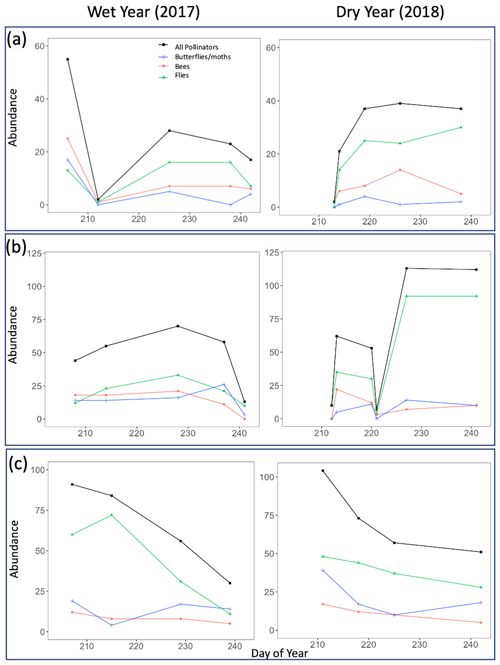
Figure 5Pollinator abundance for all sampled insects combined as well as divided by taxon group for both the wet year (2017) and the dry year (2018). Points on the graph correspond to numbers obtained on true sampling days. Day of year refers to Julian dates, ranging from 206 to 245, which encompass 25 July–2 September of a calendar year. (a) Ponderosa Pine, (b) Mixed Conifer, and (c) Spruce Fir.
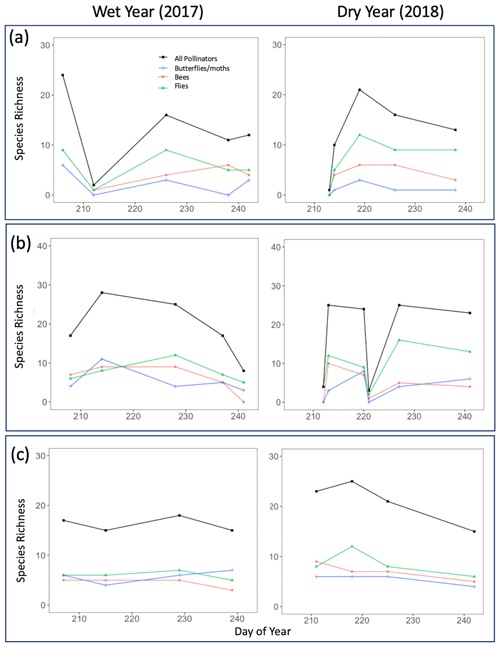
Figure 6Pollinator species richness for all sampled insects combined as well as divided by taxon group for both the wet year (2017) and the dry year (2018). Points on the graph correspond to numbers obtained on true sampling days. Day of year refers to Julian dates, ranging from 206 to 245, which encompass 25 July–2 September of a calendar year. (a) Ponderosa Pine, (b) Mixed Conifer, and (c) Spruce Fir.
Across years, our results indicated that the increased pollinator species richness and abundance in the dry year could be largely driven by flies, especially at Ponderosa Pine and Mixed Conifer. In these life zones, late-season total fly abundance and richness values were consistently higher in the dry year than in the wet year. For example, on the last day of the sampling season in the wet year at Ponderosa Pine, flies made up 16 individuals comprising five species, whereas in the dry year, fly abundance and richness nearly doubled, with 30 individuals comprising nine species. A similar pattern existed at the Mixed Conifer life zone (Figs. 5b and 6b), where flies dominated insect abundance in the latter half of the dry year, with 92 individuals collected on each of the last 2 sampling days. In the previous year at Mixed Conifer, only 21 and 10 fly individuals were collected on the last two sampling dates, respectively.
At the Spruce Fir life zone, while flies drive increased total species richness during part of the dry year (Fig. 6c), bees also showed higher species richness in dry vs. wet years (Fig. 6c). While bee species richness at Spruce Fir never exceeded five species in the wet year, total bee richness was at nine species (17 individuals) at the start of the dry year sampling and was never lower than seven species until the last sampling day of the season.
3.6 Pollinator species generalization (question 4)
For the subset of pollinator species that were present both years, the highest zone at Spruce Fir had the greatest number of pollinator species (52.4 %) to experience increases in their Gc values between the wet year and the dry year (Table 4), compared to the two lower life zones. Also at Spruce Fir, there were more pollinator species considered core generalists (Gc > 1) in the dry year compared to the previous wet year (Table 5a), and the percentage of total interactions made up of core generalist species was also higher in the dry year (Table 5c). Similarly, at both Mixed Conifer and Spruce Fir, the percentage of total insect individuals made up of the core generalist pollinators increased from the wet year to the dry year (Table 5), although this trend did not hold true at the lowest life zone Ponderosa Pine. Interestingly, while at the lower life zone Ponderosa Pine there were no pollinator species overlapping as generalists across both years, there were two pollinator species that overlapped as generalists across years at Mixed Conifer and two pollinator species that overlapped as generalists across years at Spruce Fir (file 5 in the Supplement).
Table 4Overall changes in pollinator Gc values (generalization) for the subset of pollinator species present during both the wet year (2017) and the dry year (2018) at each life zone.

The North American southwest has been in the midst of a megadrought for over 2 decades, with 2000–2021 being classified as the driest 22-year period since the year 800 (Williams et al., 2022). Drought conditions are only expected to worsen in this region in upcoming years (Balling and Goodrich, 2010; Cook et al., 2015), and increased drought severity may lead to shifts in species assemblages and biotic mutualisms across ecosystems (Hung et al., 2021; Barton and Ives, 2014). In pollination systems, it is important to evaluate shifts in plant–pollinator species abundance, diversity, or phenological activity with increasing drought conditions, as well as potential species-level shifts in dietary generalization of pollinators. Understanding which insect pollinators might be most affected by partner loss due to short-term decreases in precipitation, or perhaps even more relevant, which will be most responsible for maintaining plant–pollinator community stability after perturbations, is critical. For conservation purposes, it is important to identify and preserve the pollinator species with a high influence on pollination community structure.
In our study, we found that flower abundance and plant species richness tended to decrease in the dry year, while abundance and species richness estimates of pollinators were stable and/or increased in the dry year (with increases in pollinator species richness mainly seen at the highest life zone at Spruce Fir). These results are consistent with other studies that show how decreased precipitation can negatively impact floral resource availability. For example, a study on plant–pollinator communities in the foothills of the Fort Huachuca mountains that experienced natural drought conditions showed that during a drought year (2009), there was a sizable decrease in plant species richness compared to the previous wet year (Lance et al., 2017). In fact, drought events in general can cause annual plants to remain dormant for entire seasons and/or perennial plants to save resources and produce fewer flowers (Phillips et al., 2018; Hung et al., 2021). For pollinators, while it may at first seem counterintuitive for values to increase or remain stable in the dry year (fewer plant resources could lead to fewer consumers), this is understandable since the populations of insect pollinators, especially bees and flies, usually depend on the resource availability of the previous summer (Endres et al., 2021; Forrest, 2015).
Our results showed that the phenology of total plant and pollinator activity (where changes in total abundance and species richness values were used as indicators of activity) was less consistent in the dry year than in the wet year (Figs. B1–B3). For plant species richness, pollinator abundance, and pollinator species richness, differences in phenology were not significantly different across years, but there was a trend for total pollinator values to be higher in the dry year for a particular DOY and for plant richness to be lower for a particular DOY at all three life zones (Figs. B1–B3). The higher species richness of plants and pollinators on late sampling days in the dry year at Ponderosa Pine and Mixed Conifer suggests that after the San Francisco Peaks finally received heavier rains in mid-to-late July (Fig. 1), plants did bloom, but the timing was delayed compared to the previous summer. The late rains could also correspond to the spike in total insect pollinator abundance at the end of the dry year at these two life zones; with plant partners blooming later, insects may have been able to continue foraging later in the season than in the previous year. Previous studies on phenological asynchrony suggest that mutualistic insects will modify their foraging activity alongside plant partners by responding to similar shifts in abiotic cues, such as alterations in emergence time and life cycle due to weather variation (Burkle et al., 2013; Forrest, 2015; Bartomeus et al., 2011; Kudo, 2014). This phenomenon could be one possibility for why we observed increases in flies species richness and abundance after late rains during the dry year, as Diptera tend to have preferences for wetter conditions (Devoto et al., 2009). It is also possible that the lower bee and butterfly/moth abundance and species richness near the end of the dry season allowed flies to dominate due to reduced interspecific competition. These possibilities are not mutually exclusive.
At Spruce Fir, in addition to increased fly numbers in the dry year relative to the wet year, there was also slightly higher bee abundance and species richness in the first part of the dry season. Specifically, during the first sampling day in the wet year (DOY 207), there were just five bee species (12 individuals) sampled at Spruce Fir. On a similar sampling date in the dry year (DOY 211), there were nine species (17 individuals) sampled, despite the drier conditions. Bee abundance and species richness in this zone then declined during the dry year with the late-season rains. It is possible that at this higher life zone, bees thrived during these unexpectedly dry weeks since arid and warm habitats are conducive to the needs of many bee species (Orr et al., 2021; Michener, 2000). In fact, a recent study conducted in the coastal sage scrub habitats in San Diego County in the years before and after a significant drought event (Hung et al., 2021) found that bee abundance of certain species increased after the drought and that the assemblage was strongly represented by small-bodied and eusocial bees, especially the subgenus Dialictus of the genus Lasioglossum. Smaller-bodied bees may require fewer resources (Hung et al., 2021), and many Dialictus members may be dietary generalists, allowing these bees to survive on any plant resources available during the drought years. Our dataset indicates similar increases in small-bodied, eusocial bees (e.g., Lasioglossum (Dialictus), Hylaeus, and Protandrena) in the dry year (https://doi.org/10.6084/m9.figshare.24944643, Chesshire, 2024).
In most systems, insect pollinator species have some degree of dietary generalization, and many plant–pollinator mutualistic interactions show plasticity (Waser et al., 1996; Endres et al., 2021; Johnson and Steiner, 2000; Rabeling et al., 2019). This can allow for continued feeding for pollinators in the face of decreased plant availability, even if it is at a lower resource intake (Endres et al., 2021), thus avoiding starvation. Our results support the niche theory, which suggests that the number of interaction partners may expand or contract under certain environmental conditions, including droughts (Endres et al., 2021; Fontaine et al., 2008). We showed by multiple metrics that on the San Francisco Peaks, insect pollinators are tending towards higher generalization in the dry year at the highest life zone, Spruce Fir. At Spruce Fir, a greater number of pollinator species were determined to be core generalists, and the percentage of total interactions made up of this subset of core generalists was higher than it was in the previous wet year. This suggests that the most generalized pollinator species were responsible for more network interactions (links) in the dry year. Additionally, at Spruce Fir over 52 % of the pollinator species that foraged both years showed increases in their total plant partners in the dry year (Table 4). Increased pollinator generalization for some species in the dry year, despite fewer floral resources, may suggest some degree of plasticity when it comes to partner choice. Our results showing increases in species generalization in drier conditions support the findings of recent studies on pollinator assemblages across environmental gradients; during years of drought in Crested Butte, Colorado, the biennial plant species scarlet gilia (Ipomopsis aggregata) received increased abundance and species richness of pollinator visitors compared to in non-drought years (Endres et al., 2021). These results are consistent with the theory that pollinator diet breadth (generalization) increases in conditions with decreased floral resources, with insect visitor category richness being 4.08 times higher in drought years than in non-drought years (Endres et al., 2021). Similarly, an analysis by Doré et al. (2021) revealed that across an anthropogenic gradient, pollinator generalization increased with human disturbance, suggesting that some plant–pollinator associations can exhibit plasticity in response to environmental perturbations. Although this study was not directly related to precipitation, it provides an example of pollinator species widening their diet breadth to include more partners in habitats that have higher risks of extinction/threats (Doré et al., 2021). Importantly, for all Gc calculations, we acknowledge the caveat that high individual abundances may positively correlate to higher Gc values simply because the more abundant species are likely to be sampled more frequently (Winfree et al., 2014; Chesshire et al., 2021), which could be a contributing factor to the increased Gc values in the dry year for some species.
Overall, identifying which pollinator species are seemingly critical for local network stability in drought conditions may be most important for conservation purposes. Generalist pollinators might be better equipped to handle environmental perturbations due to their ability to use available plant resources in the face of missing plant partners (Hung et al., 2021), and their persistence can hold together many of the plant–pollinator links within a network (Biella et al., 2019). However, even if those species' populations are stable and abundant now, any threats leading to loss of these important generalists can lead to faster community collapse (Lance et al., 2017; Hegland et al., 2009; Chesshire et al., 2021). For example, the more generalized pollinators currently inhabiting Spruce Fir may face shrinking habitat and range contraction in upcoming years (Osorio-Canadas et al., 2021; Biella et al., 2017), and combined with decreased flower productivity due to increased drought severity, they could face decreases in both food and habitat. Protecting the species most responsible for community robustness may help preserve network function in the face of environmental change and may also inadvertently secure any rare yet functionally important bee species that associate with generalist plants (Bascompte et al., 2003; Simpson et al., 2022). In our study, one critical pollinator species during the dry year was the fly Ptilodexia 002. This species had the starkest example of Gc values increasing between years; although Ptilodexia 002 was present both years at all life zones, it interacted with more plant species in the dry year (increased Gc values) at all life zones. This increase in plant partners led Ptilodexia 002 to be classified as a generalist species at Ponderosa Pine and Spruce Fir in the dry year even though it was not considered a generalist in the previous year. Ultimately, Ptilodexia 002 is a critical species within the San Francisco Peaks pollinator communities. In fact, previous research shows that members of the Ptilodexia genus are known to be important pollinators of angiosperms (Glinos et al., 2019; Wilder, 1976). Adults are nectar feeders that have been observed probing on flowers for long periods, and sampled individuals have had numerous pollen granules attached to their tarsi (Wilder, 1976). Further, a 2016 Argentinian study determined that the threatened medicinal plant species Minthostachys verticillata is absolutely dependent on animal pollination, and over 70 % of its pollinator visits were from Ptilodexia cf. cingulipes individuals (Glinos et al., 2019). This is an important example of how uncovering the species-level trends within the San Francisco Peaks pollination networks can be very informative.
Although our results are specific to the local pollinator communities of northern Arizona, these findings are relevant to other pollination systems worldwide. For example, the San Francisco Peaks are one of the sky islands found in the southwestern United States. These isolated mountain tops support a high diversity of plants and animals in just a few square kilometers due to the multiple habitat types present along the elevational gradient (Bowers and McLaughlin, 1996). Sky islands are not only composed of biodiversity hotspots at each habitat (Bowers and McLaughlin, 1996) but also support species at low-elevation habitats (e.g., desert) that could not possibly exist at the higher zones (e.g., alpine). Because of this, there is often high species turnover across the elevational gradient. It is crucial to understand current turnover in plant–pollinator interactions at these different habitat zones and also anticipate how climate change may accelerate species turnover across the rest of the North American southwest, where additional sky islands exist (Bowers and McLaughlin, 1996) and bees are most diverse (Orr et al., 2021). Furthermore, even when studying short-term pollination network responses to environmental changes in completely different ecosystems globally, the main takeaways remain the same: how will pollinator communities respond to consecutive years of extreme abiotic differences?
While we provide unique and valuable plant–pollinator interaction data because our study encompassed three different elevational zones across years with distinctly different precipitation levels, there are important caveats and limitations to this work. For example, our study covers only a 2-year period in natural communities, so we cannot definitely attribute the temporal changes observed to lower cumulative precipitation. While such “snapshot” studies of local pollination networks are important, multi-year repetition is critical, especially if working to pinpoint which abiotic and/or biotic factors drive different patterns. As mentioned, it is hard to disentangle the extent to which changes in species richness, abundance, and generalization are due to yearly precipitation differences or due to other reasons that may drive pollination network changes across time. Some plant–pollinator interactions may be naturally temporally dependent, where species diversity, link rewiring, and species turnover varies not only year-to-year but also across weeks or months within a season (Schwarz et al., 2020). This can lead to within-year fluctuation and rapid species turnover and/or rapid interaction rewiring of plant–pollinator associations (CaraDonna et al., 2017). There may have also been additional abiotic factors contributing to differences in species richness and abundance in the dry year (2018), including massive forest fires surrounding the San Francisco Peaks and precipitation regimes in the years prior to our study. Additionally, as the North American southwest is in the midst of a 20-year-long-megadrought, even our wet year had a 31 d period of no rain, which highlights that although we view our study in the context of a wet year vs. dry year, this is all relative because the megadrought is creating much more arid conditions in the area than in previous decades (Williams et al., 2022). Finally, the order in which the wet year vs. dry year occurred may be important; if the San Francisco Peaks experienced a wet year after a dry year, it is possible that opposite species richness and abundance trends may have been observed across years. These caveats highlight the need for continued, multi-year studies on local pollination systems across the North American southwest, such as the San Francisco Peaks but also elsewhere.
Ultimately, with a predicted increase in the severity and intensity of droughts across ecosystems worldwide, including those within the southwestern United States (Balling and Goodrich, 2010; Cook et al., 2015; IPCC, 2022), understanding the response of plant–pollinator communities and mutualistic interactions to environmental change is critical. However, regardless of the species-level trends uncovered in local pollination systems, the answer for preserving ecosystems is not always clear cut. Although identifying and protecting the critical generalist species that are most responsible for community stability in disturbed conditions are likely the most important routes to take now, other uncontrollable shifts in ecosystem dynamics may impact pollinator communities. For example, if generalist pollinators start to replace all the specialists entirely (Doré et al., 2021), there may be negative consequences on ecosystem function. Some generalists are unable to handle certain flower types as efficiently as specialists, and there may be increases in hetero-specific pollen transfer (Doré et al., 2021; Endres et al., 2021; Morales and Traveset, 2008). Additionally, as was observed at the Spruce Fir life zone in the dry year, drought conditions could lead to increases in bee abundance at higher elevations due to drier conditions. While this may not be entirely negative since bees are critical for pollination services, increasing drought will still lead to an overall decrease in plant productivity at these high-elevation communities (Osorio-Canadas et al., 2021), and it is not certain that such benefits will outweigh the cost. Regardless, it would be beneficial for future plant–pollinator studies to identify any important species-level associations within the system. Knowledge of local-scale trends in insect pollinators and their food plants can be used to scale up across regions and help prepare conservation strategies in a world increasingly threatened by global change.
A1 Supplemental methods
A1.1 Plant and pollinator abundance and species richness across years with extra sampling week retained
We repeated the analyses for question 1 after retaining data from the extra sampling week in the dry year. Specifically, these analyses evaluated year-to-year differences in the average abundance of plants and pollinators, as well as the average species richness of plant and pollinators, between the wetter year (2017) and drier year (2018) at each life zone. For these supplemental analyses, plant abundance was still defined as the number of total flowers observed along all three transects at each site, and we again constructed generalized linear mixed models (GLMMs) with abundance of either plants or pollinators specified as the response variable and the life zone, year, and interaction effect between life zone and year set as the predictor variables (fixed factors). The site and sampling period were again set as random-effect terms, with the sampling period nested within the site, as each site was sampled several times across different sampling periods. When data from the extra sampling week were included because greater sampling effort may lead to a higher chance of encountering more species (Evans et al., 2017), we did not use raw species richness values in our models. Instead, to account for the additional sampling week in the dry year, we used species richness estimates generated with the package iNEXT v3.0.0 (Hsieh et al., 2016) using R Statistical Language v4.3.2 (R Core Team, 2023). This individual-based rarefaction method computes diversity estimates of order q (where here, q = 0, i.e., species richness) by interpolating or extrapolating assemblages based on a reference sample obtained from observed data (Colwell et al., 2012; Chao et al., 2014). Abundance data were not modified as our models work with means at each life zone across wet and dry years for which the additional sampling week is considered when calculating averages. According to the Shapiro–Wilk test for normality, all abundance and species richness data for insect pollinators were non-normally distributed (p > 0.05) and over-dispersed, so we selected a negative binomial family distribution for these two GLMMs (Bolker, 2019). Abundance data for plants were also non-normally distributed and over-dispersed, so we also selected a negative binomial family distribution for this model. The non-normally distributed plant species richness data were not over-dispersed (dispersion ratio = 0.33), so we selected a Poisson family distribution for this model. In order to better create GLMMs using a negative binomial family, we used the R package glmmTMB v1.1.9 (Brooks et al., 2023) for these supplemental models. For all analyses, we again used the Anova() function in the package car v3.1.2 (Fox et al., 2012) to test for overall significance of fixed effects (p value < 0.05), and for each model, we again selected either the Type II or Type III method for calculating the sum of squares depending on whether there were significant interactions between fixed effects. Analyses were again restricted to just include plant species for which we had a documented pollinator partner. All pollinator data were used in analyses. We used the least square means from the emmeans() function to visualize the data as bar graphs.
A1.2 Temporal changes in plant and pollinator activity across years with extra sampling week retained
We also repeated the analyses for question 2 after retaining data from the extra sampling week in the dry year. Question 2 analyses were conducted to compare the seasonal progression of plant and pollinator activity periods between the wet and dry year at each life zone. We again created GLMMs to track average plant and pollinator abundance and species richness estimates with the sampling day (numerical values 1–366 assigned to each calendar date, a.k.a. Julian date) for both the 2017 and 2018 sampling periods. Data were separated by life zone, and GLMMs for each life zone were constructed in the R package glmmTMB v1.1.9 (Brooks et al., 2023) to examine any year-to-year variation in the seasonal progression of plant and pollinator abundances or species richness estimates over time. To account for the extra sampling week in 2018, we again used the rarefied species richness estimates that were generated using the package iNEXT v3.0.0. Abundance data were unmodified. In our models, abundance or species richness data of plants or pollinators (kept at a site level) were specified as the response variable and DOY, year, and the interaction effect between DOY and year were set as the predictor variables (fixed factors). The site and sampling period were again set as random-effect terms, with the sampling period nested within the site, as each site was sampled several times across different sampling periods. We selected a negative binomial distribution for all models due to non-normally distributed and over-dispersed data. For all analyses, we used the Anova() function in the package car v3.1.2 (Fox et al., 2012) to test for overall significance of fixed effects (p value < 0.05), and for each model, we again selected either the Type II or Type III method for calculating the sum of squares depending on whether there were significant interactions between fixed effects. Analyses were again restricted to just include plant species for which we had a documented pollinator partner.
A2 Supplemental results and discussion
A2.1 Plant and pollinator abundance and species richness across years with extra sampling week retained
Similarities to main analyses. For plant species richness, results were very similar with and without the extra sampling week. In these supplemental GLMMs, when using rarefied richness values to account for the extra sampling week there were significant effects of the year alone (p = 0.017), and the interaction between life zone and year was marginally significant (p = 0.055), with slightly lower plant richness overall in the dry year (Table A1). Additionally, there were no significant differences in flower abundance across paired life zone comparisons, and for species richness, the number of plant species at Ponderosa Pine in the dry year was significantly lower than that of Ponderosa Pine in the wet year (EMM – z = −3.322, p = 0.012).
For pollinator species richness, results were also very similar with and without the extra sampling week. When using rarefied richness values, there were no significant effects of year or of the interaction between life zone and year, although there was a significant effect of life zone alone, with the lowest richness estimates occurring at Ponderosa Pine (Table A1). Further, there were no significant differences in pollinator species richness estimates across years for individual life zone pairs. Also, there were a few significant differences in average pollinator abundances between life zones across years, with insect abundance being significantly higher in the dry year at Mixed Conifer (EMM – z = 4.277, p < 0.001) and Spruce Fir (EMM – z = 3.366, p = 0.010) than at Ponderosa Pine in the wet year.
Differences from main analyses. For flower abundance, however, when data from the extra sampling week was retained, there was a marginally significant effect of year on flower abundance (Table A1), with abundance slightly lower in the dry year overall at all life zones. This differs from our main results when the extra sampling week was excluded; while there was a significant interaction effect of year and life zone, there was no effect of year alone. Additionally, average flower abundance was slightly higher at Ponderosa Pine in the dry year. This discrepancy could be due to very low abundances recorded across all life zones during the extra sampling week in the dry year, which ultimately brought down average abundances in our GLMMs compared to when these data were removed for the main analyses.
For pollinators, when data from the extra sampling week were retained, average abundances were higher overall in the dry year, with a marginally significant effect of year (Table A1). However, there was no significant effect of year in our main analyses when this extra sampling week was excluded. This discrepancy could be because removing the 299 individuals collected in the extra sampling week of the dry year had a more pronounced effect on whether year was significant than anticipated. These differences reiterate our point that removing the extra sampling week from the dataset before conducting analyses was the appropriate choice to accurately compare trends across years.
A2.2 Temporal changes in plant and pollinator abundance and richness across years with extra sampling week retained
Similarities to main analyses. At Mixed Conifer, when retaining data from the extra sampling week, flower abundance peaked later in the dry year than the wet year, and at the Spruce Fir life zone, while flower abundance showed a similar seasonal progression across years, abundances were generally higher at any given Spruce Fir site in the wet year than they were in the dry year. For plant species richness, when using rarefied richness estimates, there was a significant effect of year alone at Ponderosa Pine and a marginally significant effect at Mixed Conifer and Spruce Fir (Table A3), with plant species richness estimates trending higher in the wet year. Very similar trends were seen in the main text analyses.
For pollinator abundance, patterns did not significantly differ at particular DOYs across years for Ponderosa Pine or Mixed Conifer, but there was a significant interaction effect of DOY at Spruce Fir (Table A2). For pollinator species richness estimates, there were no differences for particular DOYs across years for Ponderosa Pine, but there was a significant effect of DOY alone at Mixed Conifer (Table A3) and a marginally significant effect of year alone at Spruce Fir, with pollinator richness generally being higher in the dry year. These same trends were seen in our main text analyses when the extra sampling week was removed.
Table A1Results of GLMMs assessing average plant and pollinator abundance and species richness estimates across years when data from the extra sampling week in 2018 were retained. A * symbol shown between two terms represents the interaction of those fixed factors.
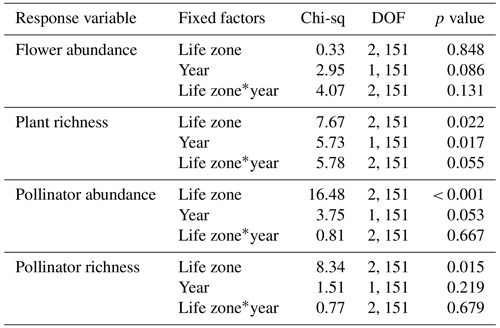
Table A2Summary statistics for the generalized linear mixed models (GLMMs) assessing temporal changes in plant and pollinator abundance across years when data from the extra sampling week in 2018 were retained. A * symbol shown between two terms represents the interaction of those fixed factors.
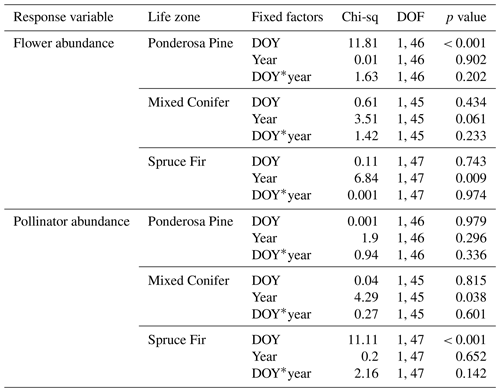
Differences from main analyses. For flower abundance, there was a significant interaction effect of year alone at Spruce Fir when retaining data from the extra sampling week (Table A2), which was not seen in our main text analyses. It is possible that retaining the very low flower abundances collected during the extra week deflated flower abundance and yielded a significant effect of the year. For pollinator abundance in our supplemental analyses, there was a significant effect of year alone at Mixed Conifer, which was not seen in our main text analyses. Again, these differences indicate that removing the extra sampling week from the dataset before conducting analyses was the best choice to accurately compare any differences across years.
Table A3Summary statistics for the generalized linear mixed models (GLMMs) assessing temporal changes in plant and pollinator species richness estimates across years when data from the extra sampling week in 2018 were retained. A * symbol shown between two terms represents the interaction of those fixed factors.
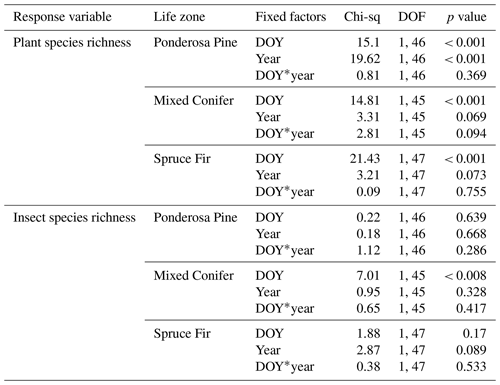
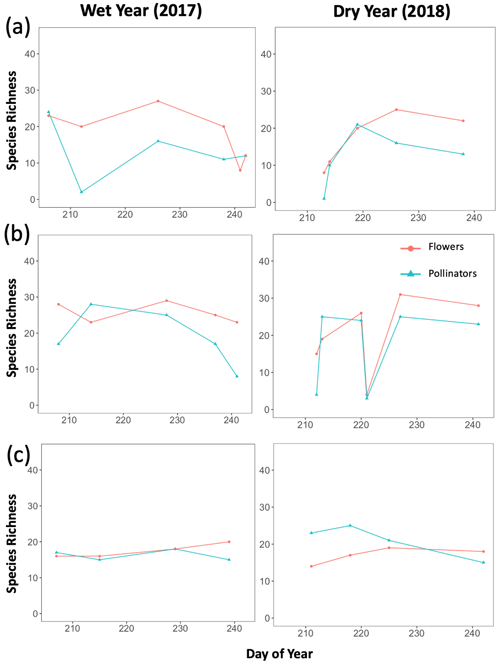
Figure B1Trends in total species richness for both plants and pollinators across the full sampling season for each year. Graphs were created separately for each life zone (a Ponderosa Pine, b Mixed Conifer, and c Spruce Fir), with species richness of either plants or pollinators as the dependent variable and sampling day (numerical values 1–366 assigned to each calendar date, a.k.a. Julian date) as the independent variable. These graphs were used to visualize how the seasonal progression (timing) of plant and pollinator activity varied between a wet year and a dry year, with total species richness values considered indicators of activity.
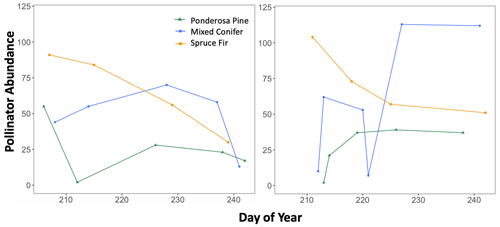
Figure B2Trends in total pollinator abundance across the full sampling season for each life zone for each year, with pollinator abundance as the dependent variable and sampling day (numerical values 1–366 assigned to each calendar date, a.k.a. Julian date) as the independent variable. These graphs were used to visualize how the seasonal progression (timing) of pollinator activity varied between a wet year and a dry year, with total abundance values considered indicators of activity.
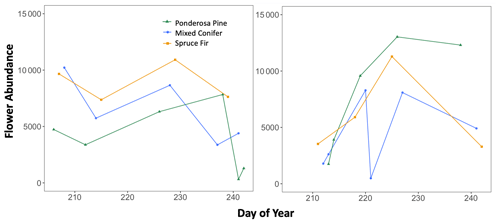
Figure B3Trends in total plant abundance (number of flowers) across the full sampling season, with flower abundance as the dependent variable and sampling day (numerical values 1–366 assigned to each calendar date, a.k.a. Julian date) as the independent variable. These graphs were used to visualize how the seasonal progression (timing) of plant and pollinator activity varied between a wet year and a dry year, with total abundance values considered indicators of activity.
Comprehensive R scripts used to create graphs, run analyses, and produce statistics are included in our figshare project, found at https://doi.org/10.6084/m9.figshare.24944643 (Chesshire, 2024b).
The master plant–pollinator interaction data from the 2017 and 2018 field seasons, additional data CSVs required for some or all of the R scripts, and the five supplemental Excel files referenced in the text are hosted on figshare at https://doi.org/10.6084/m9.figshare.24944643 (Chesshire, 2024b). The project is entitled “Shifts in northern Arizona plant and insect pollinator communities between 2 years with substantially different precipitation totals” and descriptions of each uploaded file are given in the included README.md file. The link to the project can be also found at https://figshare.com/s/11ed753e3cbeb89d3046 (Chesshire, 2024a).
The supplement related to this article is available online at: https://doi.org/10.5194/we-25-5-2025-supplement.
PRC conceptualized the paper idea and the methodology and carried out the formal analyses. PRC wrote the original manuscript. LMH provided supervision during manuscript construction and reviewed multiple versions of the paper.
The contact author has declared that neither of the authors has any competing interests.
Publisher's note: Copernicus Publications remains neutral with regard to jurisdictional claims made in the text, published maps, institutional affiliations, or any other geographical representation in this paper. While Copernicus Publications makes every effort to include appropriate place names, the final responsibility lies with the authors.
We would like to acknowledge the numerous undergraduate research field assistants at Northern Arizona University who collected plant–pollinator association data in 2017 and 2018. We are incredibly grateful to Neil Cobb for guidance and supervision during sampling seasons and as an academic advisor, for providing field and lab work equipment, and for providing lab space during the collection and species identification phases of the project. We would also like to thank Kyle Christie (NAU) for his guidance behind the statistical analyses, as well as Lindsie McCabe (USDA-ARS) for bee identifications and assistance with field sampling methodology and collection during her time at NAU. Finally, we thank all insect identification experts who provided species or genus level IDs on the specimens, including Dave Smith (USFSW), Jason Gibbs (University of Manitoba), Harold Ikerd (USDA-ARS), Terry Griswold (USDA-ARS), Karen Wright (Texas A&M), and John Carr (MIT).
This paper was edited by Sérgio Timóteo and reviewed by Edith Villa-Galaviz and three anonymous referees.
Adedoja, O. A., Kehinde, T., and Samways, M. J. Insect-flower interaction networks vary among endemic pollinator taxa over an elevation gradient, PLoS ONE, 13, 1–17, https://doi.org/10.1371/journal.pone.0207453, 2018.
Adedoja, O., Kehinde, T., and Samways, M. J.: Asynchrony among insect pollinator groups and flowering plants with elevation, Scientific Reports, 10, 1–12, https://doi.org/10.1038/s41598-020-70055-5, 2020.
Alarcón, R., Waser, N. M., and Ollerton, J.: Year-to-year variation in the topology of a plant–pollinator interaction network, Oikos, 117, 1796–1807, https://doi.org/10.1111/j.0030-1299.2008.16987.x, 2008.
Ascher, J. S. and Pickering, J.: Discover Life: Bee species guide and world checklist (Hymenoptera: Apoidea: Anthophila), http://www.discoverlife.org/mp/20q?guide=Apoidea_species (last access: 31 August 2021), 2023.
Balling, R. C. and Goodrich, G. B.: Increasing drought in the American Southwest? A continental perspective using a spatial analytical evaluation of recent trends, Phys. Geogr., 31, 293–306, https://doi.org/10.2747/0272-3646.31.4.293, 2010.
Bartomeus, I., Ascher, J. S., Wagner, D., Danforth, B. N., Colla, S., Kornbluth, S., and Winfree, R.: Climate-associated phenological advances in bee pollinators and bee-pollinated plants, P. Natl. Acad. Sci. USA, 108, 20645–20649, https://doi.org/10.1073/pnas.1115559108, 2011.
Barton, B. T. and Ives, A. R.: Direct and indirect effects of warming on aphids, their predators, and ant mutualists, Ecology, 95, 1479–1484, https://doi.org/10.1890/13-1977.1, 2014.
Bascompte, J., Jordano, P., Melián, C. J., and Olesen, J. M.: The nested assembly of plant–animal mutualistic networks, P. Natl. Acad. Sci. USA, 100, 9383–9387, https://doi.org/10.1073/pnas.1633576100, 2003.
Bates, D., Maechler, M., Bolker, B., and Walker, S: lme4: Linear Mixed-Effects Models Using Eigen and S4, R package version 1.1-10, Comprehensive R Archive Network (CRAN), https://doi.org/10.32614/CRAN.package.lme4, 2015.
Biella, P., Bogliani, G., Cornalba, M., Manino, A., Neumayer, J., Porporato, M., Rasmont, P., and Milanesi, P.: Distribution patterns of the cold adapted bumblebee Bombus alpinus in the Alps and hints of an uphill shift (Insecta: Hymenoptera: Apidae), J. Insect Conserv., 21, 357–366, https://doi.org/10.1007/s10841-017-9983-1, 2017.
Biella, P., Akter, A., Ollerton, J., Tarrant, S., Janeček, Š., Jersáková, J., and Klecka, J.: Experimental loss of generalist plants reveals alterations in plant-pollinator interactions and a constrained flexibility of foraging, Scientific Reports, 9, 1–13, https://doi.org/10.1038/s41598-019-43553-4, 2019.
Bolker, B.: Getting started with the glmmTMB package, Cran, R-project vignette, 9, 1–8, https://doi.org/10.32614/RJ-2017-066, 2019.
Bowers, J. E. and McLaughlin, S. P.: Flora of the Huachuca Mountains, a botanically rich and historically significant sky island in Cochise County, Arizona, Journal of the Arizona-Nevada Academy of Science, 29, 66–107, https://www.jstor.org/stable/40024176 (last access: 1 March 2023), 1996.
Brock, J. P. and Kaufman, K.: Kaufman field guide to butterflies of North America, Houghton Mifflin Harcourt, ISBN 0618768262, 2006.
Brooks, M., Bolker, B., Kristensen, K., Maechler, M., Magnusson, A., and McGillycuddy, M.: Package 'glmmtmb', R Package Version 1.1.9, Comprehensive R Archive Network (CRAN), https://doi.org/10.32614/CRAN.package.glmmTMB, 2023.
Burkle, L. A. and Runyon, J. B.: Drought and leaf herbivory influence floral volatiles and pollinator attraction, Glob. Change Biol., 22, 1644–1654, https://doi.org/10.1111/gcb.13149, 2016.
Burkle, L. A., Marlin, J. C., and Knight, T. M.: Plant-pollinator interactions over 120 years: loss of species, co-occurrence, and function, Science, 339, 1611–1615, https://doi.org/10.1126/science.1232728, 2013.
CaraDonna, P. J., Petry, W. K., Brennan, R. M., Cunningham, J. L., Bronstein, J. L., Waser, N. M., and Sanders, N. J.: Interaction rewiring and the rapid turnover of plant–pollinator networks, Ecol. Lett., 20, 385–394, https://doi.org/10.1111/ele.12740, 2017.
Chao, A., Gotelli, N. J., Hsieh, T., Sander, E. L., Ma, K., Colwell, R. K., and Ellison, A. M.: Rarefaction and extrapolation with Hill numbers: a framework for sampling and estimation in species diversity studies, Ecol. Monogr., 84, 45–67, https://doi.org/10.1890/13-0133.1, 2014.
Chen, T., Werf, G. R., Jeu, R. A. M., Wang, G., and Dolman, A. J.: A global analysis of the impact of drought on net primary productivity, Hydrol. Earth Syst. Sci., 17, 3885–3894, https://doi.org/10.5194/hess-17-3885-2013, 2013.
Chesshire, P. R.: Impacts of short-term drought on insect pollinator communities and plant-pollinator interactions in northern Arizona, Figshare [data set], https://figshare.com/s/11ed753e3cbeb89d3046 (last access: 31 August 2021), 2024a.
Chesshire, P. R.: Shifts in northern Arizona plant and insect pollinator communities between 2 years with substantially different precipitation totals, Figshare [data set/code], https://doi.org/10.6084/m9.figshare.24944643, 2024b.
Chesshire, P. R., McCabe, L. M., and Cobb, N. S.: Variation in Plant–Pollinator Network Structure along the Elevational Gradient of the San Francisco Peaks, Arizona, Insects, 12, 1060, https://doi.org/10.3390/insects12121060, 2021.
Colwell, R. K., Chao, A., Gotelli, N. J., Lin, S.-Y., Mao, C. X., Chazdon, R. L., and Longino, J. T.: Models and estimators linking individual-based and sample-based rarefaction, extrapolation and comparison of assemblages, J. Plant Ecol., 5, 3–21, https://doi.org/10.1093/jpe/rtr044, 2012.
Cook, B. I., Ault, T. R., and Smerdon, J. E.: Unprecedented 21st century drought risk in the American Southwest and Central Plains, Science Advances, 1, e1400082, https://doi.org/10.1126/sciadv.1400082, 2015.
Cuartas-Hernández, S. and Medel, R.: Topology of plant-flower-visitor networks in a tropical mountain forest: insights on the role of altitudinal and temporal variation, PLoS One, 10, e0141804, https://doi.org/10.1371/journal.pone.0141804, 2015.
Dai, A.: Increasing drought under global warming in observations and models, Nat. Clim. Change, 3, 52–58, https://doi.org/10.1038/nclimate1633, 2013.
Dáttilo, W., Guimaraes Jr., P. R., and Izzo, T. J.: Spatial structure of ant–plant mutualistic networks, Oikos, 122, 1643–1648, https://doi.org/10.1111/j.1600-0706.2013.00562.x, 2013.
Devoto, M., Medan, D., Roig-Alsina, A., and Montaldo, N. H.: Patterns of species turnover in plant-pollinator communities along a precipitation gradient in Patagonia (Argentina), Austral Ecol., 34, 848–857, https://doi.org/10.1111/j.1442-9993.2009.01987.x, 2009.
Donoso, I., Stefanescu, C., Martínez-Abraín, A., and Traveset, A.: Phenological asynchrony in plant–butterfly interactions associated with climate: a community-wide perspective, Oikos, 125, 1434–1444, https://doi.org/10.1111/oik.03053, 2016.
Doré, M., Fontaine, C., and Thébault, E.: Relative effects of anthropogenic pressures, climate, and sampling design on the structure of pollination networks at the global scale, Glob. Change Biol., 27, 1266–1280, https://doi.org/10.1111/gcb.15474, 2021.
Endres, K. L., Morozumi, C. N., Loy, X., Briggs, H. M., CaraDonna, P. J., Iler, A. M., Picklum, D. A., Barr, W. A., and Brosi, B. J.: Plant–pollinator interaction niche broadens in response to severe drought perturbations, Oecologia, 197, 577–588, https://doi.org/10.1007/s00442-021-05036-0, 2021.
Evans, N. T., Li, Y., Renshaw, M. A., Olds, B. P., Deiner, K., Turner, C. R., Jerde, C. L., Lodge, D. M., Lamberti, G. A., and Pfrender, M. E.: Fish community assessment with eDNA metabarcoding: effects of sampling design and bioinformatic filtering, Can. J. Fish. Aquat. Sci., 74, 1362–1374, https://doi.org/10.1139/cjfas-2016-0306, 2017.
Fontaine, C., Collin, C. L., and Dajoz, I.: Generalist foraging of pollinators: diet expansion at high density, J. Ecol., 96, 1002–1010, https://doi.org/10.1111/j.1365-2745.2008.01405.x, 2008.
Forrest, J. R.: Plant–pollinator interactions and phenological change: what can we learn about climate impacts from experiments and observations?, Oikos, 124, 4–13, https://doi.org/10.1111/oik.01386, 2015.
Fox, J., Weisberg, S., Adler, D., Bates, D., Baud-Bovy, G., Ellison, S., Firth, D., Friendly, M., Gorjanc, G., and Graves, S.: Package 'car', R Foundation for Statistical Computing, Vienna, 16, 4–10, https://doi.org/10.32614/CRAN.package.car, 2012.
Fukami, T. and Wardle, D. A.: Long-term ecological dynamics: reciprocal insights from natural and anthropogenic gradients, P. Roy. Soc. B-Biol. Sci., 272, 2105–2115, https://doi.org/10.1098/rspb.2005.3277, 2005.
Glinos, E., Condat, E., Mulieri, P., and Ashworth, L.: Essential dependence on wild pollination service: a medicinal plant under threat Minthostachys verticillata (Lamiaceae), Arthropod-Plant Inte., 13, 865–874, https://doi.org/10.1007/s11829-019-09705-z, 2019.
Gómez, J. M. and Zamora, R.: Plant–Pollinator Interactions: From specialization to generalization, Chapter 7 – Ecological factors that promote the evolution of generalization in pollination systems, The University of Chicago press, 145–166, ISBN 9780226874005, 2006.
Hegland, S. J., Nielsen, A., Lázaro, A., Bjerknes, A. L., and Totland, Ø.: How does climate warming affect plant-pollinator interactions?, Ecol. Lett., 12, 184–195, https://doi.org/10.1111/j.1461-0248.2008.01269.x, 2009.
Hoiss, B., Krauss, J., and Steffan-Dewenter, I.: Interactive effects of elevation, species richness and extreme climatic events on plant–pollinator networks, Glob. Change Biol., 21, 4086–4097, https://doi.org/10.1111/gcb.12968, 2015.
Hsieh, T., Ma, K., and Chao, A.: iNEXT: an R package for rarefaction and extrapolation of species diversity (Hill numbers), Methods Ecol. Evol., 7, 1451–1456, https://doi.org/10.1111/2041-210X.12613, 2016.
Hung, K.-L. J., Sandoval, S. S., Ascher, J. S., and Holway, D. A.: Joint impacts of drought and habitat fragmentation on native bee assemblages in a California biodiversity hotspot, Insects, 12, 135, https://doi.org/10.3390/insects12020135, 2021.
Inouye, D. W.: Effects of climate change on phenology, frost damage, and floral abundance of montane wildflowers, Ecology, 89, 353–362, https://doi.org/10.1890/06-2128.1, 2008.
IPCC: IPCC Sixth Assessment Report: Impacts, Adaptation and Vulnerability, Cambridge University Press, Cambridge University Press, Cambridge, UK and New York, NY, USA, https://doi.org/10.1017/9781009325844, 2022.
Johnson, S. D. and Steiner, K. E.: Generalization versus specialization in plant pollination systems, Trends Ecol. Evol., 15, 140–143, https://doi.org/10.1016/S0169-5347(99)01811-X, 2000.
Kearns, C. A.: Anthophilous fly distribution across an elevation gradient, Am. Midl. Nat., 127, 172–182, https://doi.org/10.2307/2426332, 1992.
Klein, A.-M., Vaissiere, B. E., Cane, J. H., Steffan-Dewenter, I., Cunningham, S. A., Kremen, C., and Tscharntke, T.: Importance of pollinators in changing landscapes for world crops, P. R. Soc. B, 274, 303–313, https://doi.org/10.1098/rspb.2006.3721, 2007.
Kudo, G.: Vulnerability of phenological synchrony between plants and pollinators in an alpine ecosystem, Ecol. Res., 29, 571–581, https://doi.org/10.1007/s11284-013-1108-z, 2014.
Kudo, G. and Ida, T. Y.: Early onset of spring increases the phenological mismatch between plants and pollinators, Ecology, 94, 2311–2320, https://doi.org/10.1890/12-2003.1, 2013.
Lance, R. F., Bailey, P., Lindsay, D. L., and Cobb, N. S.: Precipitation and the robustness of a plant and flower-visiting insect network in a xeric ecosystem, J. Arid Environ., 144, 48–59, https://doi.org/10.1016/j.jaridenv.2017.03.015, 2017.
Lázaro, A., Hegland, S. J., and Totland, Ø.: The relationships between floral traits and specificity of pollination systems in three Scandinavian plant communities, Oecologia, 157, 249–257, https://doi.org/10.1007/s00442-008-1066-2, 2008.
Lenth, R., Singmann, H., Love, J., Buerkner, P., and Herve, M.: Emmeans: Estimated marginal means, aka least-squares means, R package version 1.8.9, Comprehensive R Archive Network (CRAN), https://doi.org/10.32614/CRAN.package.emmeans, 2018.
Mangiafico, S.: An R companion for the handbook of biological statistics, version 1.3.9 (Revised 2023), Rutgers Cooperative Extension, New Jersey, https://rcompanion.org/rcompanion/ (last access: 20 April 2024), 2015.
Marshall, S. A.: Flies: The natural history & diversity of Diptera, 595.77 M3, Firefly Books, ISBN 9781770851009, 2012.
McCabe, L. M., Colella, E., Chesshire, P., Smith, D., and Cobb, N. S.: The transition from bee-to-fly dominated communities with increasing elevation and greater forest canopy cover, PloS ONE, 14, e0217198, https://doi.org/10.1371/journal.pone.0217198, 2019.
McCabe, L. M., Chesshire, P. R., Smith, D. R., Wolf, A., Gibbs, J., Griswold, T. L., Wright, K. W., and Cobb, N. S.: Bee species checklist of the San Francisco Peaks, Arizona, Biodiversity Data Journal, 8, e49285, https://doi.org/10.3897/BDJ.8.e49285, 2020.
Memmott, J., Craze, P. G., Waser, N. M., and Price, M. V.: Global warming and the disruption of plant–pollinator interactions, Ecol. Lett., 10, 710–717, https://doi.org/10.1111/j.1461-0248.2007.01061.x, 2007.
Menne, M. J., Durre, I., Vose, R. S., Gleason, B. E., and Houston, T. G.: An overview of the global historical climatology network-daily database, J. Atmos. Ocean. Tech., 29, 897–910, https://doi.org/10.1175/JTECH-D-11-00103.1, 2012a.
Menne, M. J., Durre, I., Korzeniewski, B., McNeill, S., Thomas, K., Yin, X., Anthony, S., Ray, R., Vose, R. S., Gleason, B. E., and Houston, T. G.: Global Historical Climatology Network - Daily (GHCN-Daily), Version 3, NOAA National Climatic Data Center [code], https://doi.org/10.7289/V5D21VHZ, 2012b.
Merriam, C. H. and Stejneger, L.: Results of a biological survey of the San Francisco Mountain region and desert of the Little Colorado, Arizona, US Government Printing Office, https://doi.org/10.2307/4068043, 1890.
Michener, C. D.: The bees of the world, JHU press, ISBN 0801861330, 2000.
Michener, C. D., McGinley, R. J., and Danforth, B. N.: The bee genera of North and Central America (Hymenoptera: Apoidea), Smithsonian Institution Press, ISBN 978-1-56098-256-2, 1994.
Morales, C. L. and Traveset, A.: Interspecific pollen transfer: magnitude, prevalence and consequences for plant fitness, Crit. Rev. Plant Sci., 27, 221–238, https://doi.org/10.1080/07352680802205631, 2008.
Norrbom, A. L., Sutton, B. D., Steck, G. J., and Monzon, J.: New genera, species and host plant records of Nearctic and Neotropical Tephritidae (Diptera), http://www.mapress.com/zootaxa/2010/f/zt02398p065.pdf (last access: 31 August 2021), 2010.
Orr, M. C., Hughes, A. C., Chesters, D., Pickering, J., Zhu, C.-D., and Ascher, J. S.: Global patterns and drivers of bee distribution, Curr. Biol., 31, 451–458, https://doi.org/10.1016/j.cub.2020.10.053, 2021.
Osorio-Canadas, S., Flores-Hernández, N., Sánchez-Ortiz, T., and Valiente-Banuet, A.: Changes in the structure and composition of the 'Mexical' scrubland bee community along an elevational gradient, PloS ONE, 16, e0254072, https://doi.org/10.1371/journal.pone.0254072, 2021.
Pauli, J. N., Zuckerberg, B., Whiteman, J. P., and Porter, W.: The subnivium: a deteriorating seasonal refugium, Front. Ecol. Environ., 11, 260–267, https://doi.org/10.1890/120222, 2013.
Phillips, B. B., Shaw, R. F., Holland, M. J., Fry, E. L., Bardgett, R. D., Bullock, J. M., and Osborne, J. L.: Drought reduces floral resources for pollinators, Glob. Change Biol., 24, 3226–3235, https://doi.org/10.1111/gcb.14130, 2018.
Ponisio, L. C., Valdovinos, F. S., Allhoff, K. T., Gaiarsa, M. P., Barner, A., Guimarães Jr., P. R., Hembry, D. H., Morrison, B., and Gillespie, R.: A network perspective for community assembly, Front. Ecol. Evol., 7, 103, https://doi.org/10.3389/fevo.2019.00103, 2019.
Potts, S. G., Biesmeijer, J. C., Kremen, C., Neumann, P., Schweiger, O., and Kunin, W. E.: Global pollinator declines: trends, impacts and drivers, Trends Ecol. Evol., 25, 345–353, https://doi.org/10.1016/j.tree.2010.01.007, 2010.
Rabeling, S. C., Lim, J. L., Tidon, R., Neff, J. L., Simpson, B. B., and Pawar, S.: Seasonal variation of a plant-pollinator network in the Brazilian Cerrado: Implications for community structure and robustness, PLoS ONE, 14, e0224997, https://doi.org/10.1371/journal.pone.0224997, 2019.
R Core Team: _R: A Language and Environment for Statistical Computing, Foundation for Statistical Computing, https://www.R-project.org/ (last access: 31 August 2021), 2023.
Schenk, M., Krauss, J., and Holzschuh, A.: Desynchronizations in bee–plant interactions cause severe fitness losses in solitary bees, J. Anim. Ecol., 87, 139–149, https://doi.org/10.1111/1365-2656.12694, 2018.
Schwarz, B., Vázquez, D. P., CaraDonna, P. J., Knight, T. M., Benadi, G., Dormann, C. F., Gauzens, B., Motivans, E., Resasco, J., and Blüthgen, N.: Temporal scale-dependence of plant–pollinator networks, Oikos, 129, 1289–1302, https://doi.org/10.1111/oik.07303, 2020.
Schweiger, O., Biesmeijer, J. C., Bommarco, R., Hickler, T., Hulme, P. E., Klotz, S., Kühn, I., Moora, M., Nielsen, A., Ohlemüller, R., Petanidou, T., Potts, S. G., Pyšek, P., Stout, J. C., Sykes, M. T., Tscheulin, T., Vilà, M., Walther, G.-R., Westphal, C., Winter, M., Zobel, M., and Settele, J.: Multiple stressors on biotic interactions: how climate change and alien species interact to affect pollination, Biol. Rev., 85, 777–795, https://doi.org/10.1111/j.1469-185X.2010.00125.x, 2010.
Simpson, D. T., Weinman, L. R., Genung, M. A., Roswell, M., MacLeod, M., and Winfree, R.: Many bee species, including rare species, are important for function of entire plant–pollinator networks, P. R. Soc. B, 289, 20212689, https://doi.org/10.1098/rspb.2021.2689, 2022.
Skevington, J. H., Locke, M. M., Young, A. D., Moran, K., Crins, W. J., and Marshall, S. A.: Field guide to the flower flies of northeastern North America, Princeton University Press, ISBN 0691189404, 2019.
Smith, R., Higgins, J., Burton, J., and Cobb, N. S.: Bee diversity and abundance along an elevational gradient in Northern Arizona, The Colorado Plateau VI: Science and management at the landscape scale, 18, 159–189, ISBN 978-0-8165-3159-2, 2015.
Spehn, E. M. and Körner, C.: A global assessment of mountain biodiversity and its function, in: Global Change and Mountain Regions, Springer, 393–400, ISBN 978-1842140918, 2005.
Thébault, E. and Fontaine, C.: Stability of ecological communities and the architecture of mutualistic and trophic networks, Science, 329, 853–856, https://doi.org/10.1126/science.1188321, 2010.
Waser, N. M. and Price, M. V.: Drought, pollen and nectar availability, and pollination success, Ecology, 97, 1400–1409, https://doi.org/10.1890/15-1423.1, 2016.
Waser, N. M., Chittka, L., Price, M. V., Williams, N. M., and Ollerton, J.: Generalization in pollination systems, and why it matters, Ecology, 77, 1043–1060, https://doi.org/10.2307/2265575, 1996.
Wilder, D. D.: Systematics of the Nearctic Ptilodexia Brauer and Bergenstamm (Diptera: Tachinidae), The Pennsylvania State University, ISBN 9798641057385, 1976.
Williams, A. P., Cook, B. I., and Smerdon, J. E.: Rapid intensification of the emerging southwestern North American megadrought in 2020–2021, Nat. Clim. Change, 12, 232–234, https://doi.org/10.1038/s41558-022-01290-z, 2022.
Winfree, R., Williams, N. M., Dushoff, J., and Kremen, C.: Species abundance, not diet breadth, drives the persistence of the most linked pollinators as plant-pollinator networks disassemble, Am. Nat., 183, 600–611, https://doi.org/10.1086/675716, 2014.


