
the Creative Commons Attribution 4.0 License.
the Creative Commons Attribution 4.0 License.
 | 12 Aug 2026
Seasonal and long-term patterns of reproductive phenology in the Wet Tropics rainforests of Australia
Nara O. Vogado
Jayden E. Engert
Michael J. Liddell
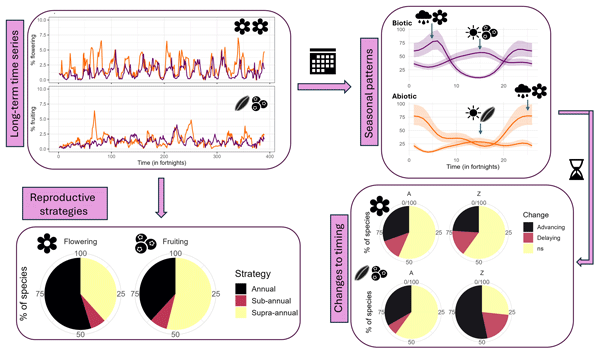
Understanding reproductive phenology in tropical rainforests is important for predicting forest dynamics, ecosystem processes, and forest vulnerability. Long-term plant phenology datasets from tropical rainforests are relatively rare, particularly in Oceania. Here, canopy observations collected by a single observer using a forest gondola system generated a 15-year weekly flowering and fruiting dataset of 132 species in the Wet Tropics of Queensland, Australia. Using this dataset, we investigated seasonal and long-term reproductive phenology at the community and species level. At the community level, flowering was strongly seasonal and concentrated in the wet season, while fruiting showed weaker seasonality and was generally concentrated in the dry season. The timing of peak flowering and fruiting activity differed between abiotic and biotic groups. Over the 15-year study period, some species advanced or delayed flowering and fruiting. Flowering timing was largely stable across both biotically and abiotically dispersed species, with most species showing no significant change. Changes in fruiting timing were more common among biotically dispersed species, including both advances and delays, whereas most abiotically dispersed species showed no significant change. Annual cycles were most common in flowering, whereas supra-annual cycles were predominant in fruiting. At the species level, reproductive activity occurred throughout the year but varied markedly in timing, with many species displaying supra-annual flowering and fruiting. Supra-annual flowering was more likely in biotically dispersed species, while supra-annual fruiting was more likely in species with larger seeds. Finally, we present the first comprehensive phenological calendar for 81 tree species in the Wet Tropics rainforests of Queensland. These findings provide a foundation for future ecological research and restoration practice in the region.
Please read the corrigendum first before continuing.
-
Notice on corrigendum
The requested paper has a corresponding corrigendum published. Please read the corrigendum first before downloading the article.
-
Article
(3794 KB)
- Corrigendum
-
Supplement
(826 KB)
-
The requested paper has a corresponding corrigendum published. Please read the corrigendum first before downloading the article.
- Article
(3794 KB) - Full-text XML
- Corrigendum
-
Supplement
(826 KB) - BibTeX
- EndNote


Knowledge of plant phenological patterns is essential for understanding the ecology of forest ecosystems. Reproductive phenological patterns shape recruitment rates, local species abundance, vegetation composition, and structure, and drive the availability of vital resources for nectivores and frugivores throughout the year. Despite their importance, phenological studies require significant investment in terms of resources and time. Consequently, long-term phenological studies are rare in the tropics, particularly in the tropical region of Oceania. In addition to a low number of long-term studies, the high species diversity in the tropics makes understanding phenological patterns more challenging, as it is difficult to distinguish phenological patterns at the species level from community patterns due to the low density of individuals of many species (Morellato et al., 2010; Newstrom et al., 1994; Sakai, 2001; Mendoza et al., 2017). Long-term phenological studies at both the community and species level are of considerable importance for unravelling the complex ecological processes that occur in tropical forests, as well as for providing baseline data for modelling forest responses to climate change.
Globally, the majority of the world's vascular plant species are found in humid tropical forest biomes (Eiserhardt et al., 2017), and these species exhibit a wide range of complex phenological patterns. Examples of these complex phenological patterns include community masting events (Numata et al., 2013; Chen et al., 2018; Numata et al., 2022), communities with high diversity in phenological reproductive intervals, and communities where species flower and fruit multiple times a year (van Schaik et al., 1993, Newstrom et al., 1994; Adamescu et al., 2018; Mendoza et al., 2018). The high biodiversity of tropical rainforests often presents diverse, out-of-phase phenological patterns, which align with the concept of temporal partitioning to mitigate competition for resources.
Biotically and abiotically dispersed species are expected to present different phenology as different size, shape, and mass seeds and fruits require different environmental conditions to aid fruit development and seed dispersal. For example, in some tropical regions, wind-dispersed species disperse their seeds during the dry season due to increased wind speeds and, depending on the forest type and location, a reduced canopy leaf area in this season (Janzen, 1967; van Schaik et al., 1993; Griz and Machado, 2001). Wind-dispersed seed production has been reported to present greater inter-annual variation than animal-dispersed fruit production (Janzen, 1974). In contrast, species that present animal-dispersed fruit require increased water availability and higher temperatures for fruit maturation and the maintenance of attractiveness (Chen et al., 2017). Because of the different drivers and the potential for divergent changes in phenological activity over time, we have explored patterns of abiotically and biotically dispersed species separately at both the community and species level. In some tropical forests, synchronised supra-annual flowering has been linked to pollinator availability or behaviour, with higher floral resource density resulting in increased pollinator attraction and the likelihood of plants using generalist pollinators (Janzen, 1974; Schemske, 1981; Ashton et al., 1988; de Jong et al., 1992; Sakai et al., 1999; Curran and Webb, 2000; Momose et al., 1998).
Ecosystem and plant performance have been shown to be linked to functional traits (Migliavacca et al., 2021; Bruelheide et al., 2018). Studies in non-tropical biomes have found evidence that interspecific variations in plant phenology are influenced by species' functional traits (Wang et al., 2022; Sun and Frelich, 2011; Craine et al., 2012; Wolkovich and Cleland, 2014; Bucher et al., 2018; König et al., 2018; Bucher and Römermann, 2020; Segrestin et al., 2020; Liu et al., 2021). In tropical forests, however, very little is known about the relationship between plant traits, environmental change, and patterns in reproductive phenology (Peìrez-Ramos et al., 2020).
The Wet Tropics World Heritage area in Queensland is a global hotspot of biodiversity, with a high rate of endemism (Williams et al., 2011). The forests found in the region are considered highly sensitive to the climatic changes expected over the next century (Hughes, 2003; IPCC, 2021) but are expected to be resilient in terms of persistence of the rainforest biome type (Staal et al., 2020). Although phenological research in the region is scarce, reported studies have demonstrated the importance of long-term datasets (Boulter et al., 2006; Edwards et al., 2018; Vogado et al., 2022). Through the analysis of long-term data, phenological patterns of flowering and seed reproduction were identified for the black palm (Normanbya normanbyi), which provided insight into resource availability at the species level for this endemic tropical rainforest palm (Vogado et al., 2020). At the community level, baseline phenology is critical to understand natural forest dynamics, regeneration, and how external drivers (climate change, land cover change, pests) are affecting forests in the region (Vogado et al., 2023), as well as to understand changes in plant–animal distributions and interactions.
In this study, we characterised the phenology of a large number of tree species in the lowland tropical rainforest of the Wet Tropics, analysing seasonal and long-term patterns of flowering and fruiting. We present 15 years of phenology collected at the same site (Skyrail) by the same observer every week, using a canopy gondola system over a 7.5 km transect to report reproductive activity in 132 tree species (81 species presented activity in more than 10 subplots over the course of the study and were analysed at the species level). Previous work at the Skyrail site has included liana phenology (Vogado et al., 2022), leafing phenology of Davidsonia pruriens (Vogado and Liddell, 2025), and a multi-site comparative phenology study of the species Cardwellia sublimis (Vogado et al., 2025). Due to the spatial scale of Skyrail, species coverage, and length of the study, this work provides baseline information on phenological patterns for the rainforests of this region. We further explore the influence of functional traits on both annual and supra-annual phenological activity. We also tested for changes in phenological timing and if they were related to functional traits. Finally, we have provided a phenological calendar for each studied rainforest tree species. These calendars will provide a resource facilitating research on ecosystem function, as well as informing seed collection and restoration planning.
2.1 Study area
Phenological observations of a tropical rainforest canopy were conducted for 15 years (2000–2014 inclusive) using the Skyrail Rainforest Cableway (https://www.skyrail.com.au, last access: 30 May 2026), a 7.5 km scenic gondola cableway running above Barron Gorge National Park. Barron Gorge National Park comprises part of the Wet Tropics World Heritage Area of Australia (16.84° S, 145.64° E), whose listing was partially due to its recognition as a hotspot of plant and animal biodiversity. The vegetation community of the park, part of the traditional lands of the Djabugay people, is composed of a closed-canopy mesophyll/notophyll vine forest (Tracey, 1982). The study region experiences climatic seasonality, with a drier season from June to November and a wetter season from December to May.
2.2 Phenological observations
Flowering (open flowers) and fruiting (unripe and ripe fruits combined) activity were recorded weekly from January 2000 to December 2014 by the same observer (Vogado et al., 2022, 2025). The observer scored phenology from above using a maintenance gondola. Although the Skyrail gondola provided excellent above-canopy visibility, it moved continuously along the transect at ∼ 5 m s−1. As a result, there was insufficient time for the observer to score flowering or fruiting intensity or assign unique identifiers to individual trees. Instead, only the presence or absence of flowers and/or fruits, species identity, and an approximate location (subplot) were recorded. Visual identification of species from the gondola was cross-checked against ground-collected plant samples (vegetative and reproductive traits) identified using the Australian Rainforest Key (Zich et al., 2018). To quantify observational records, the total area sampled was divided into 10 subplots of ∼ 100 m width and ∼ 25 m length, between each pair of 33 towers, for a total of 320 subplots (Vogado et al., 2022; Vogado and Liddell, 2025). The total area sampled using the 320 subplots was estimated to be approximately 80 ha. We recorded the presence or absence of flowering and fruiting activity in each subplot for all 132 tree species in the tree community (see Table 1 in the Supplement). For more details on the site, see Vogado et al. (2022), and Vogado and Liddell (2025).
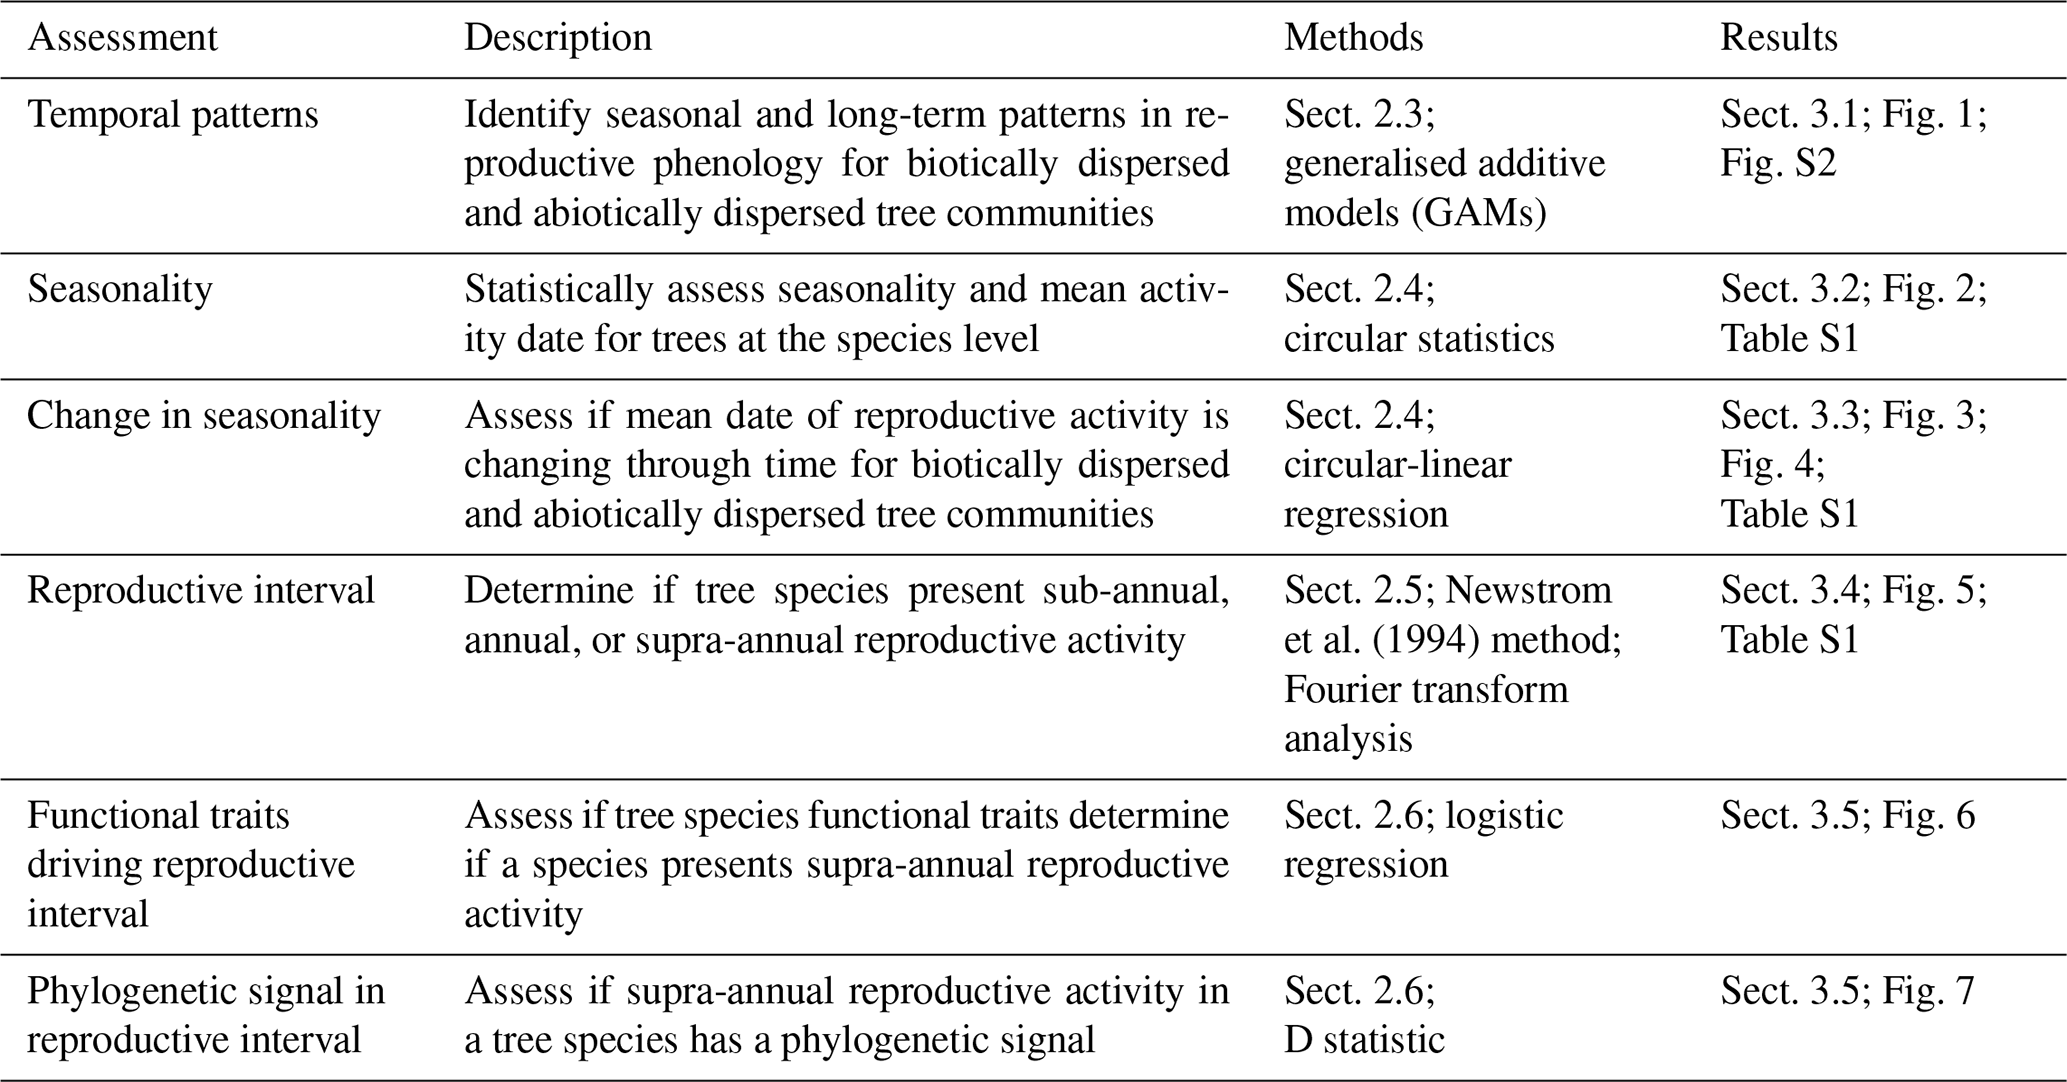
Table 1Reproductive phenological assessments conducted in this study and related coverage in the methods and results.
We considered the presence of phenological activity (open flowers or fruits) of a single species in a subplot as a single observation. To avoid missing dates, we binned the observations into fortnightly, using the presence or absence of activity for the fortnight. Because each subplot observation recorded ≥1 active individual, our response variable represents subplot occupancy by a phenophase. This subplot occupancy cannot be converted into the number of flowering or fruiting individuals or used to estimate the intensity of activity. As a result, the reported “peak flowering and fruiting dates” reflect the maximum spatial occurrence of species-level activity along the transect rather than the maximum number of active individuals or the greatest intensity of flowering or fruiting. To calculate the maximum possible activity, we first identified the number of subplots that ever reported any phenological activity for each species and used this as the maximum possible activity for that species. We then summed the maximum possible activity values for all species included in the analysis and considered this the maximum possible activity for the community. We similarly calculated the community activity (absolute) at any given period as the total activity records for all species (across all subplots) for that time. For each species, we converted absolute activity to relative activity by dividing the number of active subplots for that species at the measurement date by that species' maximum possible activity. Analysis of temporal patterns, i.e. seasonality and long-term patterns, was conducted using generalised additive models (GAMs) (detailed in Sect. 2.3). For this analysis, we used community-level absolute activity (the number of total observations per fortnight), whereas for the circular statistics, we used species-level relative activity as a percentage (the calculated proportion multiplied by 100). Community-level activity was converted from absolute to relative (%) by dividing community activity by the maximum possible community activity.
For species-specific analyses, we used only species that presented activity in a minimum of 10 subplots over the course of the study (i.e. ≥10 subplot sampling units that had ≥1 active individual at some time), totalling 73 species for flowering and 76 for fruiting. This 10-subplot threshold reduces instability in occupancy-based phenology estimates for rare or low-occurrence species. However, apparent activity may still be inflated by high local stem density, because locally common species are more likely to be observed and may therefore appear to have longer flowering or fruiting durations than less common species. The difference in the number of species assessed for flowering and fruiting is due to species that do not flower, such as the gymnosperms Agathis robusta and Podocarpus grayae. For the species of Ficus, flowering and fruiting syconia were recorded as fruiting activity. In addition, species that were not recorded with phenological activity at any point in time, either due to uncertainty in identifying phenological activity or due to assessment difficulty from the gondola, were excluded from the analyses. Species were assigned to the abiotic functional group if their seeds were dispersed by wind, water, or gravity (generally dry fruits) and to the biotic functional group if seeds were dispersed by animals (generally fleshy fruits) (Engert et al., 2020). All phenological assessments conducted in this study are summarised in Table 1 for clarity.
2.3 Temporal patterns
We used generalised additive models (GAMs) to identify seasonal and long-term patterns, and to quantify temporal changes in community-wide activity for both biotic and abiotic reproductive phenology (Polansky and Robbins, 2013). We assessed the number of observations with flowering and fruiting activity as a function of fortnight, and fortnight since first observation (time since first observation in fortnights) over the full 15-year period for both biotic and abiotic communities separately. GAMs were utilised as they accommodate non-linear and non-monotonic patterns. We developed the models with a negative binomial family and a log link function. Models were computed using the “mgcv” package in R (Wood, 2017). Residuals were assessed with the “DHARMa” package (Hartig, 2022). Periods of significant increase and decrease in both seasonal and long-term smoothers were then assessed through first derivatives using the package “gratia” (Simpson, 2024). Additionally, we extracted the peak value (maximum monthly number of observations) of flowering and fruiting for each year and calculated the coefficient of variation (CV) values across years of activity for each species. We then compared the CV values between biotically and abiotically dispersed species using one-way ANOVA.
2.4 Seasonality analyses
We assessed the degree of phenological seasonality for communities and species using circular statistics (Morellato et al., 2010). We calculated the mean date (mean angle), circular standard deviation (SD, indicating season length), and mean vector length (r, indicating degree of seasonality) (Morellato et al., 2010). Species were considered seasonal when the Rayleigh test was significant (p<0.05), and r values were above 0.2 to avoid low r values due to a large sample size (Morellato et al., 2010; Valentin-Silva et al., 2018). Mean date was calculated from the fortnightly percentage of activity based on a generalised dispersal mode. To assess whether species exhibited longer seasons depending on seed-dispersal group or season of activity, we used a linear model with season length (in fortnights) as the response variable, and seed-dispersal group, season of activity, and their interaction as explanatory variables. Model residuals were assessed using the “DHARMa” package (Hartig, 2022).
We compared mean dates across years for each group for both flowering and fruiting to investigate if, and how, the mean dates changed over time. For the across-years analysis, we used circular-linear regression analysis, with mean angle as the response variable and year as the independent variable. In circular-linear regression analysis, a negative estimate indicates advancement while a positive estimate indicates delay (Pabon-Moreno et al., 2020). In the regression analysis, we included species that were represented by at least 10 subplot sampling units and presented at least 7 years of observational data. For each species in our analysis, we only used years in which the Rayleigh test indicated significant seasonality (p<0.05). Two circular analyses and two circular-linear regression analysis were conducted, one for flowering and one for fruiting, using the R package “circular” (Agostinelli and Lund, 2023).
For abiotic and biotic flowering and fruiting, we applied a Savitzky–Golay density filter to the time series (Cai et al., 2017) and then extracted the peak of activity for each year. We then calculated the difference, in fortnights, between the peak of flowering and peak of fruiting for each functional group community. Finally, to test if the interval between flowering and fruiting peaks changed over time, which would indicate a shortening or lengthening of fruit development time, we assessed the correlation between the flowering-to-fruiting peak interval and year using Spearman's rank correlation.
2.5 Identifying sub-annual, annual, and supra-annual patterns
We identified species that presented sub-annual, annual, or supra-annual phenological patterns following the approach developed by Newstrom et al. (1994). Species that present sub-annual phenological patterns (including continual) show more than one phenological event per year or continuous activity with a few brief interruptions. Annual species present only one major cycle per year, and supra-annual species present multi-year cycles (when at least 50 % of years presented no activity). To quantitatively confirm the phenological pattern, we used Fourier transform analysis (Chapman et al., 1999; Datta et al., 2025). The median length of the phenological cycle was estimated for all species, with activity recorded in at least 10 subplots over the study period. To perform the Fourier transform analysis, we first applied a Daniell filter to smooth the raw periodogram to an effective bandwidth of around 0.1 (Bush et al., 2017; Datta et al., 2025). Flowering and fruiting cycles were classified as sub-annual if their length was less than or equal to 10 months, annual if it was between 10 and 14 months, and supra-annual if it was greater than or equal to 14 months (Datta et al., 2025). When the Newstrom and Fourier methods did not agree, we considered the more frequent phenological pattern the more likely, and we visually re-examined the time series to confirm this decision. We then compared the percentage of species in each phenological pattern in abiotic and biotic communities for both flowering and fruiting using a chi-square (χ2) test.
2.6 Functional traits and phylogenetic signal
We assessed whether the probability of a species exhibiting supra-annual periodicity was linked to particular functional traits, including sexual system (binary as 1 for dioecious, 0 for monoecious/hermaphrodite), tree height (m), seed size (mm), seed-dispersal mode (binary as 1 biotic, 0 abiotic), δ13C (a proxy for water-use efficiency), SLA, and wood density as the independent variables. Species sexual systems were extracted from Gross (2005), and Russell-Smith and Lee (1992). Other traits were extracted from AusTraits (Falster et al., 2021). We postulated that supra-annual species, requiring a rapid recharge of plant resources post reproduction, would rely on high carbon gain between reproductive events and therefore would present lower wood density, more negative leaf δ13C (lower intrinsic water-use efficiency), and higher SLA (thinner leaves). We also expected supra-annual species to be taller and more common among abiotically dispersed species. While comparable studies are limited, Qin and Yi (2024) reported in their analysis of a global dataset that taller tree height was associated with higher mast seeding intensity, with a stronger effect among wind-pollinated species. We expected that supra-annual flowering or fruiting could be more common in canopy species (Kang and Bawa, 2003) represented by higher maximum height, as these species would benefit from large, visually conspicuous displays and have more storage capacity. In addition, we expected supra-annual species to show greater seed size as larger seeds can take longer to produce and mature. To carry out this assessment, we used logistic regressions (one for flowering and one for fruiting), with species presenting supra-annual patterns given a value of 1 and other patterns given a value of 0. Logistic regression was conducted using the package “glmmTMB” in R with a binomial family and logit link function (Brooks et al., 2017; McGillycuddy et al., 2024). Collinearity was assessed using variance inflation factors (VIFs) calculated with the R package “car” (Fox and Weisberg, 2019), and model residuals were assessed with the R package “DHARMa” (Hartig, 2022).
Further, we tested whether the presence of the supra-annual periodicity had a significant phylogenetic signal across species. To carry out this analysis, we generated the community phylogeny using the package V.PhyloMaker (Jin and Qian, 2019), using the largest dated vascular plant backbone GBOTB.extended, assembled from seed (Smith and Brown, 2018) and angiosperm (Zanne et al., 2014) metaphylogenies of all families of extant vascular plants, which includes 74 531 species. Because this vascular plant backbone tree is dated, we did not carry out further time calibration in our analysis. Using the single community phylogenetic tree (operational regional pool; n=81 species), we assessed the phylogenetic signal for each phenophase separately using the Fritz and Purvis' D statistic, implemented with phylo.d (permut = 1000) from package “caper” (Orme et al., 2023). We resolved community polytomies using fix.poly from package “RRphylo” (Castiglione et al., 2020). For each phenophase, tips lacking trait data were pruned prior to analysis, using 73 and 76 species for flowering and fruiting, respectively. We built 10 fully resolved phylogenetic trees for flowering and fruiting, and tested for the phylogenetic signal in each. We then calculated and reported the result distribution (median and 95 % confidence interval) of the 10 phylogenetic test results.
2.7 Phenological calendar
Finally, we constructed a phenological calendar for each of the studied species, presenting their overall phenological pattern (sub-annual, annual, or supra-annual), type of seed dispersal (biotic or abiotic), coefficient of variation in activity across years, season of activity, and mean date of activity (month) (Table S1). We also added whether the timing of activity of a species was changing through time, and, if so, the direction of the change (advancing or delaying) (Table S1). The intent of providing a phenological calendar for each species was to aid future scientific research on species in the Wet Tropics and to provide baseline information on timing for seed collection as well as information for restoration ecology.
3.1 Community-level temporal patterns
For flowering and fruiting, in the biotic and abiotic groups, we modelled the seasonality (smoother fortnight of the year) and the long-term trend (smoother fortnight of study); both smoothers were significant for each dispersal group (Fig. 1). Plots of modelled predictions against observations showed that each of the model predictions aligned closely with the observational data (Fig. S1). The explanatory power of the models (R2) was moderate to high: 0.43 for abiotic flowering, 0.57 for biotic flowering, 0.62 for abiotic fruiting, and 0.56 for biotic fruiting.
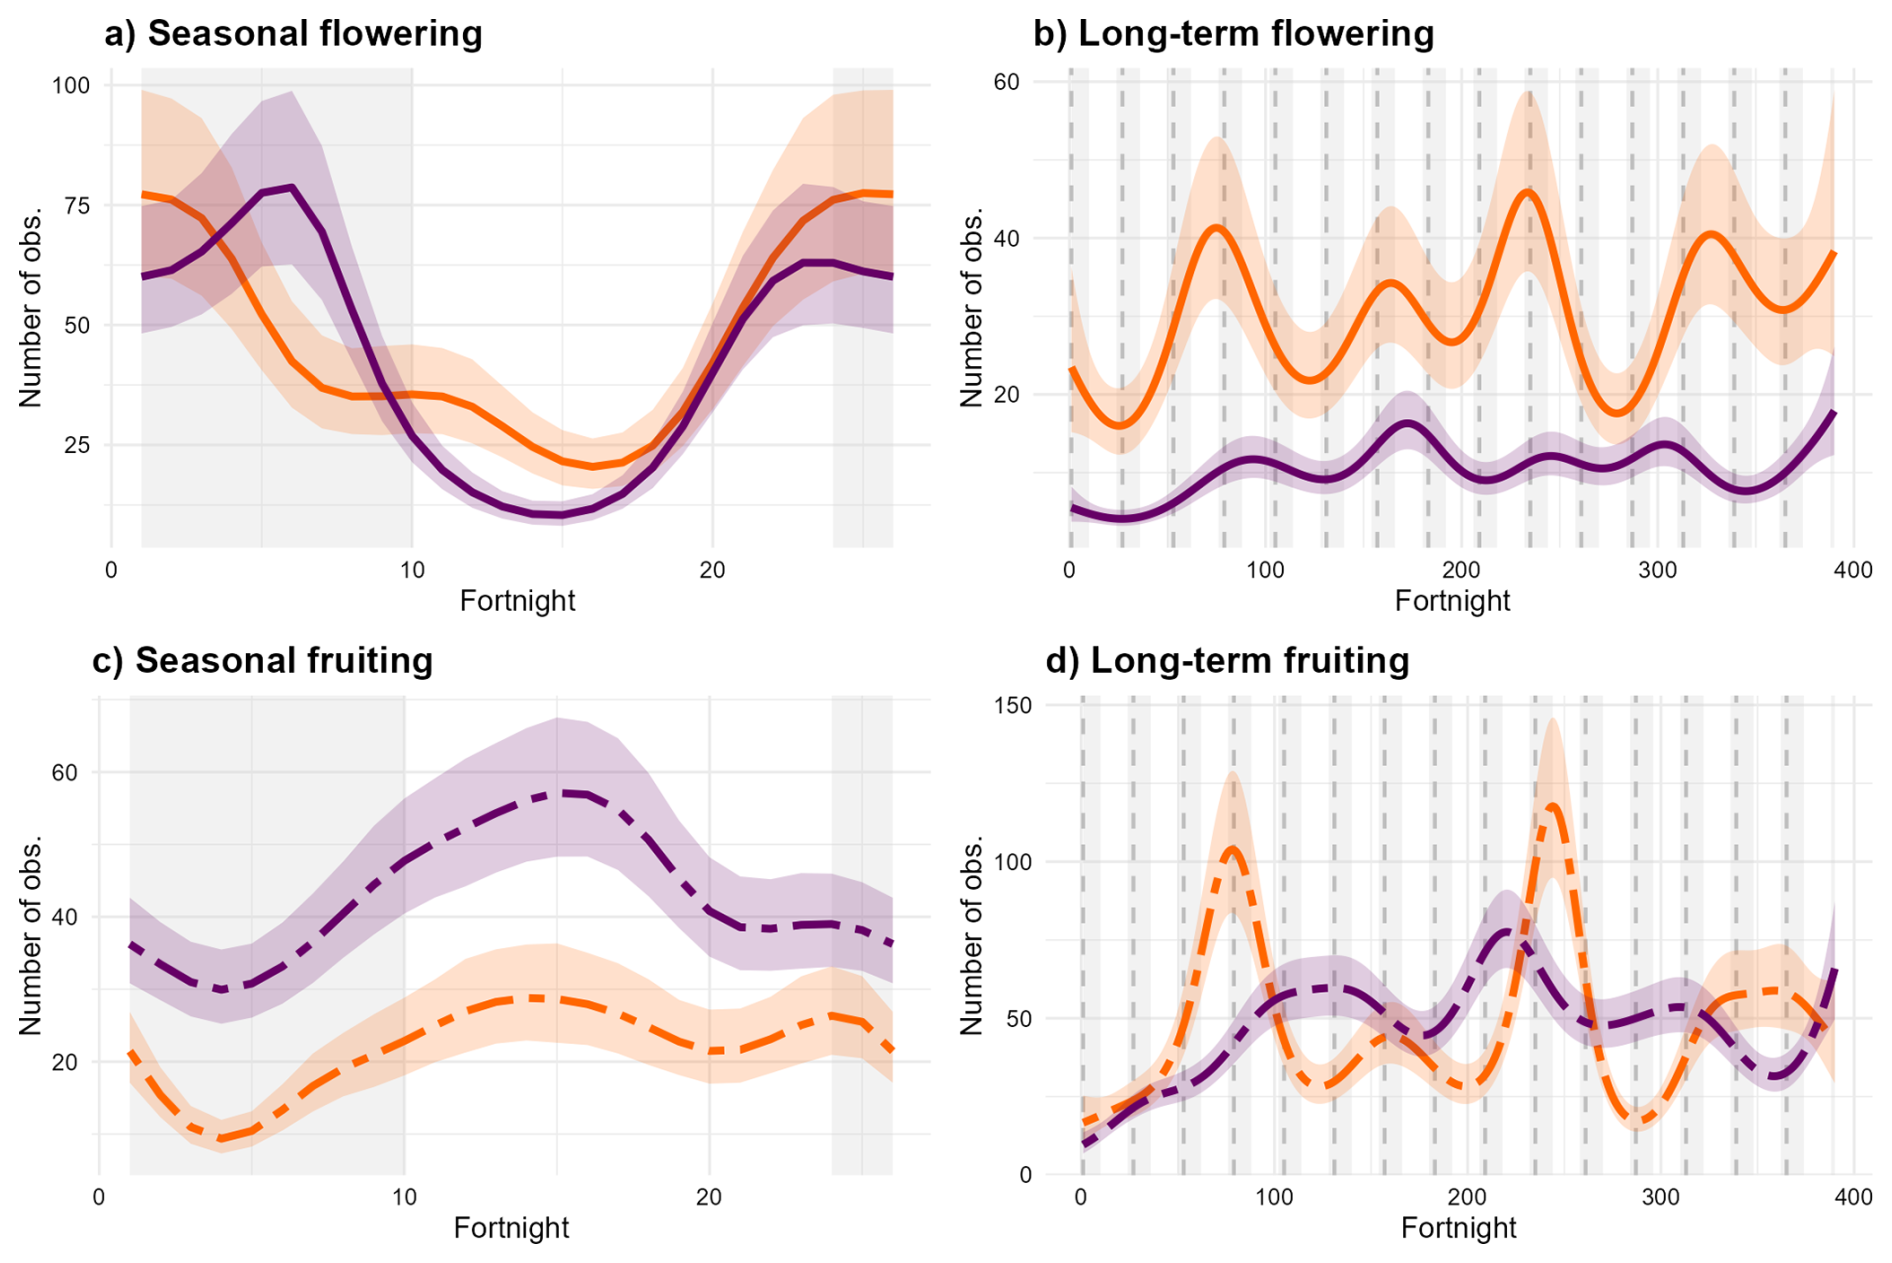
Figure 1Marginal effects of fitted GAMs to (a) seasonal and (b) long-term abiotic (orange) and biotic (purple) flowering, (c) seasonal and (d) long-term abiotic (orange) and biotic (purple) fruiting (dashed line) at the Skyrail rainforest site fortnightly from January 2000 to December 2014. Shades indicate 95 % confidence interval. Light-grey areas indicate wet season and dashed vertical lines the beginning of each year.
GAMs indicated that flowering across the community peaked at around the beginning and end of the wet season in both biotic and abiotic groups, with the abiotic species peaking earlier than the biotic species. The primary abiotic peak occurred in December, whereas the primary biotic peak occurred in March (Figs. 1a, S2a, b). Across years, flowering varied considerably in both groups. In the abiotic group, long-term peaks occurred in March 2002, May 2006, December 2008, August 2012, and December 2014. In the biotic group, long-term peaks occurred in September 2003, September 2006, June 2009, September 2011, and December 2014 (Figs. 1b, S2c).
GAMs indicated that fruiting activity in both biotic and abiotic groups was concentrated in the dry season. Seasonal fruiting in the abiotic group showed a major peak in July and a secondary peak in December, whereas the biotic group peaked in August (Figs. 1c, S2a, b). Across years, long-term abiotic fruiting peaked in December 2000, February 2006, May 2009, and December 2013, whereas long-term biotic fruiting peaked in February 2005, June 2008, December 2011, and December 2014 (Figs. 1d, S2c,d).
3.2 Species-level temporal patterns
We found that the majority of the species exhibited significant seasonality in both flowering and fruiting phenology. Of the 72 species with enough data to be analysed with circular statistics for flowering, 63 (87.5 %) of the species presented high seasonality (r vector ≥ 0.7); and out of the 59 species with enough data to be analysed for fruiting, 29 (49.2 %) presented high seasonality (r vector ≥ 0.7). Annual coefficient of variation (CV) was not significantly different between abiotic and biotic species as per ANOVA (abiotic = 0.92 ± 0.126, biotic = 1.18 ± 0.117). At the species level, there was no clear distinction in the seasons of flowering and fruiting between seed-dispersal type, which led to flower and fruit availability throughout the year (Fig. 2). The majority of species (>50 % species) in the abiotic community had mean flowering dates in April (23 %), June (13 %), October (10 %), and November (10 %), with fruiting mean dates in July (22 %), September (17 %), and November (13 %) (Table S1). Meanwhile, species in the biotic community had mean flowering dates in January (14 %), March (14 %), October (14 %), and November (12 %), and had mean fruiting dates in May (18 %), September (13 %), October (13 %), and November (10 %) (Table S1). Seasonality was significant in 61 of the studied species (83.6 %) for flowering and in 50 of the species for fruiting (65.8 %) (Rayleigh test, p<0.05, r value > 0.2). Species with no significant seasonality in flowering were Alphitonia petriei, Cryptocarya hypospodia, Dysoxylum gaudichaudianum, Dysoxylum papuanum, Emmenosperma cunninghamii, Grevillea baileyana, Litsea leefeana, Neonauclea gordoniana, Pseudoweinmannia lachnocarpa, Sloanea australis, and Syzygium luehmannii. Species with no significant seasonality in fruiting were Alphitonia petriei, Dysoxylum gaudichaudianum, Dysoxylum papuanum, Emmenosperma cunninghamii, Ficus destruens, Ficus virens, Neonauclea gordoniana, Sloanea australis, and Syzygium luehmannii (Table S1). Of the species without significant seasonality in fruiting, only one species used abiotic seed dispersal. The length of activity was not significantly different among dispersal groups and seasons for flowering but was significantly lower in the wet season for fruiting (F value = 5.3448, p<0.05, Fig. S2).
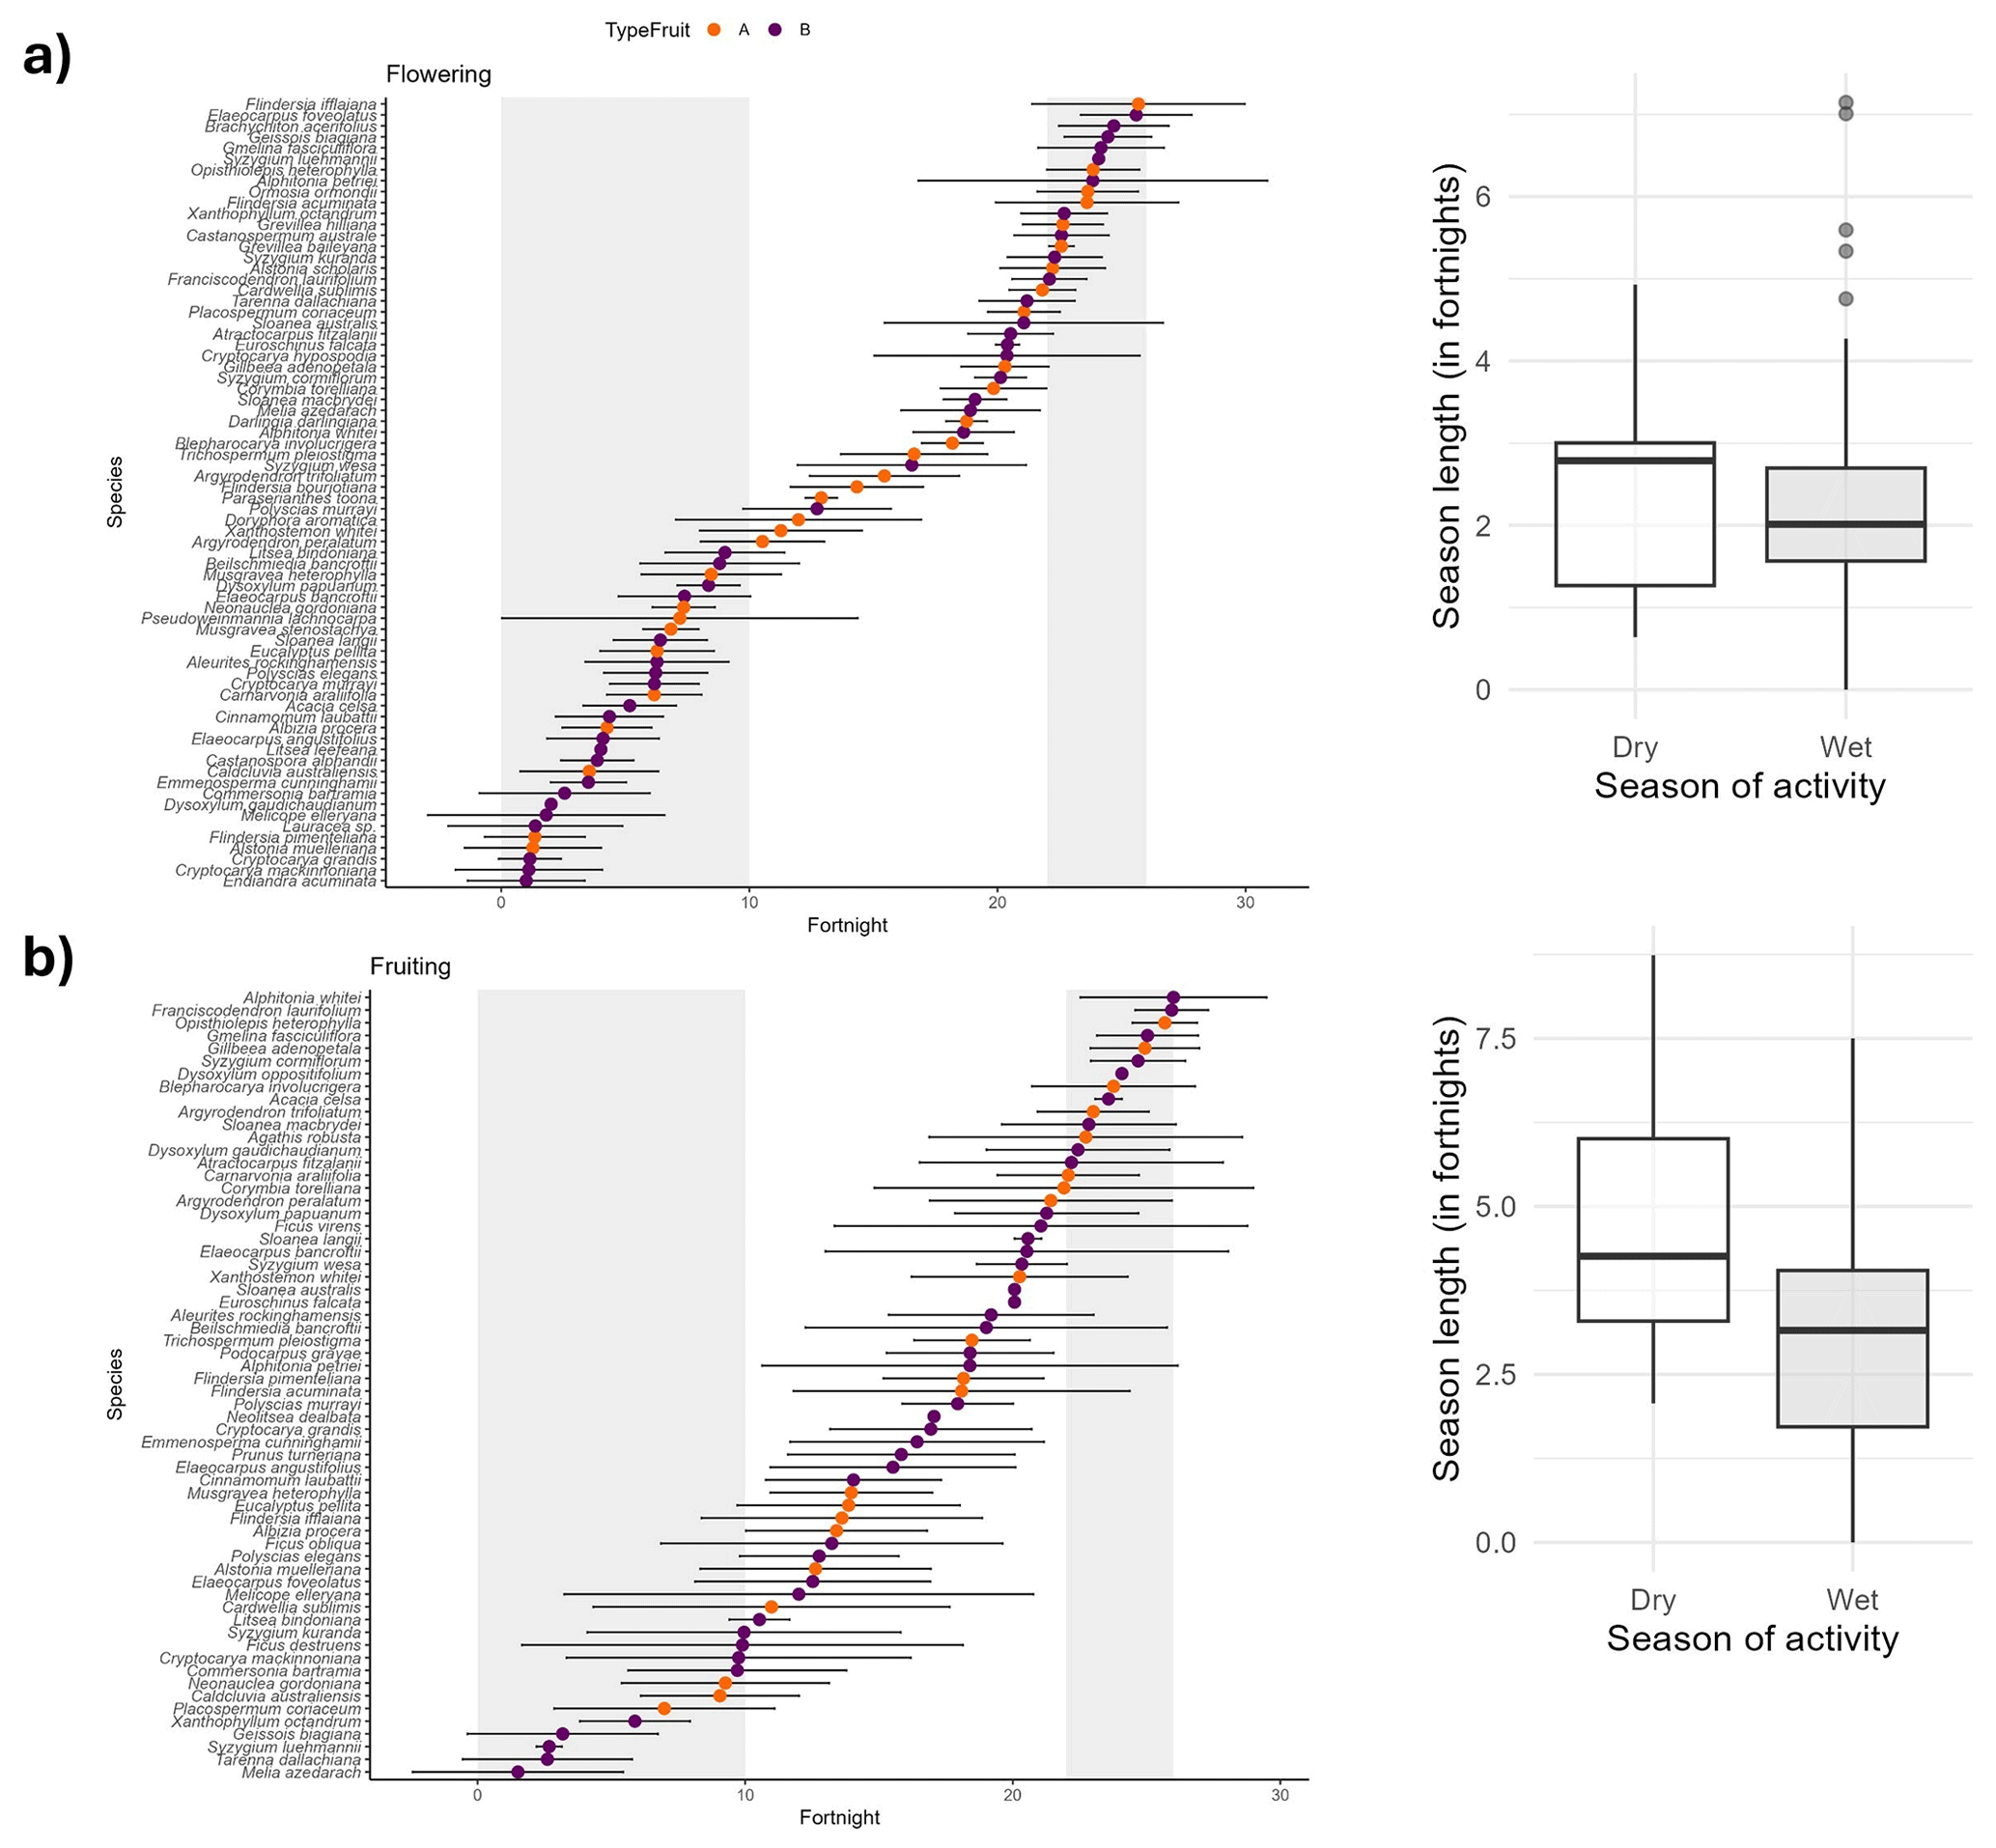
Figure 2Mean dates across all studied years (fortnight with mean (a) flowering and (b) fruiting activity across all years) for each abiotic (A, orange) and biotic (B, purple) species at the Skyrail rainforest site. Plot shows circular mean date and circular standard deviation. Light-grey areas indicate the extent of the wet season. Boxplots on the right show the season length (using circular SD as a proxy) in fortnights for species that flower and fruit in the dry (white) and the wet (light grey) season. Significant differences were found only for fruiting. Seed dispersal was not significant in the model.
3.3 Changes in seasonality
In total, 56 species had sufficient data to assess timing change in flowering and/or fruiting. We found that 13 species had advanced flowering (27.1 %), 7 species indicated delayed flowering (14.6 %), and 28 showed no significant change (58.3 %) (Fig. 3, Table S1). Analysis of timing shifts in fruiting demonstrated 13 species advanced fruiting (43.3 %), 4 delayed fruiting (13.3 %), and 13 species showed no significant change (43.3 %) (Fig. 3, Table S1). Among the 23 species assessed concomitantly for both flowering and fruiting, 5 (21.7 %) showed advances in both flowering and fruiting, 7 (30.4 %) presented no changes in either phenophase, and 11 (47.8 %) presented opposite directions of timing change or phenophase-specific change (i.e. flowering advancing but fruiting delaying, flowering delaying and fruiting advancing, or change in only one phenophase). When comparing the proportion of species presenting changes to timing between biotic and abiotic communities (whether they advanced or delayed, or if no change was found), we found no significant difference between biotic and abiotic for flowering, but more biotically dispersed species were advancing and delaying activity for fruiting (chi-squared test χ2=57.19, p<0.0001).
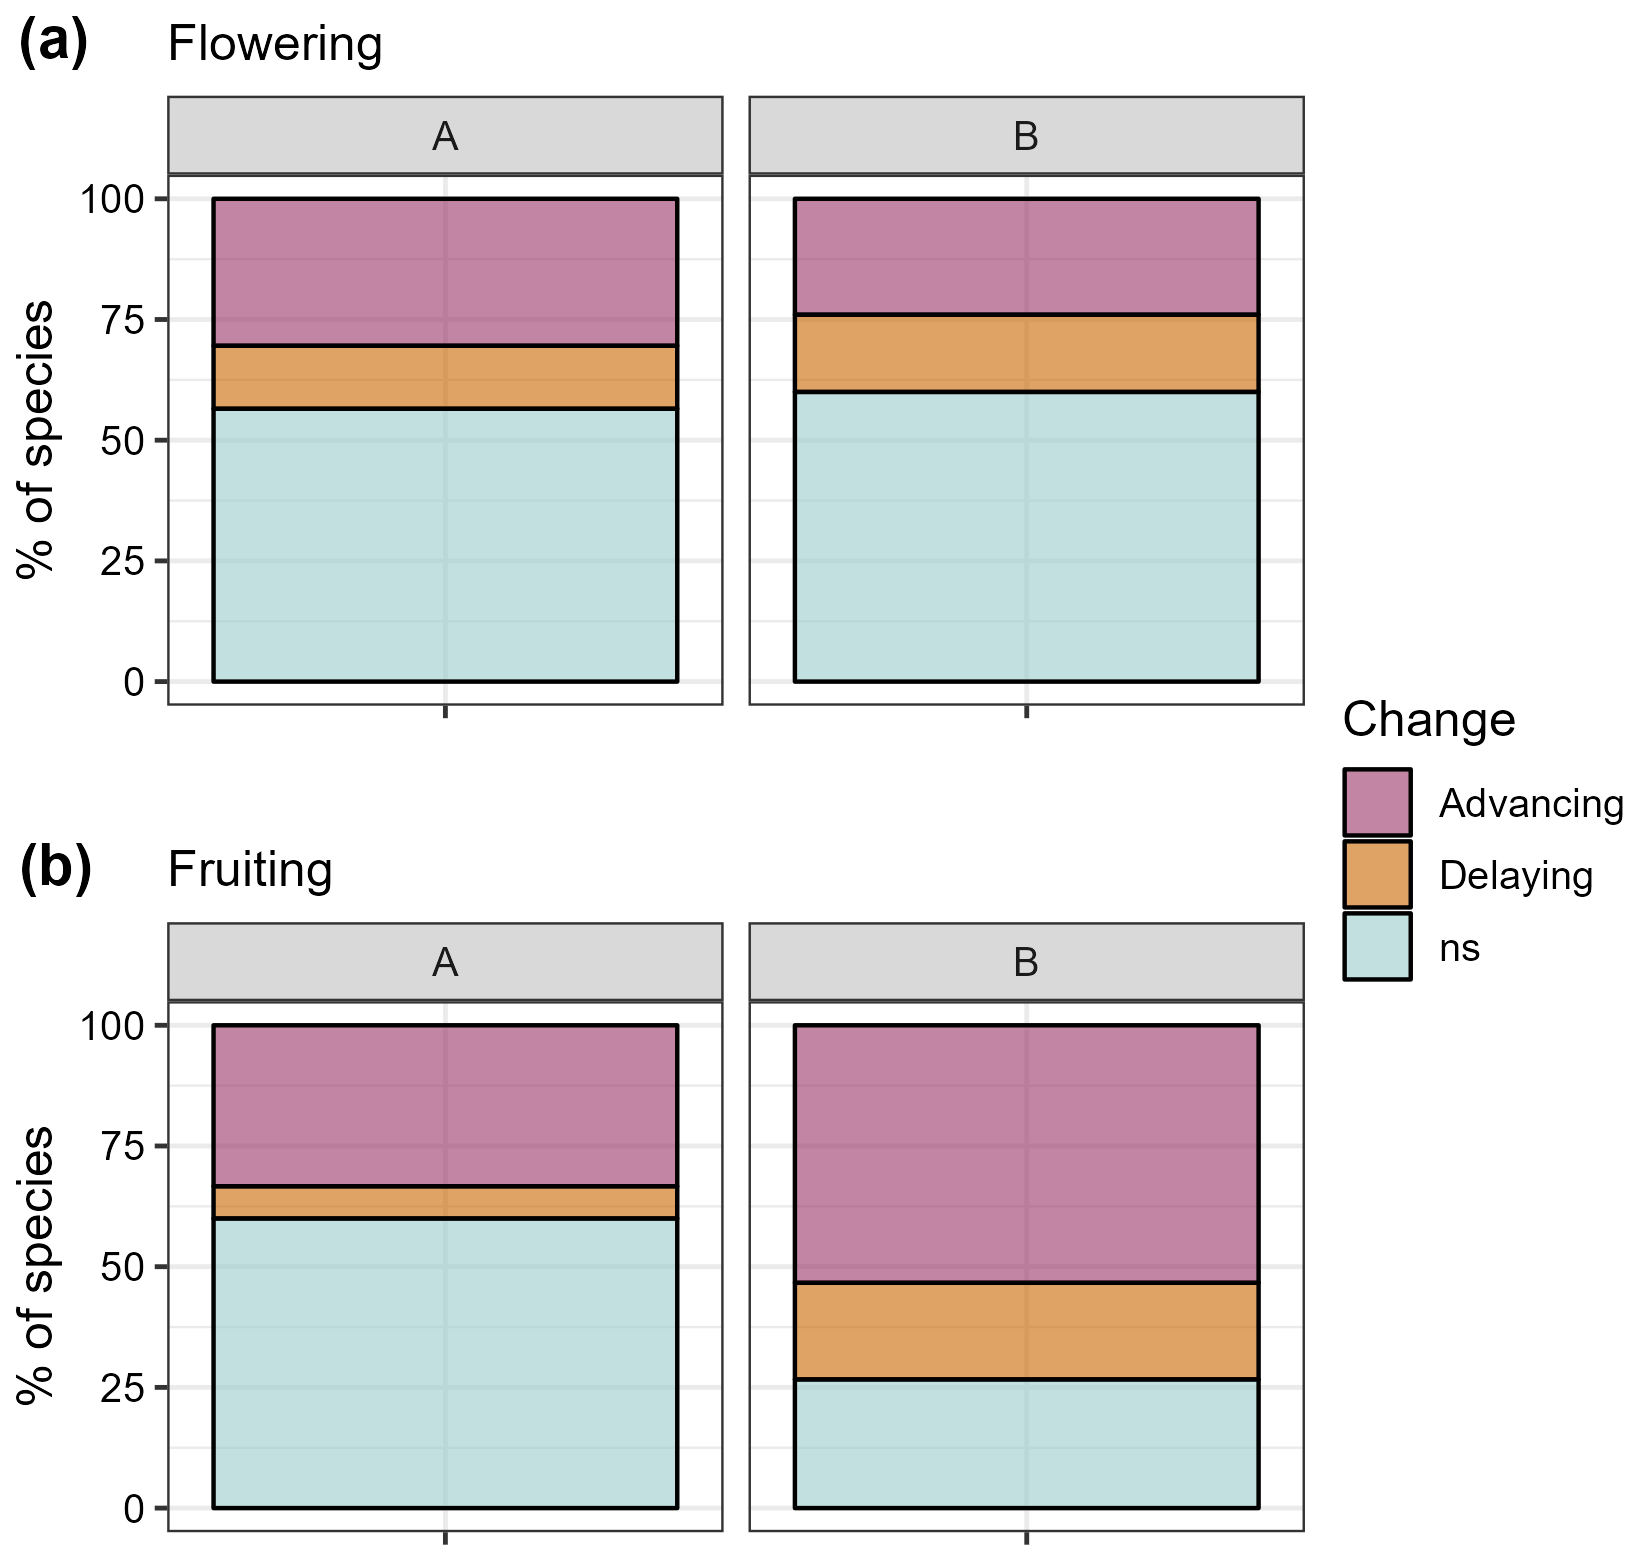
Figure 3Percentage of abiotic (A) and biotic (B) species advancing, delaying, and with no changes in (a) flowering and (b) fruiting patterns at the Skyrail rainforest site. No significant difference was found between biotic and abiotic groups for flowering but they were significantly different for fruiting.
When assessing changes in peak-to-peak dates over the study period, results varied between dispersal methods and reproductive phases. For the biotic group, the peak-to-peak lag between flowering and fruiting declined over time (R2=0.28, p=0.051) (Fig. 4), indicating that the interval between flowering and fruiting was decreasing. Conversely, for the abiotic group, there was no significant change in the peak-to-peak lag through time.
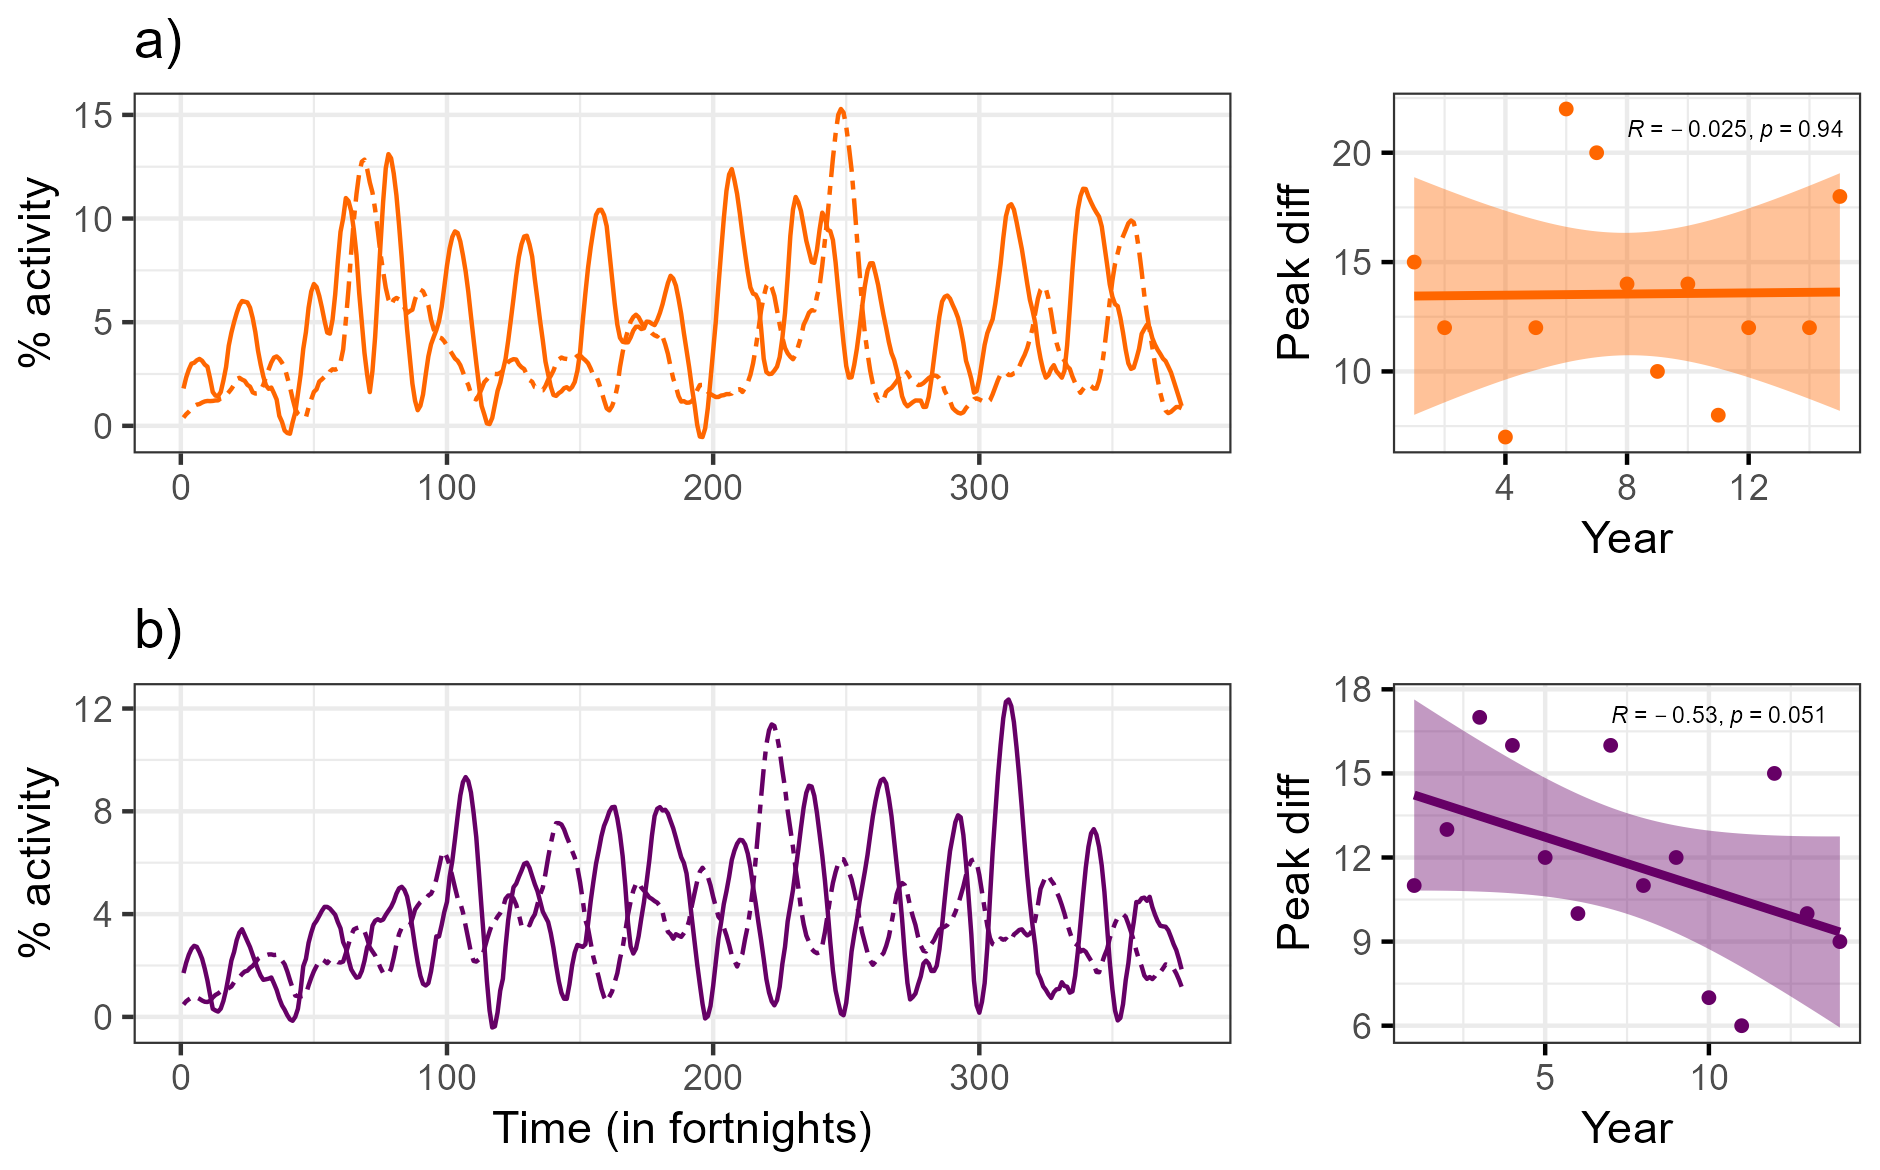
Figure 4Differences in flowering (solid line) and fruiting (dashed line) peaks across all studied years at the Skyrail rainforest site for (a) abiotic (orange) and (b) biotic (purple) functional groups. No significant changes were found for the abiotic group, but the interval between peak flowering and peak fruiting was found to be decreasing through time for the biotic group as per Spearman's correlation. The shaded areas on the correlation plots indicate a 95 % confidence interval, % activity refers to relative community activity.
3.4 Phenological patterns
Overall, flowering was dominated by annual patterns, while fruiting was dominated by supra-annual patterns. Out of the 73 species analysed for flowering, 42 displayed an annual flowering pattern (57.5 %), 26 were supra-annual (35.6 %), and 5 were sub-annual (6.9 %). Of the 76 species analysed for fruiting, 41 were annual (53.9 %), 28 supra-annual (36.8 %), and 7 were sub-annual (9.2 %) (Fig. 5a). Annual flowering was most common in both seed-dispersal groups – abiotic (70 % of the species) and biotic (48.8 %). In contrast, supra-annual fruiting was dominant in both the abiotic (55.3 %) and biotic (51.7 %) groups (Fig. 5b, c). Although the fruiting patterns were similar across groups, supra-annual flowering was more prevalent in the biotic group (44.2 %) than in the abiotic group (23.3 %).
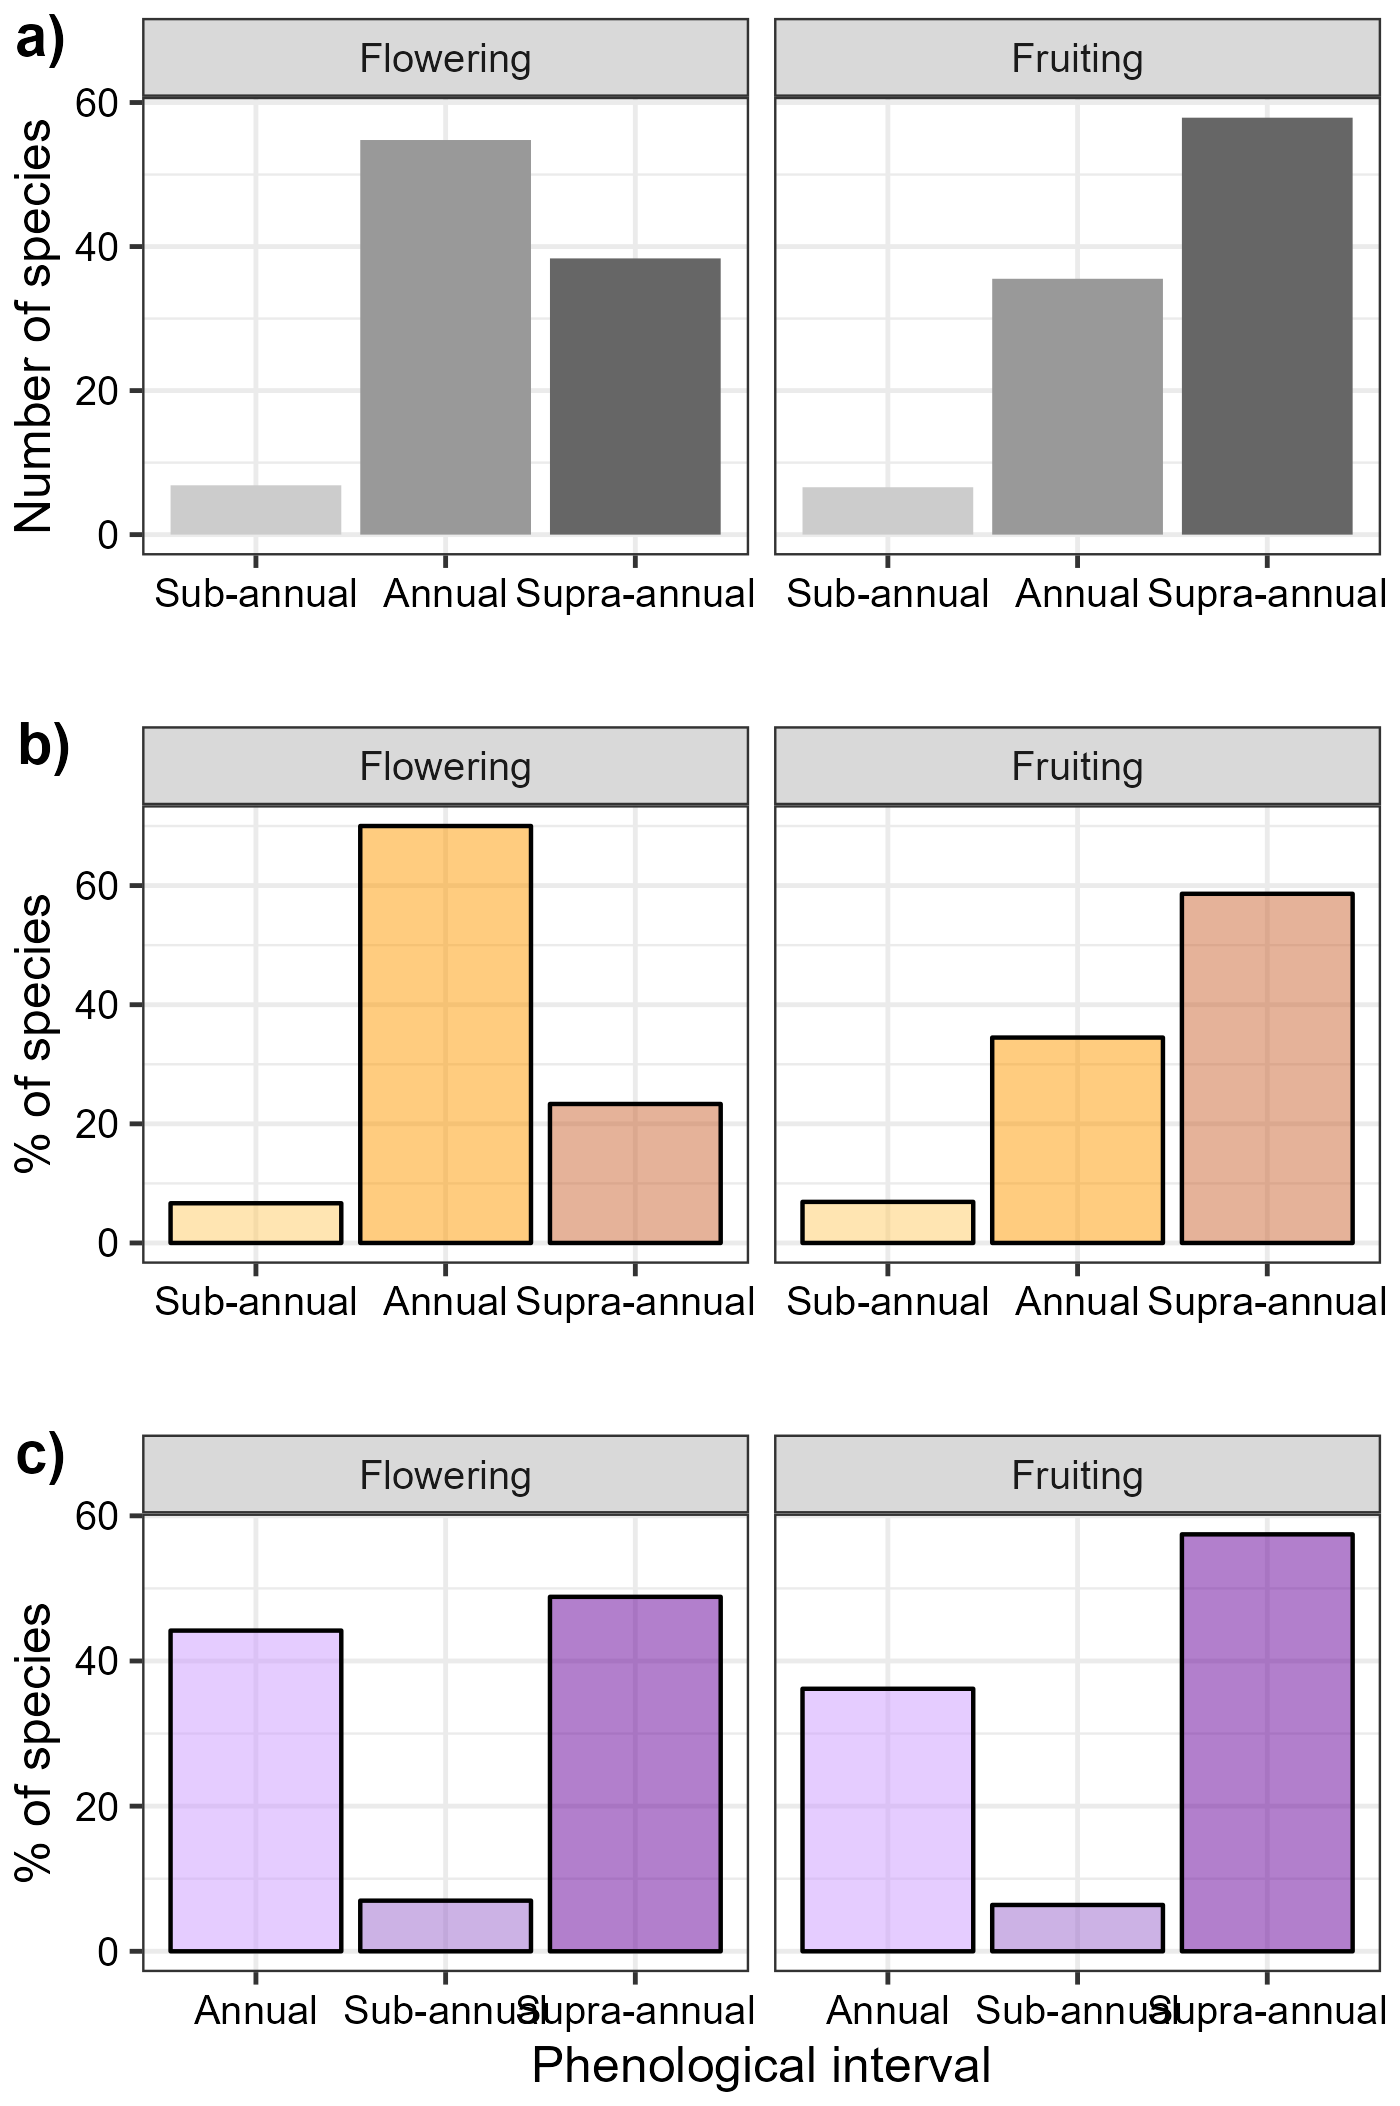
Figure 5(a) Number of species classified as sub-annual, annual, and supra-annual for flowering and fruiting at the community level; and percentage of species in each category for the (b) abiotic and (c) biotic functional groups at the Skyrail rainforest site.
3.5 Supra-annual patterns, functional traits, and phylogenetic signals
The logistic regression testing for the influence of functional traits on the probability of supra-annual pattern identified the type of seed dispersal (biotic vs abiotic) as a predictor of increased probability of supra-annual flowering activity (z=2.083, p<0.05), with increased probability of supra-annual flowering occurring in biotic species (Fig. 6a, Table S2). Seed size (mm) was found to be the best predictor of increased probability of supra-annual fruiting activity (z value = 2.3, p<0.05), while δ13C was marginally significant (, p=0.07) (Fig. 6b, c, Table S2). No other functional trait was associated with the probability of a species presenting supra-annual flowering or fruiting. Because the subplot-based presence/absence approach may be influenced by local stem density, we tested whether species density differed among reproductive interval classes using a generalized linear model (GLM). Species density did not differ among annual, sub-annual, and supra-annual classes, suggesting that local density effects did not strongly influence the reproductive interval classification (Fig. S3).
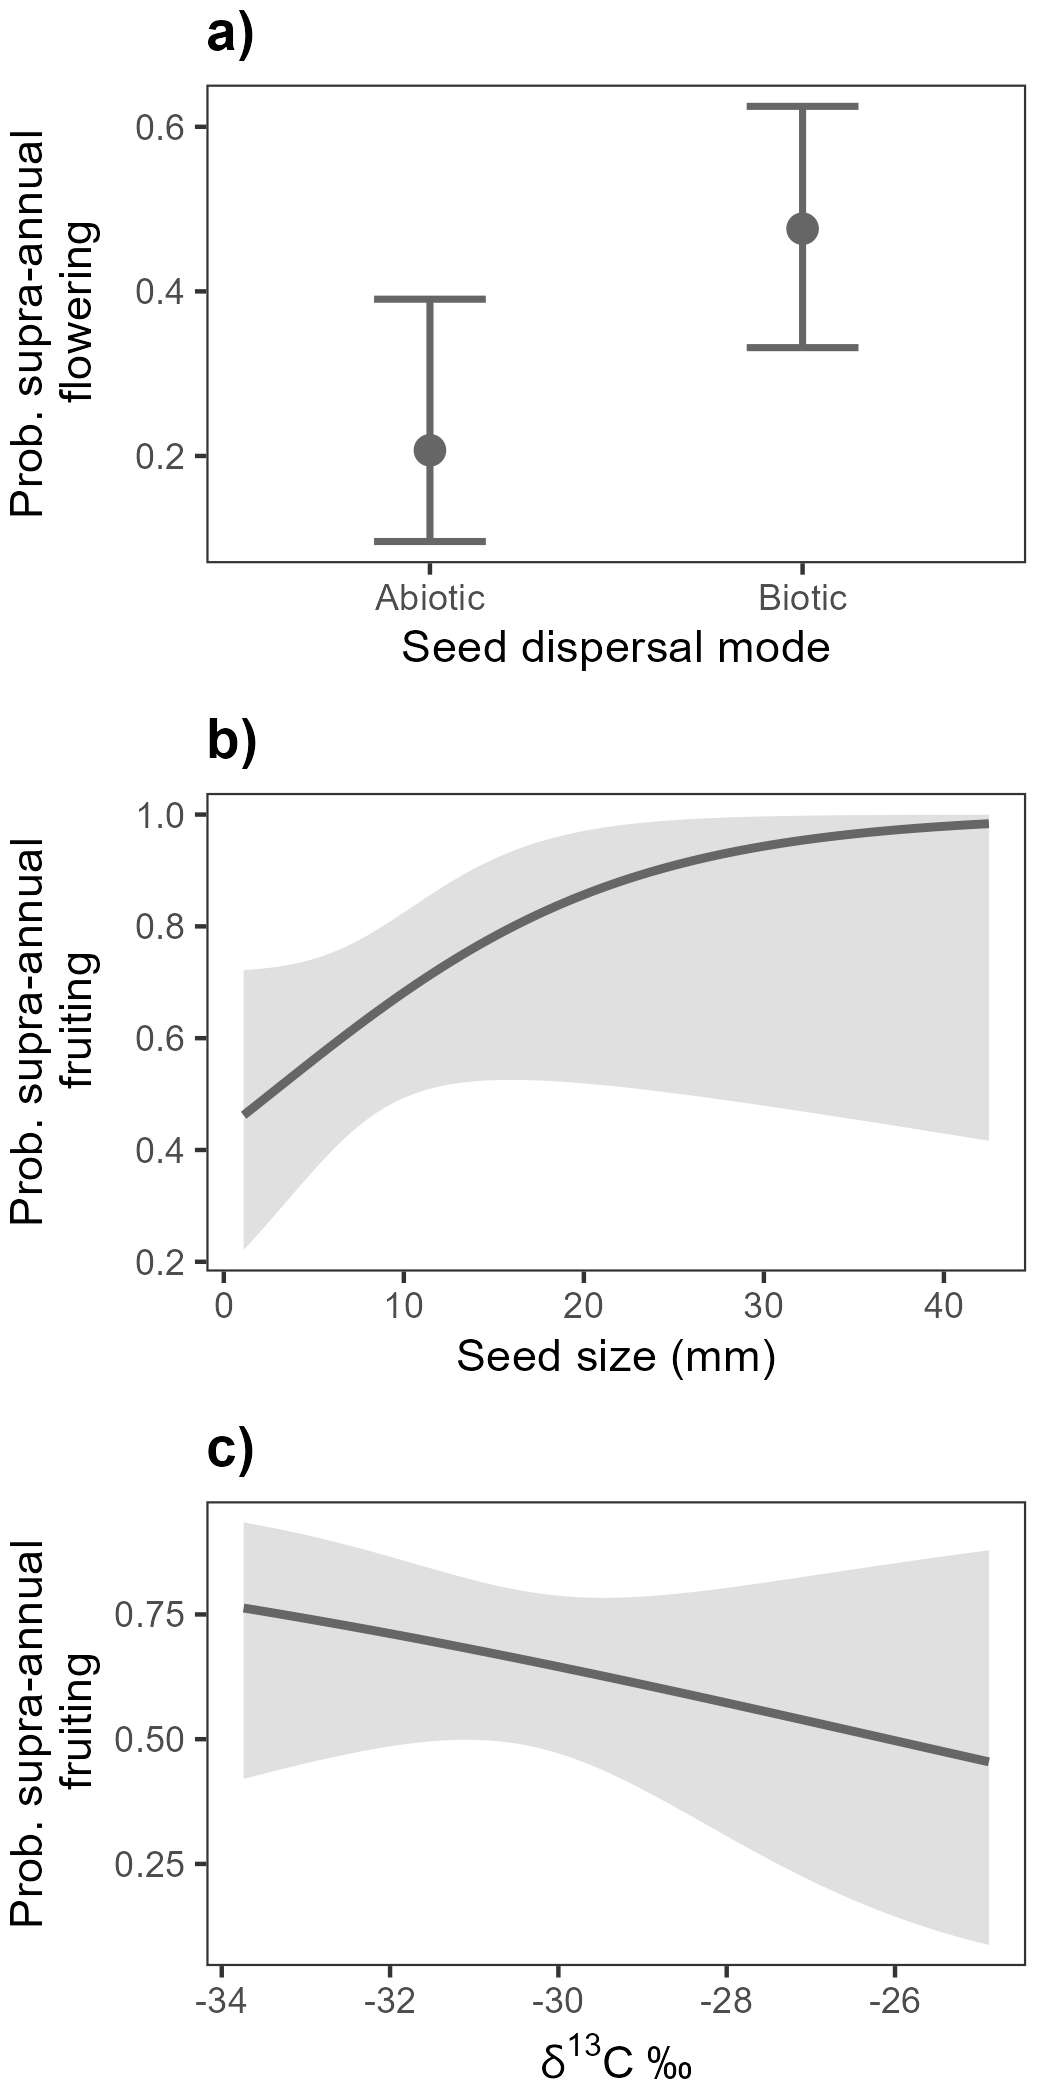
Figure 6Logistic regression showing relationship between probability of supra-annual activity for (a) flowering and seed-dispersal type, (b) fruiting and seed size (mm), and (c) fruiting and δ13C at the Skyrail rainforest site. The shaded areas indicate a 95 % confidence interval.
Supra-annual fruiting showed a significant low to moderate phylogenetic signal (D=0.677 ± 0.022 (median ± 95 % CI); P random = 0.036 ± 0.011 (median ± 95 % CI); P Brownian = 0.001 ± 0.001 (median ± 95 % CI)). For supra-annual flowering, there was no evidence of phylogenetic structure (D=0.889 ± 0.021 (median ± 95 % CI) P random = 0.261 ± 0.035 (median ± 95 % CI); P Brownian < 0.001). Species exhibiting supra-annual fruiting were concentrated within the orders Laurales and Proteales (Fig. 7).
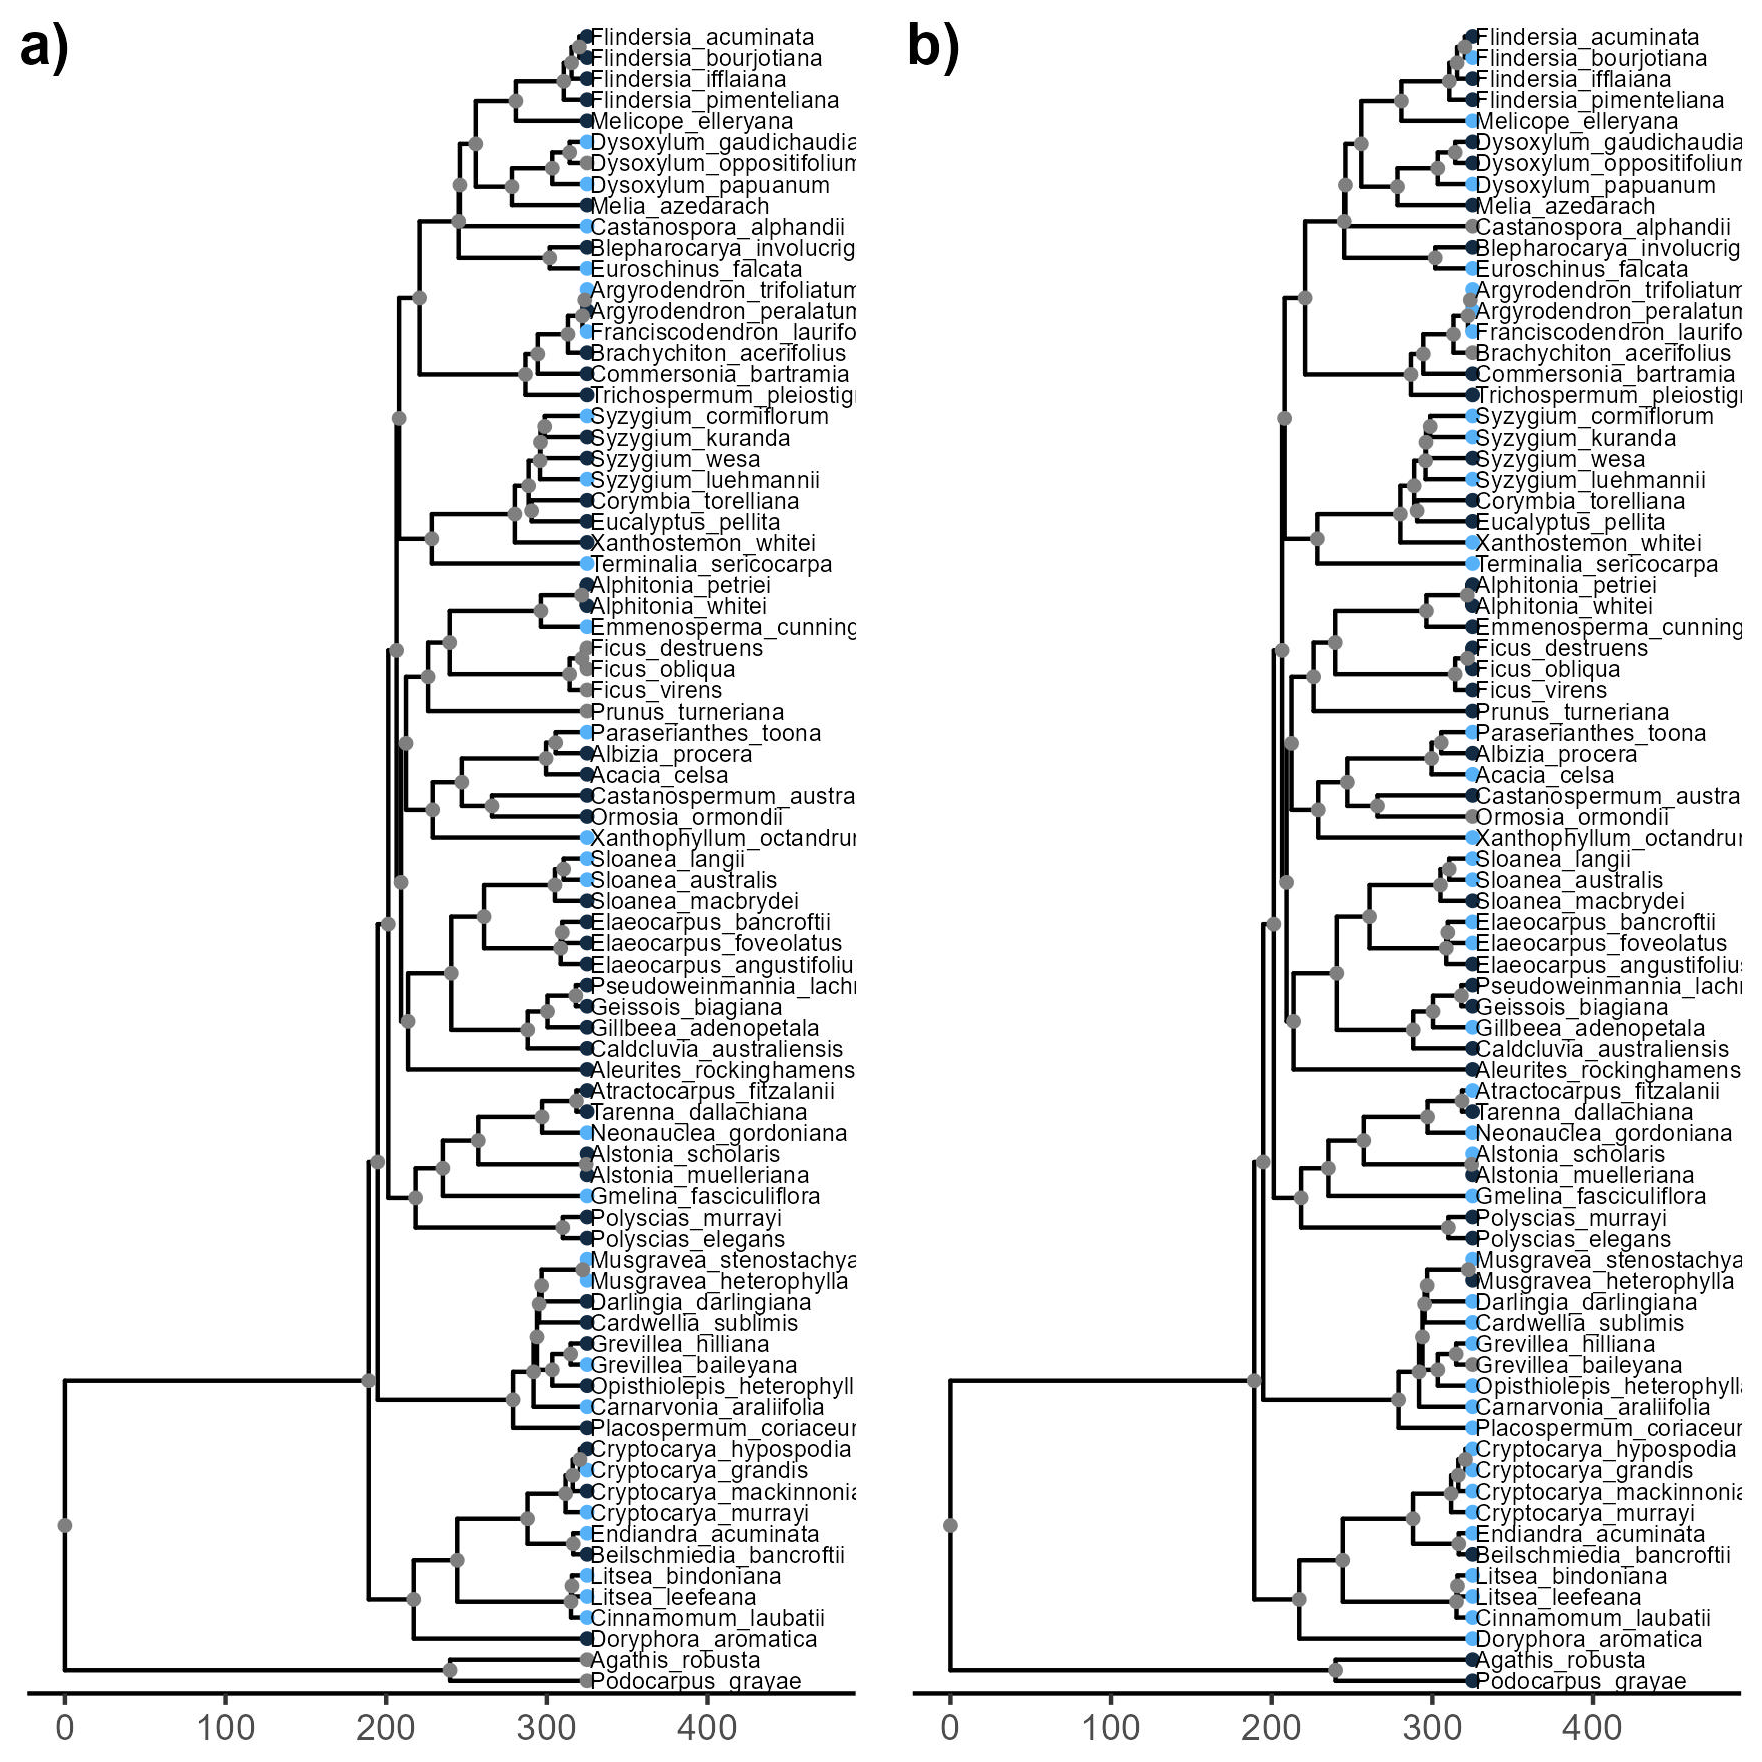
Figure 7Phylogenetic tree showing species with supra-annual (a) flowering and (b) fruiting at the Skyrail rainforest site. Supra-annual activity is shown as light-blue points, while annual or sub-annual are shown as dark-blue points. Grey dots indicate phenological information not available.
3.6 Phenological calendar
We present a phenological calendar for the 81 study species in Table S1. Of these species, 50 (61.7 %) are biotically dispersed and 31 (38.3 %) are abiotically dispersed. For each species, the calendar summarises the phenological pattern (sub-annual, annual, or supra-annual), seed-dispersal type, coefficient of variation in activity across years, mean date of activity, season of activity, and any change in timing over the study period.
We analysed 15 years of field-collected tree phenology data from a lowland tropical rainforest in the Australian Wet Tropics to assess seasonal, inter-annual, and species-level variation in reproductive timing. We examined patterns at both the community and species level, comparing biotic and abiotic dispersal groups. Flowering was strongly seasonal, peaking in the wet season, while fruiting showed weaker seasonality and generally peaked in the dry season. Despite these seasonal trends, fleshy fruits occurred year-round due to the large number of species involved and the amount of variability in the timing of fruiting. Long-term dynamics showed years of increased flowering and fruiting, and changes in the timing of flowering and particularly fruiting in the community. Changes in supra-annual fruiting activity varied between biotic and abiotic groups, suggesting long-term reproductive dynamics differ with dispersal mode. Taken together, these findings indicate the importance of long-term, species-level phenological monitoring for tracking changes in forest reproduction. For land managers, these data may help to anticipate future consequences for plant–animal interactions and assist in restoration and conservation efforts in the Wet Tropics. To support these applications, we provide a phenological calendar for the 81 studied species.
4.1 Seasonality
Flowering activity in the abiotic group and peak flowering dates for both abiotic and biotic groups were concentrated in the wet season. A similar pattern occurs in the Brazilian Atlantic rainforest (Morellato et al., 2010; Talora and Morellato, 2000; Cardoso et al., 2019), a region that shares similar latitude, seasonality, and rainfall patterns with the Wet Tropics. In both regions, climate is strongly influenced by proximity to the ocean and steep coastal topography (Metcalfe and Ford, 2008; Kamino et al., 2019). Wet season flowering may align with higher pollinator activity, higher levels of rainfall and temperature that can speed up litter decomposition and increase nutrient cycling (Pau et al., 2013). In the Australian Wet Tropics, a herbarium-based study reported tree flowering concentrated at the transition from late dry season to early wet season (Boulter et al., 2006), a period thought to benefit pollinators as day length and temperatures rise before heavy rains commence. Our results partially support this pattern: flowering of abiotically dispersed species peaks in the late dry to early wet season (December) whereas flowering of biotically dispersed species peaks in the late wet season (March).
Fruiting peaks were less sharply defined than flowering and were concentrated in the dry season. This reduced seasonality may be due to our observational definition of fruiting, which includes fruit development and may therefore broaden the inferred fruiting period. The differences in flowering timing for biotic vs abiotic groups, and dry season fruiting across both groups suggests different requirements for fruit production, seed establishment, and development. In wet forests, light – rather than water – may limit fruiting activity (van Schaik et al., 1993) as trees still have access to water in the drier months and may benefit photosynthetically from higher solar irradiance (Zimmerman et al., 2007). A study of the endemic black palm, Normanbya normanbyi, in the Daintree Rainforest of the Wet Tropics bioregion reported dry season fruiting (Vogado et al., 2020), consistent with our results. Wind-dispersed species are often reported to fruit during windy periods that facilitate seed dispersal, although exceptions may occur (van Schaik et al., 1993). In Cairns, September is the windiest month, overlapping to an extent with our dry season fruiting peak.
Edwards et al. (2018) reported a wet season increase in pooled flower and fruit litter in the Daintree Rainforest, but their methods did not permit a separation of floral and fruiting components. A more recent Wet Tropics study found wet season flowering and dry season fruiting of the tree community in the Daintree Rainforest (Vogado et al., 2023). Taken together, these findings confirm that the community patterns we have observed on the Skyrail transect are broadly consistent with the phenology characteristics of humid lowland forests in the Wet Tropics bioregion.
At the Skyrail site, lianas exhibit clear seasonality, with peak flowering in October and peak fruiting in January (Vogado et al., 2022). These peaks differ from those of the tree community, indicating asynchrony between lianas and trees in reproductive timing at the site. Similar temporal partitioning between lianas and their host trees has been reported in other forests (Morellato and Leitao-Filho, 1996; Cortes-Flores et al., 2016).
Although the community phenology at Skyrail is seasonal, species-level patterns indicate year-round resource availability. At the community level, flowering activity was concentrated in the wet season, whereas species-level patterns showed that many abiotically dispersed species flowered and fruited in the dry season. Species-level phenology, therefore, is essential to pinpoint which resources are available and when, since species patterns that are providing resources may be hidden when phenology is assessed at the community level. Because most plants in the Wet Tropics rely on animals for seed dispersal (Westcott et al., 2009; Engert et al., 2020), documenting species-level phenology is crucial for understanding the resource continuity that underpins ecosystem processes (Jordano, 1995). Fleshy fruits were available year-round at our study site, which is consistent with frugivore-mediated selection for complementary fruiting that has been documented in other tropical forests (van Schaik et al., 1993; Wright and van Schaik, 1994; Morellato et al., 2000).
The interval between peak flowering and peak fruiting decreased through time in the biotic group but showed no detectable change in the abiotic group. Species-level timing analyses indicated that the majority of biotic species were advancing fruiting activity, while flowering showed only minor changes in the timing of peak flowering. Taken together, these results suggest that the decrease in the interval between the flowering and fruiting peaks is driven primarily by earlier fruiting rather than shifts in the timing of flowering. One plausible explanation is a shorter period of fruit development in biotically dispersed species, particularly those producing fleshy fruits. Several non-exclusive mechanisms could account for advancing fruiting activity, including changes in pollinator activity (Forrest, 2015), shifts in environmental drivers of fruiting (Mendoza et al., 2017), and broader changes in plant–frugivore interactions (van Schaik et al., 1993). Fruiting timing may also be linked to the seed germination strategy. In the Wet Tropics, soft-coated seeds tend to germinate immediately, whereas seeds with leathery, fibrous, or stony endocarps generally show delayed germination because of mechanical dormancy (Hopkins and Graham, 1987). Although we lacked complete seed trait data, four of the species showing shifts in fruiting timing are known to be dispersed by the endangered southern cassowary (Casuarius casuarius johnsonii) in the Wet Tropics. Of these four species, three exhibited delayed fruiting and one showed advancing fruiting. Overall, the picture is complex, and targeted research linking climate drivers, seed traits, dispersal timing, and recruitment outcomes is needed to uncover the mechanisms involved.
4.2 Long-term patterns
The majority of species assessed in this study flowered annually (57.5 %), with supra-annual and sub-annual flowering periodicity less common (35.6 % and 6.9 %, respectively). In contrast, fruiting was largely supra-annual (54.0 %), with annual and sub-annual fruiting less common (36.8 % and 9.2 %, respectively). Supra-annual flowering and fruiting patterns have been reported in other tropical rainforests (Norden et al., 2007; Chapman et al., 2018; Mendoza et al., 2018; Wright and Calderon, 2018). Among the species that flower annually (n=42), 38 % presented supra-annual fruiting. This pattern is consistent with three non-exclusive hypotheses: (i) the resources required for fruit development occur less frequently than those required for flowering, (ii) there are year-dependent shifts in allocation, with resources diverted to other processes (e.g. growth), and (iii) intermittent pollination success. Targeted investigations of pollination and seed-dispersal processes are required to disentangle these alternatives.
Developing an understanding of how fruit morphology and species functional traits relate to fruiting phenology can help to clarify the functional roles of tree species in rainforest ecosystems. At the outset, we expected species with supra-annual patterns to be influenced by functional traits such as tree height, sexual system, and seed size. However, the relationship between reproductive phenology and mode of seed dispersal was not clear. We expected that abiotically dispersed species would present higher inter-annual variation. Both biotically and abiotically dispersed groups showed inter-annual variation in fruiting activity. Although abiotically dispersed species had more pronounced inter-annual peaks through time, supra-annual fruiting was not clearly associated with seed-dispersal group, and overall variation in fruiting activity was similar between biotically and abiotically dispersed species. Supra-annual fruiting activity did not appear to be highly synchronous among species. This suggests that inter-annual variation in abiotically dispersed species may not be primarily driven by coordinated supra-annual fruiting, and the expectation of greater inter-annual variation in abiotically dispersed species was not supported at our study site. Species that displayed supra-annual fruiting tended to have more negative δ13C, suggesting lower intrinsic water-use efficiency (iWUE) in these species. Species with higher iWUE may be able to maintain photosynthetic activity under conditions of reduced water availability, potentially allowing them to sustain reproductive activity in unfavourable years. In contrast, supra-annual species may depend more on years with higher resource availability and suitable environmental conditions for reproduction.
Supra-annual flowering was more likely to occur in biotically dispersed species; however, the mechanism underlying this relationship remains unclear. Species with larger seeds were more likely to exhibit supra-annual fruiting, and the relationship between large seeds and supra-annual activity is expected to be linked to the resource demands of large seeds, which tend to be more costly to produce and therefore may require longer time frames to accumulate the energy and nutrient reserves necessary for their development (van Schaik et al., 1993). For such costly seeds, synchronised fruiting activity may also contribute to the satiation of seed predators and hence greater seed survival (Kelly, 1994; Kelly and Sork, 2002). In the Wet Tropics, a study reported that small seeds are removed or predated more frequently than large seeds, and large seeds tended to show higher short-term survival (Osunkoya, 1994). Also in the Wet Tropics rainforest, the observation that larger seeds are generally removed less frequently was consistent with a restricted large pool of seed consumers in this ecoregion (Doust, 2011).
Supra-annual activity (flowering and fruiting) did not occur in the same years for biotic and abiotic groups, implying different constraints on reproductive timing among groups and species. This observation is consistent with the suggestions that general flowering may be the result of biogeographic history, phylogenetic influences, and evolutionary conservatism (Ashton et al., 1988; Kurten et al., 2018). We detected a weak phylogenetic signal in supra-annual fruiting but not in flowering. This is supported by regional evidence for phylogenetic clustering by sex and fruit type (Gross, 2005). This interpretation is also compatible with paleo-evidence that large parts of the Wet Tropics were more seasonal during the last glacial maximum (Kershaw et al., 2007; Turney et al., 2006; Haberle, 2005; Burrows et al., 2016). However, further comparative and phylogenetic studies in the Wet Tropics would be required before evolutionary conservatism can be identified as a major driver of supra-annual fruiting. Climate triggers such as El Niño-Southern Oscillation (ENSO) events may also contribute to inter-annual variation in fruiting, as reported in other tropical rainforests, and this warrants further investigation in the Wet Tropics bioregion (Delage and Power, 2020; Wright et al., 1999, Chapman et al., 2018; Williamson and Ickes, 2002).
4.3 Calendar and restoration
We have provided species-level phenology calendars for each of the 81 tree species included in our study in the Wet Tropics in the Supplement. Due to the fragmented nature of much of the Wet Tropics rainforest bioregion, reforestation plantings have been implemented to enhance connectivity and to build resilience in the rainforest. These calendars will support those efforts because a detailed understanding of seasonal as well as long-term phenological dynamics are necessary for successful ecological restoration (Rother et al., 2022). Given that restoration efforts tend to be concentrated near nurseries (Engert et al., 2026), phenological calendars can help to ensure the timing of seed sourcing and planting schedules are guided by ecological principles rather than being driven primarily by convenience. In addition, we anticipate that the calendars will be a useful resource for further studies on climate change impacts and forest ecology in the Wet Tropics.
4.4 Limitations of this study
The subplot-based presence/absence approach required us to focus our analysis on transect-scale timing of species- and community-level activity. As our data describe phenology at the species (transect-scale) level, they do not allow us to distinguish population phenology from individual-level periodicity (Newstrom et al., 1994). We avoided use of the term “population” as this implies a demographically defined set of individuals with defined boundaries, which was not established along the 7.5 km transect.
Despite this, we suggest that our onset and peak dates should be interpreted as approximations of true species flowering and fruiting timing for this location, and the phenological reproductive intervals should be interpreted as transect-scale occurrence patterns rather than individual flowering or fruiting schedules.
A previous study of Cardwellia sublimis found that Skyrail subplot-based estimates of flowering onset, peak flowering, and fruiting activity were broadly consistent (within 1–2 months) with estimates from a Wet Tropics rainforest site (Mount Lewis, ∼ 130 km north) where individuals were monitored (Vogado et al., 2025). While limited to a single species and using a different site, it supports our premise that the subplot-based occupancy approach used at Skyrail can provide reasonable estimates of seasonal timing for at least some of the species. Future work combining the gondola transect with stem mapping and crown-level intensity scoring from digital photography has commenced; this will allow individual-based phenology and abundance-corrected estimates of activity to be made at Skyrail in the years ahead.
4.5 Conclusions
This study provides a long-term, multi-species baseline of reproductive tree phenology in the rainforests of the Australian Wet Tropics. Flowering was seasonal at the community level but heterogeneous at the species level. Flowering was concentrated in the wet season and fruiting in the dry season, although the interval between peak flowering and peak fruiting differed between biotically and abiotically dispersed groups. Over longer timescales, annual flowering was more common, whereas supra-annual fruiting predominated, with limited synchrony in supra-annual fruiting activity across species. Supra-annual flowering was more likely in biotically dispersed species, whereas supra-annual fruiting was more likely in species with larger seeds. Differences between biotically and abiotically dispersed groups indicate that phenological strategies vary among species in the plant community and, together with shifts in timing over decadal periods, may influence plant–animal interactions. Together, these findings and the phenology calendars provide a foundation for future ecological research, restoration practice, and the detection of climate-induced phenological change in the region.
Data are available in the Supplement and on Zenodo at https://doi.org/10.5281/zenodo.21812672 (Vogado et al., 2026).
The supplement related to this article is available online at https://doi.org/10.5194/we-26-175-2026-supplement.
NOV: conceptualisation, investigation, formal analysis, methodology, and writing (original draft). JEE: investigation, methodology, and writing (review and editing). MJL: methodology, resources, project administration, and writing (review and editing).
The contact author has declared that none of the authors has any competing interests.
Publisher's note: Copernicus Publications remains neutral with regard to jurisdictional claims made in the text, published maps, institutional affiliations, or any other geographical representation in this paper. The authors bear the ultimate responsibility for providing appropriate place names. Views expressed in the text are those of the authors and do not necessarily reflect the views of the publisher.
We are grateful to Stuart Worboys for training Tore Linde (Skyrail) and for the help with plant identification, and to Bob Jago for the help with sample identification and herbaria collection. We extend our gratitude to Will Edwards for comments and suggestions during the early stages of the manuscript, and to Darren Crayn and Eduardo Nery for discussions on the phylogenetic analysis. NOV was supported by the Alexander von Humboldt Foundation for postdoctoral research during the late stages of this work.
We acknowledge the traditional owners of the study region, and thank Skyrail Rainforest Cableway staff for their help and support with data collection. In particular, we acknowledge the late Tore Linde (Skyrail), who single-handedly collected the long-term phenological observations that underpin this study. Although he passed away before this manuscript was conceived, his foresight made possible the species-level phenological calendars that have been presented here. We dedicate this paper to his memory.
This paper was edited by Carine Emer and reviewed by two anonymous referees.
Adamescu, G. S., Plumptre, A. J., Abernethy, K. A., Polansky, L., Bush, E. R., Chapman, C. A., et al.: Annual cycles are the most common reproductive strategy in African tropical tree communities, Biotropica, 50, 418–430, 2018.
Agostinelli, C. and Lund, U.: R package 'circular': Circular Statistics (version 0.5-0), https://CRAN.R-project.org/package=circular (last access: 1 November 2025), 2023.
Ashton, P. S., Givnish, T. J., and Appanah, S.: Staggered flowering in the Dipterocarpaceae: new insights into floral induction and the evolution of mast fruiting in the aseasonal tropics, Am. Nat., 132, 44–66, 1988.
Boulter, S. L., Kitching, R. L., and Howlett, B.G.: Family, visitors and the weather: patterns of flowering in tropical rain forests of northern Australia, J. Ecol., 94, 369–382, 2006.
Brooks, M. E., Kristensen, K., van Benthem, K. J., Magnusson, A., Berg, C., Nielsen, A., Skaug, H. J., Maechler, M., and Bolker, B. M.: glmmTMB Balances Speed and Flexibility Among Packages for Zero-inflated Generalized Linear Mixed Modeling, R J., 9, 378–400, https://doi.org/10.32614/RJ-2017-066, 2017.
Bruelheide, H., Dengler, J., Purschke, O., Lenoir, J., Jiménez-Alfaro, B., Hennekens, S. M., et al.: Global trait–environment relationships of plant communities, Nature Ecology & Evolution, 2, 1906–1917, 2018.
Bucher, S. F. and Römermann, C.: Flowering patterns change along elevational gradients and relate to life-history strategies in 29 herbaceous species, Alpine Bot., 130, 41–58, 2020.
Bucher, S. F., König, P., Menzel, A., Migliavacca, M., Ewald, J., and Römermann, C.: Traits and climate are associated with first flowering day in herbaceous species along elevational gradients, Ecol. Evol., 8, 1147–1158, 2018.
Burrows, M. A., Heijnis, H., Gadd, P., and Haberle, S. G.: A new late Quaternary palaeohydrological record from the humid tropics of northeastern Australia, Palaeogeogr. Palaeocl., 451, 164–182, 2016.
Bush, E. R., Abernethy, K. A., Jeffery, K., Tutin, C., White, L., Dimoto, E., Dikangadissi, J.-T., Jump, A. S., and Bunnefeld, N.: Fourier analysis to detect phenological cycles using long‐term tropical field data and simulations. Methods in Ecology and Evolution, 8(5), 530-540, 2017.
Cai, Z., Jönsson, P., Jin, H., and Eklundh, L.: Performance of smoothing methods for reconstructing NDVI time-series and estimating vegetation phenology from MODIS data, Remote Sensing, 9, 1271, https://doi.org/10.3390/rs9121271, 2017.
Cardoso, F. C. G., Zwiener, V. P., and Marques, M. C. M.: Tree phenology along a successional gradient of tropical Atlantic Forest, J. Plant Ecol., 12, 272–280, 2019.
Castiglione, S., Serio, C., Piccolo, M., Mondanaro, A., Melchionna, M., Di Febbraro, M., Sansalone, G., Wroe, S., and Raia, P.: The influence of domestication, insularity and sociality on the tempo and mode of brain size evolution in mammals, Biol. J. Linn. Soc., 132, 221–231, https://doi.org/10.1093/biolinnean/blaa186, 2020.
Chapman, C. A., Wrangham, R. W., Chapman, L. J., Kennard, D. K., and Zanne, A. E.: Fruit and flower phenology at two sites in Kibale National Park, Uganda, J. Trop. Ecol., 15, 189–211, 1999.
Chapman, C. A., Valenta, K., Bonnell, T. R., Brown, K. A., and Chapman, L. J.: Solar radiation and ENSO predict fruiting phenology patterns in a 15-year record from Kibale National Park, Uganda, Biotropica, 50, 384–395, https://doi.org/10.1111/btp.12559, 2018.
Chen, S. C., Cornwell, W. K., Zhang, H. X., and Moles, A. T.: Plants show more flesh in the tropics: variation in fruit type along latitudinal and climatic gradients, Ecography, 40, 531–538, https://doi.org/10.1111/ecog.02010, 2017.
Chen, Y.-Y., Satake, A., Sun, I.-F., Kosugi, Y., Tani, M., Numata, S., Hubbell, S.P., Fletcher, C., Supardi, M.N.N. and Wright, S.J.: Species‐specific flowering cues among general flowering Shorea species at the Pasoh Research Forest, Malaysia, J. Ecol., 106, 586–598, 2018.
Craine, J. M., Wolkovich, E. M., and Towne, E. G.: The roles of shifting and filtering in generating community-level flowering phenology, Ecography, 35, 1033–1038, https://doi.org/10.1111/j.1600-0587.2012.07625.x, 2012.
Cortés-Flores, J., Cornejo-Tenorio, G., Urrea-Galeano, L. A., Andresen, E., González-Rodríguez, A., and Ibarra-Manriquez, G.: Phylogeny, fruit traits, and ecological correlates of fruiting phenology in a Neotropical dry forest, Oecologia, 189, 159–169, 2019.
Curran, L. M. and Webb, C. O.: Experimental tests of the spatiotemporal scale of seed predation in mast-fruiting Dipterocarpaceae, Ecol. Monogr., 70, 129–148, https://doi.org/10.2307/2657170, 2000.
Datta, A., Banerjee, S., Naniwadekar, R., Thapa, K., Rathore, A., Thapa, K., Brah, T., Nabum, T., Mogar, N., Shukla, U., Sidhu, S., and Borawake, N.: Patterns of Leaf, Flower, and Fruit Phenology and Environmental Relationships in a Seasonal Tropical Forest in the Indian Eastern Himalaya, Biotropica, 57, e70030, https://doi.org/10.1111/btp.70030, 2025.
De Jong, T. J., Klinkhamer, P. G. L., and Van Staalduinen, M. J.: The consequences of pollination biology for selection of mass or extended blooming, Funct. Ecol., 6, 606–615, https://doi.org/10.2307/2390059, 1992.
Delage, F. P. and Power, S. B.: The impact of global warming and the El Niño-Southern Oscillation on seasonal precipitation extremes in Australia, Clim. Dyn., 54, 4367–4377, 2020.
Doust, S. J.: Seed removal and predation as factors affecting seed availability of tree species in degraded habitats and restoration plantings in rainforest areas of Queensland, Australia, Restor. Ecol., 19, 617–626, 2011.
Edwards, W., Liddell, M. J., Franks, P., Nichols, C., and Laurance, S. G. W.: Seasonal patterns in rainforest litterfall: detecting endogenous and environmental influences from long-term sampling, Austral. Ecol., 43, 225–235, https://doi.org/10.1111/aec.12559, 2018.
Eiserhardt, W. L., Couvreur, T. L. P., and Baker, W. J.: Plant phylogeny as a window on the evolution of hyperdiversity in the tropical rainforest biome, New Phytol., 214, 1408–1422, https://doi.org/10.1111/nph.14516, 2017.
Engert, J. E., Vogado, N. O., Freebody, K., Byrne, B., Murphy, J., Sheather, G., and Laurance, S. G.: Functional trait representation differs between restoration plantings and mature tropical rainforest, For. Ecol. Manage., 473, 118304, https://doi.org/10.1016/j.foreco.2020.118304, 2020.
Engert, J. E., Middleby, K., Vogado, N., and Laurance, S. G.: Seed collection practices in tropical rainforest restoration and implications for provenance research, For. Ecol. Manage., 602, 123376, https://doi.org/10.1016/j.foreco.2025.123376, 2026.
Falster, D., Gallagher, R., Wenk, E. H., Wright, I. J., Indiarto, D., Andrew, S. C., et al.: AusTraits, a curated plant trait database for the Australian flora, Sci. Data, 8, 254, https://doi.org/10.1038/s41597-021-01006-6, 2021.
Forrest, J. R.: Plant–pollinator interactions and phenological change: what can we learn about climate impacts from experiments and observations?, Oikos, 124, 4–13, https://doi.org/10.1111/oik.01386, 2015.
Fox, J. and Weisberg, S.: An R Companion to Applied Regression, third edn., Sage, Thousand Oaks, CA, 2019.
Fritz, S. A. and Purvis, A.: Selectivity in mammalian extinction risk and threat types: a new measure of phylogenetic signal strength in binary traits. Conserv. Biol., 24, 1042–1051, 2010.
Griz, L. M. S. and Machado, I. C. S.: Fruiting phenology and seed dispersal syndromes in caatinga, a tropical dry forest in northeastern Brazil, J. Trop. Ecol., 17, 303–321, https://doi.org/10.1017/S0266467401001201, 2001.
Gross, C. L.: A comparison of the sexual systems in the trees from the Australian tropics with other tropical biomes – more monoecy but why?, Am. J. Bot., 92, 907–919, https://doi.org/10.3732/ajb.92.6.907, 2005.
Haberle, S. G.: A 23,000-yr pollen record from Lake Euramoo, wet tropics of NE Queensland, Australia, Quat. Res., 64, 343–356, https://doi.org/10.1016/j.yqres.2005.08.013, 2005.
Hartig, F.: DHARMa: Residual Diagnostics for Hierarchical (Multi-Level/Mixed) Regression Models, R package version 0.4.6, https://CRAN.R-project.org/package=DHARMa (last access: 5 November 2025), 2022.
Hopkins, M. and Graham, A. W.: The viability of seeds of rainforest species after experimental soil burials under tropical wet lowland forest in north‐eastern Australia, Australian J. Ecol., 12, 97–108, 1987.
Hughes, L.: Climate change and Australia: trends, projections and impacts, Austral. Ecol., 28, 423–443, 2003.
IPCC: Climate Change 2021: The Physical Science Basis, Contribution of Working Group I to the Sixth Assessment Report of the Intergovernmental Panel on Climate Change, Cambridge Univ. Press, Cambridge, https://doi.org/10.1017/9781009157896, 2021.
Janzen, D. H.: Synchronization of sexual reproduction of trees within the dry season in Central America, Evolution, 21, 620–637, https://doi.org/10.2307/2406621, 1967.
Janzen, D. H.: Tropical blackwater rivers, animals, and mast fruiting by the Dipterocarpaceae, Biotropica, 6, 69–103, https://doi.org/10.2307/2989823, 1974.
Jin, Y. and Qian, H. V.: PhyloMaker: an R package that can generate very large phylogenies for vascular plants, Ecography, 42, 1353–1359, 2019.
Jordano, P.: Angiosperm fleshy fruits and seed dispersers: a comparative analysis of adaptation and constraints in plant–animal interactions, Am. Nat., 145, 163–191, https://doi.org/10.1086/285735, 1995.
Kang, H. and Bawa, K.S.: Effects of successional status, habit, sexual systems, and pollinators on flowering patterns in tropical rain forest trees, Am. J. Bot., 90, 865–876, https://doi.org/10.3732/ajb.90.6.865, 2003.
Kamino, L. H. Y., Rezende, É. A., Santos, L. J. C., Felippe, M. F., and Assis, W. L.: Atlantic Tropical Brazil. In: Salgado, A., Santos, L., Paisani, J. (Eds.): The Physical Geography of Brazil, in: Geography of the Physical Environment, Springer, Cham, https://doi.org/10.1007/978-3-030-04333-9_4, 2019.
Kelly, D. and Sork, V. L.: Mast seeding in perennial plants: why, how, where?, Annu. Rev. Ecol. Syst., 33, 427–447, https://doi.org/10.1146/annurev.ecolsys.33.020602.095433, 2002.
Kelly, D.: The evolutionary ecology of mast seeding, Trends Ecol. Evol., 9, 465–470, https://doi.org/10.1016/0169-5347(94)90310-7, 1994.
Kershaw, A. P., Bretherton, S. C., and van der Kaars, S.: A complete pollen record of the last 230 ka from Lynch's Crater, north-eastern Australia, Palaeogeogr. Palaeocl., 251, 23–45, https://doi.org/10.1016/j.palaeo.2007.02.015, 2007.
König, P., Tautenhahn, S., Cornelissen, J. H. C., Kattge, J., Bönisch, G., and Römermann, C.: Advances in flowering phenology across the Northern Hemisphere are explained by functional traits, Glob. Ecol. Biogeogr., 27, 310–321, https://doi.org/10.1111/geb.12696, 2018.
Kurten, E. L., Bunyavejchewin, S., and Davies, S. J.: Phenology of a dipterocarp forest with seasonal drought: Insights into the origin of general flowering, J. Ecol., 106, 126–136, https://doi.org/10.1111/1365-2745.12858, 2018.
Liu, N., Garcia, M., Singh, A., Clare, J. D. J., Stenglein, J. L., Zuckerberg, B., Kruger, E. L., and Townsend, P. A.: Trail camera networks provide insights into satellite-derived phenology for ecological studies, Int. J. Appl. Earth Obs. Geoinf., 97, 102291, https://doi.org/10.1016/j.jag.2020.102291, 2021.
McGillycuddy, M., Warton, D. I., Popovic, G., and Bolker, B. M.: Parsimoniously Fitting Large Multivariate Random Effects in glmmTMB, arXiv [preprint], https://doi.org/10.48550/arXiv.2411.04411, 2024.
Mendoza, I., Peres, C. A., and Morellato, L. P. C.: Continental-scale patterns and climatic drivers of fruiting phenology: A quantitative Neotropical review, Global Planet. Change, 148, 227–241, https://doi.org/10.1016/j.gloplacha.2016.12.001, 2017.
Mendoza, I., Condit, R. S., Wright, S. J., Caubère, A., Châtelet, P., Hardy, I., and Forget, P.-M.: Inter-annual variability of fruit timing and quantity at Nouragues (French Guiana): insights from hierarchical Bayesian analyses, Biotropica, 50, 431–441, https://doi.org/10.1111/btp.12560, 2018.
Metcalfe, D. J. and Ford, A. J.: Floristics and plant biodiversity of the rainforests of the Wet Tropics, in: Living in a Dynamic Tropical Forest Landscape, 123–132, https://doi.org/10.1002/9781444300321.ch9, 2008.
Migliavacca, M., Musavi, T., Mahecha, M. D., Nelson, J. A., Knauer, J., Baldocchi, D. D., et al.: The three major axes of terrestrial ecosystem function, Nature, 598, 468–472, 2021.
Momose, K., Ishii, R., Sakai, S., and Inoue, T.: Plant reproductive intervals and pollinators in the aseasonal tropics: a new model, P. Roy. Soc. Lond. B Bio., 265, 2333–2339, https://doi.org/10.1098/rspb.1998.0580, 1998.
Morellato, L. P. C., Alberti, L., and Hudson, I. L.: Applications of Circular Statistics in Plant Phenology: A Case Studies Approach”, in: Phenological Research, edited by: Hudson, I. an Keatley, M., Springer, 339–359, https://doi.org/10.1007/978-90-481-3335-2_16, 2010.
Morellato, P. C. and Leitão-Filho, H. F.: Reproductive phenology of climbers in a southeastern Brazilian forest, Biotropica, 28, 180–191, https://doi.org/10.2307/2389073, 1996.
Morellato, L. P. C., Talora, D. C., Takahasi, A., Bencke, C. C., Romera, E. C., and Zipparro, V. B.: Phenology of Atlantic Rain Forest Trees: A Comparative Study1, Biotropica, 32, 811–823. https://doi.org/10.1111/j.1744-7429.2000.tb00620.x, 2000.
Newstrom, L. E., Frankie, G. W., and Baker, H. G.: A new classification for plant phenology based on flowering patterns in lowland tropical rain forest trees at La Selva, Costa Rica, Biotropica, 26, 141–159, https://doi.org/10.2307/2388804, 1994.
Norden, N., Chave, J., Belbenoit, P., Caubere, A., Chatelet, P., Forget, P. M., and Thebaud, C.: Mast fruiting is a frequent strategy in woody species of eastern South America, PLoS ONE, 2, e1079, https://doi.org/10.1371/journal.pone.0001079, 2007.
Numata, S., Yamaguchi, K., Shimizu, M., Sakurai, G., Morimoto, A., Alias, N., and Satake, A.: Impacts of climate change on reproductive phenology in tropical rainforests of Southeast Asia, Commun. Biol., 5, 311, https://doi.org/10.1038/s42003-022-03245-8, 2022.
Numata, S., Yasuda, M., Suzuki, R. O., Hosaka, T., Supardi, N. M. N., Fletcher, C. D., and Hashim, M.: Geographical pattern and environmental correlates of regional-scale general flowering in Peninsular Malaysia, PLoS ONE, 8, e79095, https://doi.org/10.1371/journal.pone.0079095, 2013.
Osunkoya, O. O.: Postdispersal survivorship of north Queensland rainforest seeds and fruits: effects of forest, habitat and species, Australian J. Ecol., 19, 52–64, 1994.
Pabon-Moreno, D. E., Musavi, T., Migliavacca, M., Reichstein, M., Römermann, C., and Mahecha, M. D.: Ecosystem physio-phenology revealed using circular statistics, Biogeosciences, 17, 3991–4006, https://doi.org/10.5194/bg-17-3991-2020, 2020.
Pau, S., Wolkovich, E. M., Cook, B. I., Nytch, C. J., Regetz, J., Zimmerman, J. K., and Wright, S. J.: Clouds and temperature drive dynamic changes in tropical flower production, Nat. Clim. Change, 3, 838–842, https://doi.org/10.1038/nclimate1934, 2013.
Pérez-Ramos, I. M., Cambrollé, J., Hidalgo-Galvez, M. D., Matías, L., Montero-Ramírez, A., Santolaya, S., and Godoy, Ó.: Phenological responses to climate change in communities of plants species with contrasting functional strategies, Environ. Exp. Bot., 170, 103852, https://doi.org/10.1016/j.envexpbot.2019.103852, 2020.
Polansky, L. and Robbins, M. M.: Generalized additive mixed models for disentangling long-term trends, local anomalies, and seasonality in fruit tree phenology, Ecol. Evol., 3, 3141–3151, 2013.
Rother, D. C., de Sousa, I. L., Gressler, E., Liboni, A. P., Souza, V. C., Rodrigues, R. R., and Morellato, L. P. C.: Comparing the potential reproductive phenology between restored areas and native tropical forest fragments in southeastern Brazil, Restor. Ecol., 30, e13529, https://doi.org/10.1111/rec.13529, 2022.
Russell-Smith, J. and Lee, A. H. Plant populations and monsoon rain forest in the Northern Territory, Australia, Biotropica, 24, 471–487, 1992.
Sakai, S., Momose, K., Yumoto, T., Nagamitsu, T., Nagamasu, H., Hamid, A. A., and Nakashizuka, T.: Plant reproductive phenology over four years including an episode of general flowering in a lowland dipterocarp forest, Sarawak, Malaysia, Am. J. Bot., 86, 1414–1436, 1999.
Sakai, S.: Phenological diversity in tropical forests, Popul. Ecol., 43, 77–86, https://doi.org/10.1007/PL00012018, 2001.
Schemske, D. W.: Floral convergence and pollinator sharing in two bee-pollinated tropical herbs, Ecology, 62, 946–954, https://doi.org/10.2307/1936993, 1981.
Segrestin, J., Navas, M. L., and Garnier, E.: Reproductive phenology as a dimension of the phenotypic space in 139 plant species from the Mediterranean, New Phytol., 225, 740–753, https://doi.org/10.1111/nph.16165, 2020.
Simpson, G.: gratia: Graceful ggplot-based graphics and other functions for GAMs fitted using mgcv, R package version 0.9.2, https://gavinsimpson.github.io/gratia/ (last access: 1 November 2025), 2024.
Smith, S. A. and Brown, J. W.: Constructing a broadly inclusive seed plant phylogeny, Am. J. Bot., 105, 302–314, 2018.
Staal, A., Fetzer, I., Wang-Erlandsson, L., Bosmans, J. H., Dekker, S. C., van Nes, E. H., and Tuinenburg, O. A.: Hysteresis of tropical forests in the 21st century, Nat. Commun., 11, 4978, https://doi.org/10.1038/s41467-020-18728-7, 2020.
Sun, S. and Frelich, L. E.: Flowering phenology and height growth pattern are associated with maximum plant height, relative growth rate and stem tissue mass density in herbaceous grassland species, J. Ecol., 99, 991–1000, https://doi.org/10.1111/j.1365-2745.2011.01830.x, 2011.
Talora, D. C. and Morellato, L. P. C.: Fenologia de espécies arbóreas em floresta de planície litorânea do sudeste do Brasil, Rev. Bras. Bot., 23, 13–26, https://doi.org/10.1590/S0100-84042000000100002, 2000.
Tracey, J. G.: The vegetation of the humid tropical region of North Queensland, CSIRO, Melbourne, 124 pp., https://doi.org/10.2307/2259757, 1982.
Turney, C. S., Kershaw, A. P., James, S., Branch, N., Cowley, J., Fifield, L. K., and Moss, P.: Geochemical changes recorded in Lynch's Crater, northeastern Australia, over the past 50 ka, Palaeogeogr. Palaeocl., 233, 187–203, https://doi.org/10.1016/j.palaeo.2005.09.009, 2006.
Orme, D., Freckleton, R., Thomas, G., Petzoldt, T., Fritz, S., Isaac, N., and Pearse, W.: caper: Comparative Analyses of Phylogenetics and Evolution in R, R package version 1.0.3, https://CRAN.R-project.org/package=caper (last access: 1 November 2025), 2023.
Valentin-Silva, A., Staggemeier, V. G., Batalha, M. A., and Guimarães, E.: What factors can influence the reproductive phenology of Neotropical Piper species (Piperaceae) in a semi-deciduous seasonal forest?, Botany, 96, 675–684, 2018.
Van Schaik, C. P., Terborgh, J. W., and Wright, S. J.: The phenology of tropical forests: adaptive significance and consequences for primary consumers, Annu. Rev. Ecol. Syst., 24, 353–377, 1993.
Vogado, N. O. and Liddell, M. J.: Climate change effects on long-term leafing activity of a tropical rainforest tree species, Davidsonia pruriens, Austral. Ecol., 50, e70077, https://doi.org/10.1111/aec.70077, 2025.
Vogado, N. O., Liddell, M. G., Laurance, S. G. W., Campbell, M. J., Cheesman, A. W., Engert, J. E., Palma, A. C., Ishida, F. Y., and Cernusak, L. A.: The effects of an experimental drought on the ecophysiology and fruiting phenology of a tropical rainforest palm, J. Plant Ecol., 13, 744–753, https://doi.org/10.1093/jpe/rtaa069, 2020.
Vogado, N. O., Engert, J. E., Linde, T. L., Campbell, M. J., Laurance, W. F., and Liddell, M. J.: Climate change affects reproductive phenology in lianas of Australia's wet tropics, Front. For. Glob. Change, 5, 787950, https://doi.org/10.3389/ffgc.2022.787950, 2022.
Vogado, N. O., Laurance, S. G., Liddell, M. J., Engert, J. E., Wurster, C. M., Schiffer, M., and Cernusak, L. A.: Assessing the effects of a drought experiment on the reproductive phenology and ecophysiology of a wet tropical rainforest community, Conserv. Physiol., 11, coad064, https://doi.org/10.1093/conphys/coad064, 2023.
Vogado, N. O., Engert, J. E., Green, P. T., and Liddell, M. J.: Regional variation in the reproductive phenology of a tropical rainforest tree species, Cardwellia sublimis, J. Plant Ecol., 18, rtaf022, https://doi.org/10.1093/jpe/rtaf022, 2025.
Vogado, N. O., Engert, J., and Liddell, M.: Phenological calendar and predicted fortnight phenological activity of Wet Tropical rainforest community, Zenodo [data set], https://doi.org/10.5281/zenodo.20556417, 2026.
Wang, M., Li, P., Peng, C., Xiao, J., Zhou, X., Luo, Y., and Zhang, C.: Divergent responses of autumn vegetation phenology to climate extremes over northern middle and high latitudes, Glob. Ecol. Biogeogr., 31, 2281–2296, https://doi.org/10.1111/geb.13583, 2022.
Westcott, D. A., Dennis, A. J., Bradford, M. G., Harrington, G. N., and McKeown, A.: Seed dispersal processes in Australia's tropical rainforests, in: Living in a Dynamic Tropical Forest Landscape, 210 pp., https://doi.org/10.1002/9781444300321, 2009.
Williamson, G. B. and Ickes, K.: Mast fruiting and ENSO cycles – does the cue betray a cause?, Oikos, 97, 459–461, 2002.
Williams, K. J., Ford, A., Rosauer, D. F., De Silva, N., Mittermeier, R., Bruce, C., Larsen, F. W., and Margules, C.: Forests of east Australia: the 35th biodiversity hotspot, in: Biodiversity Hotspots: Distribution and Protection of Conservation Priority Areas, edited by: Zachos, F. E. and Habel, J. C., Springer-Verlag, Berlin, Germany, 295–310, https://doi.org/10.1007/978-3-642-20992-5_16, 2011.
Wolkovich, E. M. and Cleland, E. E.: Phenological niches and the future of invaded ecosystems with climate change, AoB plants, 6, plu013, https://doi.org/10.1093/aobpla/plu013, 2014.
Wood, S. N.: Generalized additive models: an introduction with R, Chapman and Hall/CRC, https://doi.org/10.1201/9781315370279, 2017.
Wright, S. J. and Calderón, O.: Solar irradiance as the proximate cue for flowering in a tropical moist forest, Biotropica, 50, 374–383, 2018.
Wright, S. J. and van Schaik, C. P.: Light and the phenology of tropical trees, Am. Nat., 143, 192–199, 1994.
Wright, S. J., Carrasco, C., Calderón, O., and Paton, S.: The El Niño Southern Oscillation, variable fruit production, and famine in a tropical forest, Ecology, 80, 1632–1647, 1999.
Zanne, A. E., Tank, D. C., Cornwell, W. K., Eastman, J. M., Smith, S. A., FitzJohn, R. G., et al.: Three keys to the radiation of angiosperms into freezing environments, Nature, 506, 89–92, 2014.
Zich, F. A., Hyland, B. P. M., Whiffin, T., and Kerrigan, R. A.: Australian Tropical Rainforest Plants, Edition 7, https://www.anbg.gov.au/cpbr/cd-keys/RFK7/key/RFK7/Media/Html/index_rfk.htm (last access: 1 November 2025), 2018.
Zimmerman, J. K., Wright, S. J., Calderón, O., Pagan, M. A., and Paton, S.: Flowering and fruiting phenologies of seasonal and aseasonal neotropical forests: the role of annual changes in irradiance, J. Trop. Ecol., 23, 231–251, 2007.
The requested paper has a corresponding corrigendum published. Please read the corrigendum first before downloading the article.
- Article
(3794 KB) - Full-text XML
- Corrigendum
-
Supplement
(826 KB) - BibTeX
- EndNote