the Creative Commons Attribution 4.0 License.
the Creative Commons Attribution 4.0 License.
 | 04 Mar 2026
Decoding fungal communities: ITS extraction matters more than ASVs vs. OTUs
Gabriele Tosadori
Jason Bosch
To capture the complexity of fungal communities, microbial ecologists must often resort to amplicon sequencing. Amplicon sequences are obtained from the nuclear ribosomal internal transcribed spacer (ITS), which is currently used as a marker for fungal taxonomic identity. Raw amplicon sequences are analysed using either amplicon sequence variants (ASVs) or operational taxonomic units (OTUs). However, these two approaches are conceptually different, and there is disagreement over which is more suitable for fungal sequence data.
In order to address this problem, we used published fungal genomes to simulate amplicon sequencing of the ITS1 and ITS2 regions of fungal communities with diversity spanning 50 to 800 strains. These data were then analysed via six pipelines with differences at key steps in read processing and ASV/OTU retrieval. In addition, we confirmed the results with sequencing data from a previously published 189-strain mock community.
Our results show that the choice between ASV and OTU has only a minor effect on the end result and that the most important step in the analysis pipeline is the extraction of the ITS region from the short-read sequences. Moreover, we recommend sequencing with as large a library size as possible, joining the reads to perform ITS extraction and then clustering the sequences into OTUs. We hope that this will help microbial ecologists choose the most appropriate approach to answer their specific questions.
- Article
(2411 KB) - Full-text XML
-
Supplement
(4486 KB) - BibTeX
- EndNote


Due to the difficulty in culturing many microbial species, fungal communities are often studied through the amplification and sequencing of specific, carefully selected stretches of DNA, i.e. barcodes. This sidesteps the problems of culturing microbes but brings its own challenges, such as identifying which amplicons come from which species – a task made more difficult by the multiple copies and the intraspecific variation in markers, such as the ITS region (Lofgren et al., 2019).
Operational taxonomic units (OTUs) group sequences together at a specified similarity threshold in order to approximate fungal species (Kauserud, 2023). OTUs are retrieved by clustering sequences via similarity, traditionally using 97 % similarity as a threshold (Tedersoo et al., 2022). While this is adequate for most taxa (Blaalid et al., 2013), it is unsuitable for many others (Nilsson et al., 2008).
A more recent approach is given by amplicon sequence variants (ASVs). ASVs do not cluster by similarity but use statistical tools to correct for sequencing errors, i.e. a process called denoising, to identify the true sequence for each read (Callahan et al., 2016, 2017). While DADA2's ASVs are widely used, there are conceptually similar methods with different names, such as UNOISE2's zero-radius OTUs (zOTUs; Edgar, 2016). The main differences between OTUs and ASVs are the following: (1) ASVs are supposed to represent actual biological sequences, whereas OTUs are clusters of similar sequences; (2) ASVs can be directly compared between studies that use the same workflow, whereas OTUs are study-specific; and (3) ASVs can resolve single base-pair sequence differences, whereas OTU resolution varies depending on the threshold and read composition.
Studies have shown no difference when analysing bacterial 16S ASVs or OTUs at the family level (García-López et al., 2021), and broad-scale ecological conclusions remain valid whether using OTUs or ASVs for both 16S and ITS amplicons (Glassman and Martiny, 2018; García-López et al., 2021; Rzehak et al., 2024). However, there are concerns that fungal ASVs will over-inflate alpha diversity due to high copy numbers of ribosomal DNA and intraspecific sequence variation (Tedersoo et al., 2022; Kauserud, 2023). While this has been demonstrated on some small datasets (Estensmo et al., 2021), larger comparisons have concluded that ASVs outperform OTUs for fungal datasets and that it is OTUs that result in exaggerated alpha diversity due to the number of false positives (Pauvert et al., 2019; Joos et al., 2020). For example, Pauvert et al. (2019) found that OTU-based approaches identified between 577 and 1413 OTUs for a community of only 189 fungal species. However, see Glassman and Martiny (2018) for a contradictory result. Finally, the higher resolution of ASVs may reveal ecologically relevant information, which can be obscured by the use of OTUs (Tipton et al., 2022). At present, there is no consensus on the trade-offs between the two approaches or agreement on which one best represents the true fungal community.
In this paper, we take advantage of publicly available fungal genomes to simulate amplicon sequencing datasets with realistic levels of diversity in order to compare the results obtained using either ASVs or OTUs with the true community composition. This is intended to address the question of the most suitable way to perform fungal metabarcoding analyses and should be of interest to all researchers working with fungal amplicons.
2.1 Taxon selection
We downloaded the DNA “toplevel” fasta files from Ensembl Fungi Release 57/Release 110 (http://ftp.ensemblgenomes.org/pub/fungi/release-57/, last access: 19 August 2025), which contains 1505 genomes from 859 species. In order to obtain real-world levels of intragenomic diversity, we used primersearch from EMBOSS 6.6.0.0 (Rice et al., 2000) to identify all amplicons per genome for a particular primer pair and selected those with a minimum length of 100 bases and a maximum length of 1499 bases. We used the gITS7 (5′-GTGAATCATCGAATCTTTG-3′) and ITS4 (5′-TCCTCCGCTTATTGATATGC-3′) primers, targeting the ITS2 region (Ihrmark et al., 2012), as they are recommended and widely used in the field (Tedersoo et al., 2022). To be sure our results were not specific to a particular primer pair, we additionally tested ITS1f (5′-CTTGGTCATTTAGAGGAAGTAA-3′) with ITS2 (5′-GCTGCGTTCTTCATCGATGC-3′), as recommended by the Earth Microbiome Project (https://earthmicrobiome.org/protocols-and-standards/its/, last access: 19 August 2025; Tedersoo et al., 2022), which amplifies the ITS1 region and 1183F (5′-AATTYGAHTCAACRCGGG-3′) with 1625R (5′-CGACRGGMGGTGTGBACA-3′), which amplifies the 18S rRNA gene and has been recommended for general eukaryotic studies (Latz et al., 2022).
2.2 Generation of mock communities
A total of 10 mock communities were simulated from all the species which produced amplicons for a particular primer pair, with the abundances determined by a power law function (x−1.08). If multiple amplicons were produced from a single species, they contributed equally to the abundance of that species. In silico next-generation sequencing was simulated using Grinder 0.5.4 (Angly et al., 2012). The simulated reads were 300 bases long and had an insert distance (maximum amplicon size) of 2500 bases; uniform mutations across the length of each read at a rate of 0.473 % (Stoler and Nekrutenko, 2021); a 1000:1 ratio of substitutions and indels (Schirmer et al., 2016); and 10 % chimeras (De Muinck et al., 2017) occurring in the ratio of bimers, trimers and quadramers. We produced three library sizes for each community: small (10 000 reads), medium (25 000 reads) and large (50 000 reads). A limitation of Grinder is that it does not generate realistic error profiles for the simulated reads. To overcome this, we used quality scores obtained from real sequencing data that were randomly assigned to the simulated reads. To test our pipelines on real data, we used the triplicate sequencing of mock communities published by Pauvert et al. (2019).
2.3 Sequence processing
The mock sequencing data were preprocessed using one of two pipelines depending on whether the ITS region was extracted from the reads or not. ITS extraction has been recommended as flanking regions may complicate clustering (Bengtsson-Palme et al., 2013; Tedersoo et al., 2022). However, QIIME2's developers state that ITS extraction offers little benefit when training naïve Bayes classifiers to assign taxonomy to each OTU/ASV (https://docs.qiime2.org/2024.10/tutorials/feature-classifier/, last access: 19 August 2025), suggesting that it may also be unnecessary for the overall analysis. ITS extraction is further omitted in the QIIME2 fungal ITS tutorial (https://forum.qiime2.org/t/fungal-its-analysis-tutorial/7351, last access: 19 August 2025), but it is included in a tutorial by the Australian Microbiome Initiative (https://www.australianmicrobiome.com/protocols/itsanalysisworkflow/, last access: 19 August 2025).
In the ITS extraction pipeline, the forward and reverse reads were merged with fastq-join (Aronesty, 2013), with a minimum overlap of 40 bases and maximum difference of 15 %. The joined reads were processed by Trimmomatic 0.39 (Bolger et al., 2014), and the ITS region was extracted with ITSxpress (Rivers et al., 2018). Joining reads and extracting the ITS region has a drawback in that length variations in ITS regions mean that the reads of some taxa can not be joined, leading to an ITS length bias. Due to this, researchers sometimes only use the forward reads (Nguyen et al., 2015; Pauvert et al., 2019). In the forward-only pipeline, the only preprocessing was trimming by Trimmomatic. For both the ITS extraction and the forward-only pipelines, we used Trimmomatic to (1) trim the first 20 bases of the read to remove the barcode; (2) remove low-quality bases using a 6-base sliding window and a minimum quality score of 20; and, finally, (3) discard any reads that were shorter than 100 bases. As there is no ITS region to extract for the 18S amplicons, we conducted the comparison using only the forward reads versus using the merged forward and reverse reads.
The trimmed sequences were processed with QIIME2 amplicon-2024.02 (Bolyen et al., 2019) in one of three ways. ASVs were generated using DADA2 (Callahan et al., 2016) with either the default settings (maximum expected errors=2, reads truncated at the first quality score≤2) or with modified settings recommended for fungal ITS sequences (maximum expected errors=8, reads truncated at the first quality score≤8; Rolling et al., 2022). In both cases, samples were pseudo-pooled for ASV calling. Alternatively, sequences were clustered into 97 % OTUs with the QIIME2 VSearch plugin (Rognes et al., 2016), and chimeras were removed using uchime de novo filtering. The ASVs and OTUs were taxonomically classified by a naïve Bayes classifier trained on either the dynamic, developer sequences of UNITE version 9 (Nilsson et al., 2019; Abarenkov et al., 2022) or the Silva 138.1 SSU database (Quast et al., 2013; Yilmaz et al., 2014; Robeson et al., 2021). For the 18S region, we obtained essentially no usable reads using the ASV approaches and about half as many reads as for other markers using OTU approaches (Figs. S1 and S2 in the Supplement). As such, no further analysis was attempted as these 18S primers were deemed unsuitable for fungal community analysis.
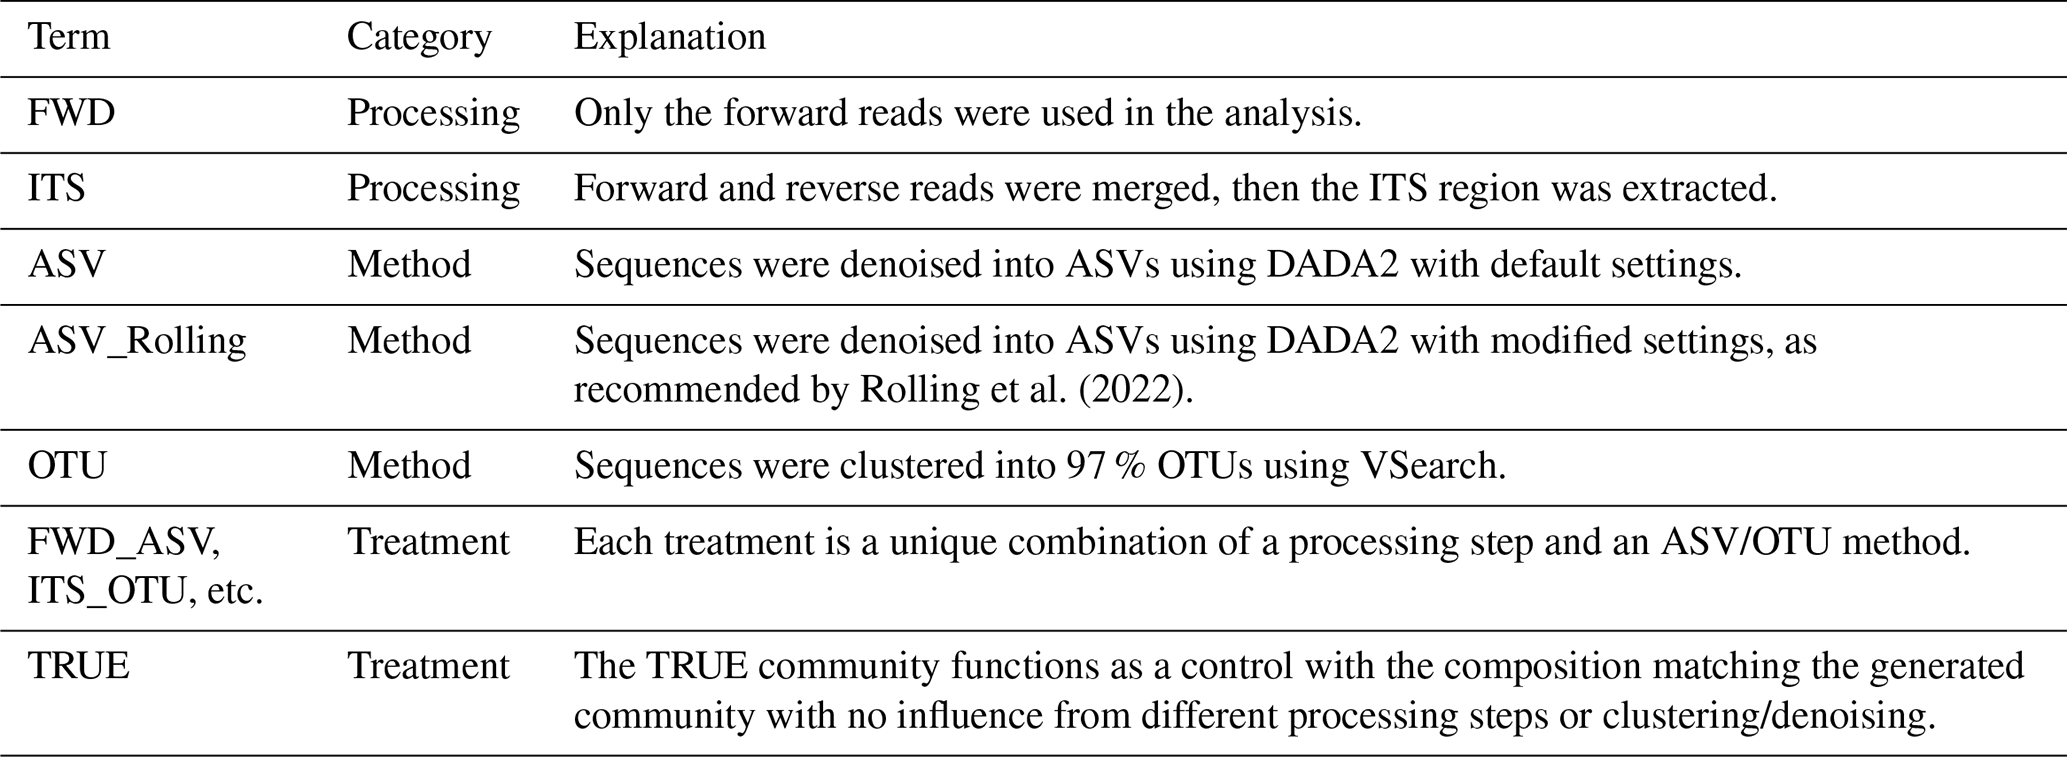
In this paper, we refer to each pipeline as a treatment made up of a unique combination of read processing and an ASV/OTU method. With two possibilities for read processing and three methods of forming ASVs/OTUs, we have a total of six treatments (Table 1). In order to compare the treatments with the ground truth, we used the TRUE community. The TRUE community represents the generated community without the effects of PCR errors, processing, or clustering/denoising. To create the TRUE community, we summed reads from different amplicons so that taxa with multiple amplicons would have greater relative abundance than taxa which only produce a single amplicon. The proportion of each taxon was multiplied by the library size and rounded to the nearest whole number to give the number of reads produced by that taxon in an ideal situation. Finally, the species and genus name from Ensembl Fungi was matched to the UNITE database. In the few cases when taxa names could not be found in the database, they were considered to be unidentified in the TRUE community.
Table 1An explanation of the abbreviations for each treatment and what that treatment entailed.
2.4 Community analysis
The performance of the treatment was evaluated by comparison of the simulated community with the true community from which the artificial sequencing reads were derived. The comparisons were performed on a number of ecologically relevant parameters and at different taxonomic levels. Simulated communities were evaluated on their diversity metrics (number of observed ASVs/OTUs, Simpson's Index of Diversity and the Shannon Diversity Index), taxonomic composition, sensitivity (), specificity () and distance from the true community. We used three different distance measurements – Aitchison, Hellinger and Bray–Curtis. Aitchison has been recommended for compositional data (Gloor et al., 2017; Tedersoo et al., 2022) and is seen as superior to Bray–Curtis dissimilarity (Gloor et al., 2017). Hellinger distance has been shown to perform well and has also been recommended for microbial datasets (Legendre and Gallagher, 2001; Chen et al., 2021), although it has been criticised due to not being monotonic to changes in absolute abundance (Ricotta, 2019). Bray–Curtis dissimilarity was also included due to its widespread usage in microbial ecology.
Although the differences in library sizes in these artificial communities are minimal, we performed rarefaction to better mimic real-world analysis practices. A single round of rarefaction, though commonly used in microbial ecology, is incorrect as it merely subsamples and does not correct for library size (Cameron et al., 2021; Schloss, 2023). We made use of the mirlyn R package to perform 100 rounds of rarefaction (Cameron et al., 2021).
We identified the most important variables, which explained the distance between the treatments and mock data through statistical modelling, as implemented in the R package nlme (Pinheiro and Bates, 2000; Pinheiro et al., 2025). We analysed the data with two models: the short model (), which calculated the effects of taxonomic level and treatment, and the full model (), which calculated the effects of taxonomic level, read processing and ASV/OTU method. In all cases, we controlled for community diversity as a random effect. For the reanalysis of the Pauvert et al. (2019) data, we did not consider library size as there was no variation in library size.
All analyses of the community data were performed in R 4.4.1 (14 June 2024) (R Core Team, 2024) using the following packages and their dependencies: groundhog 3.2.0 (Simonsohn and Gruson, 2023) – set to either 1 April 2024 or 25 April 2024 depending on the script, vegan 2.6-4 (Oksanen et al., 2022), mirlyn 1.4.2 (Cameron et al., 2021), nlme 3.1-164 (Pinheiro and Bates, 2000; Pinheiro et al., 2025), viridis 0.6.5 (Garnier et al., 2024), multcompView 0.1-10 (Graves et al., 2024), ggpubr 0.6.0 (Kassambara, 2023), FSA 0.9.5 (Ogle et al., 2023), multcomp 1.4-25 (Hothorn et al., 2008), dplyr 1.1.4 (Wickham et al., 2023), ggrepel 0.9.5 (Slowikowski, 2024), ggtext 0.1.2 (Wilke and Wiernik, 2022), cowplot 1.1.3 (Wilke, 2024), ggplot2 3.5.1 (Wickham, 2016), MetBrewer 0.2.0 (Mills, 2022), ggpubfigs 0.0.1 (Steenwyk, 2024), RColorBrewer 1.1-3 (Neuwirth, 2022), phyloseq 1.48.0 (McMurdie and Holmes, 2013), ggnewscale 0.4.10 (Campitelli, 2025) and stringr 1.5.1 (Wickham, 2023).
3.1 Simulated communities
3.1.1 Taxonomic diversity
The taxonomic composition of our simulated communities was highly dependent on the taxonomic composition of the Ensembl Fungi database (Figs. 1 and S3–S7). For the ITS1 and ITS2 communities, we were capable of simulating communities of 450 and 500 unique species respectively. To obtain communities with higher diversity, up to 800 individual genomes, we allowed genomes of different strains from the same species.
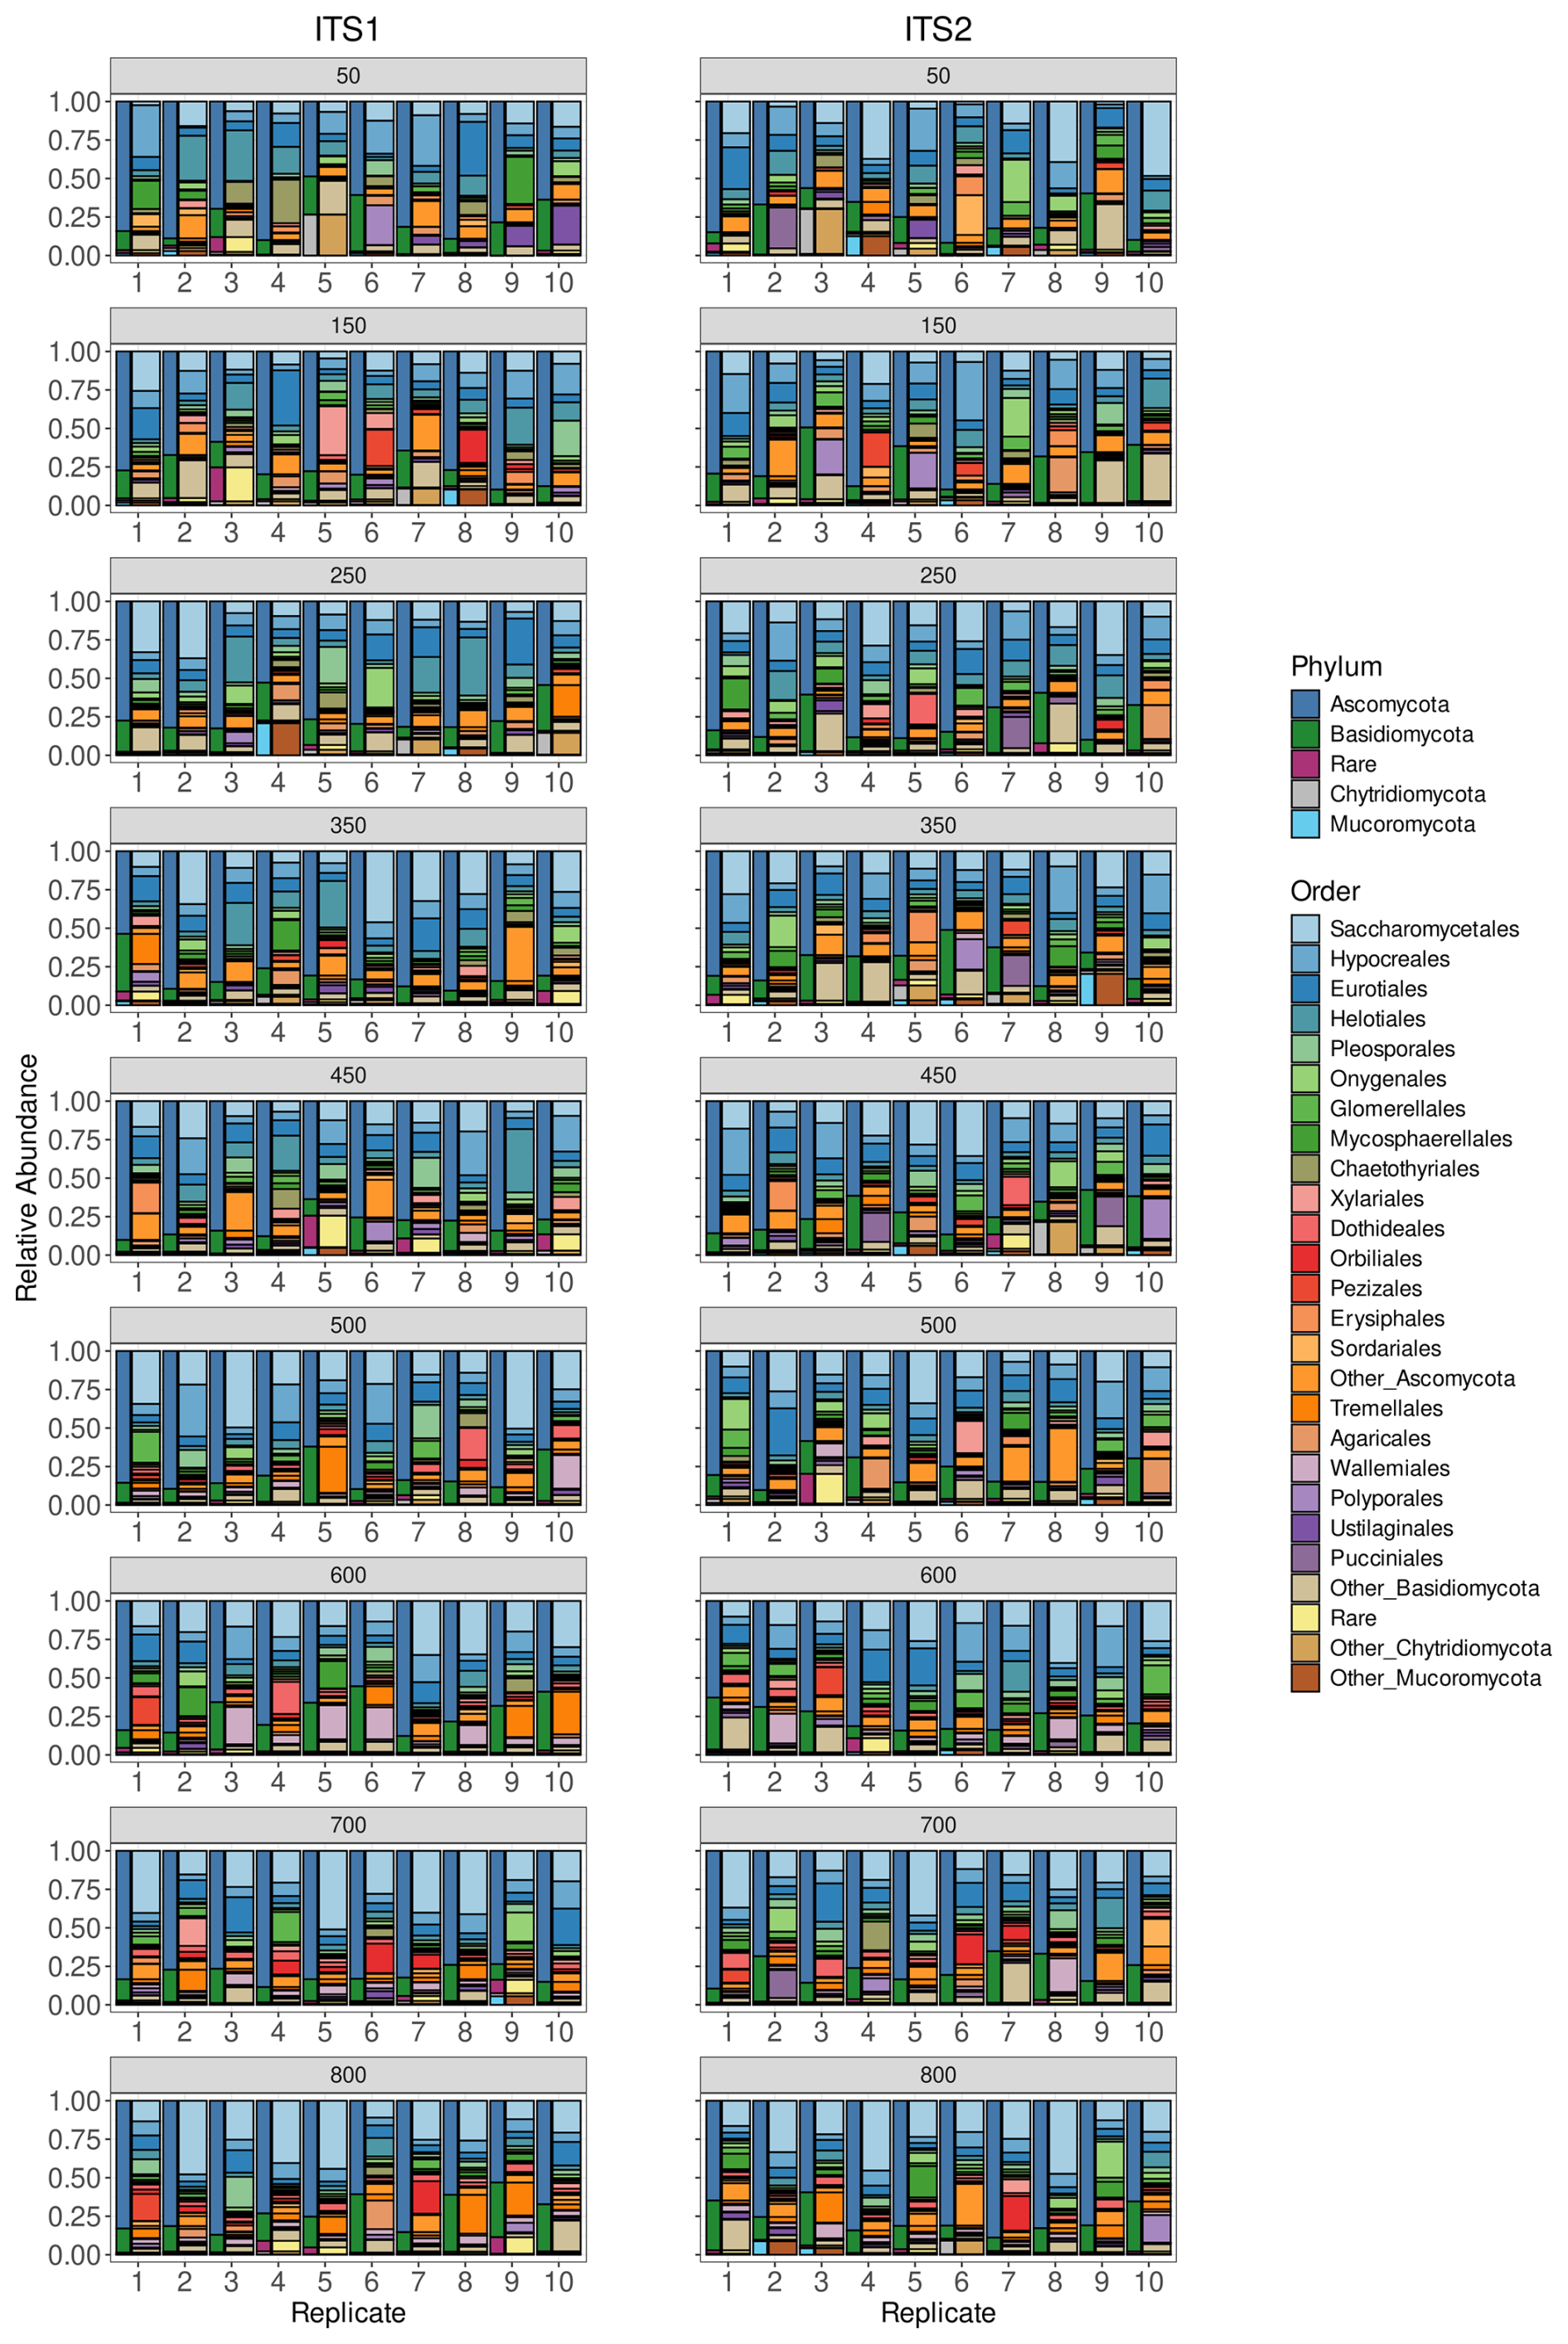
Figure 1Taxonomy of simulated communities. Stacked barplots show the taxonomic composition of the simulated ITS1 (left side) and ITS2 (right side) communities. For each diversity level, ranging from 50 fungal genomes (top) to 800 fungal genomes (bottom), the 10 replicate communities are shown at both the phylum (narrow column) and the order (wide column) levels.
The ITS1 communities were primarily composed of Ascomycota (77.30 %) and Basidiomycota (17.83 %), with large proportions of Glomeromycota, Chytridiomycota, or Mucoromycota in specific communities. The most common orders were Saccharomycetales (19.80 %), Hypocreales (10.00 %), Eurotiales (9.20 %) and Helotiales (7.72 %), and the most common genera were Saccharomyces (5.88 %), Aspergillus (4.45 %) and Fusarium (4.41 %).
Similar to the ITS1 communities, Ascomycota (75.39 %) and Basidiomycota (19.72 %) accounted for the vast majority of the phylum-level ITS2 reads. Even at lower taxonomic levels, the communities of the different markers were similar. The most common orders were Saccharomycetales (18.25 %), Hypocreales (10.72 %), Eurotiales (9.10 %) and Helotiales (5.18 %), and the most common genera were Saccharomyces (5.32 %), Aspergillus (4.69 %) and Fusarium (3.72 %).
3.1.2 Alpha diversity
We found that, even for the TRUE community, the small library size was insufficient to fully capture the richness of the samples, and the plot starts to level off even as diversity increases (Figs. S8 and S9). The medium and large libraries show a more linear response, with the larger library size showing smaller variations in richness. The performance of different treatments on richness estimation is best seen by plotting the difference between the true diversity of the community and the estimated diversity (Figs. 2a and S10–S11). In almost all treatments, the small library size led to an underestimate in richness at all but the lowest level of diversity. Medium library sizes perform better, particularly for the TRUE community, but still underestimate richness as the diversity increases. With large library sizes, ITS_ASV_Rolling, ITS_ASV and ITS_OTU all show good estimates of richness, except in the highest-diversity communities with strain-level differences. The treatments using only the forward reads never manage to provide an accurate estimate of richness. In contrast to the other treatments, FWD_OTU not only overestimates the richness, but the overestimate becomes more severe with increasing library size.
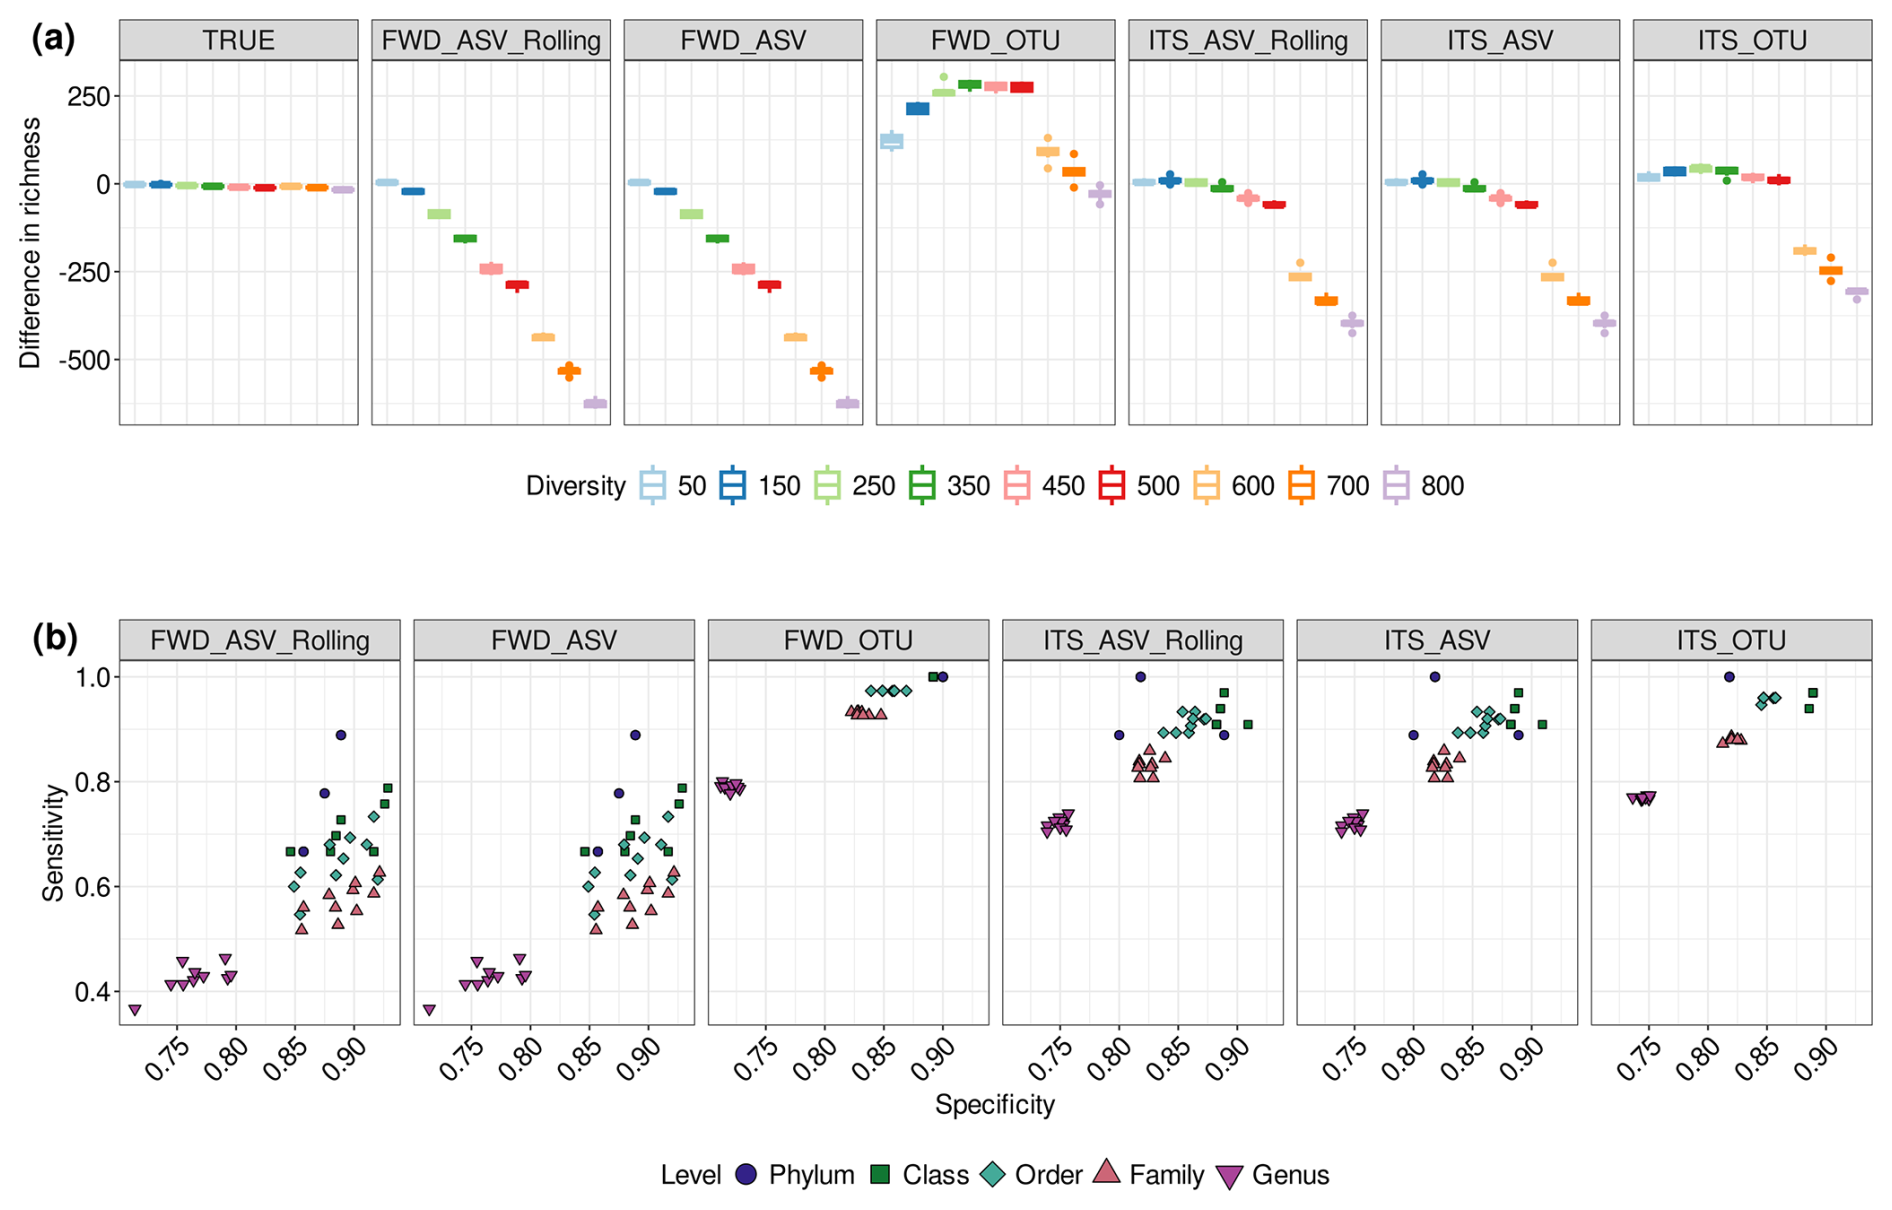
Figure 2Richness estimation errors, sensitivity and specificity for the ITS2 community with different treatments. (a) Boxplots showing the difference between the observed richness (estimated from the reads) and the true richness (the number of genomes used to simulate the sequencing) of the ITS2 communities under different treatments when the library size is large (50 000 reads). (b) Treatment-specific measures of sensitivity () and specificity () at different taxonomic levels when the library size is large and the community diversity is 500 genomes. The treatment abbreviations are explained in Table 1.
We did not see a large effect of library size on the Shannon (Figs. S12 and S13) or Simpson (Figs. S14 and S15) indices. Except for the FWD_ASV and FWD_ASV_Rolling treatments, all treatments gave an estimate that was similar to the TRUE treatment when there were no duplicate species, i.e. different sequenced genomes from the same species. In fact, the Simpson index showed very little variation at all.
3.1.3 Sensitivity and specificity
In our simulated data, except for the lowest diversity at medium and large library sizes, the FWD_ASV and FWD_ASV_Rolling treatments showed lower sensitivity under all tested conditions (Figs. 2b and S17–S18). The ITS_ASV and ITS_ASV_Rolling treatments performed better but had noticeably lower sensitivity than the OTU treatments. However, this difference was reduced when using large library sizes. With linear mixed-effect models, we saw that, on average, sensitivity of ITS-processed data was 12.7 % higher than that of FWD-processed data, and the sensitivity of OTU methods was 15.9 % higher than that of ASV methods. There was no statistical difference between ASV and ASV_Rolling methods.
In contrast, we found much less variation in specificity between treatments (Figs. S18 and S19). However, specificity does vary with taxonomic level, showing the best performance at the class level (Fig. 2b). Between different methods and processing, we saw only very small differences, with the biggest difference being ASVs having a 1.4 % higher average specificity than OTUs in ITS2, but this difference was reversed in ITS1.
3.1.4 Composition
Using distance/dissimilarities to compare the different treatments with the theoretical best results of the TRUE community (Figs. S20–S25), we identified a few general trends. First, the distance/dissimilarity increases with lower taxonomic levels (Fig. 3). Second, while there is much overlap between the standard deviation of the different treatments, the mean values of the FWD and ITS treatments tend to cluster together, with ITS treatments better approximating the TRUE community. We also found that, under certain conditions, the FWD_OTU treatment would cluster with the ITS treatments. Generally, ITS_OTU displayed the least difference from the TRUE treatment.
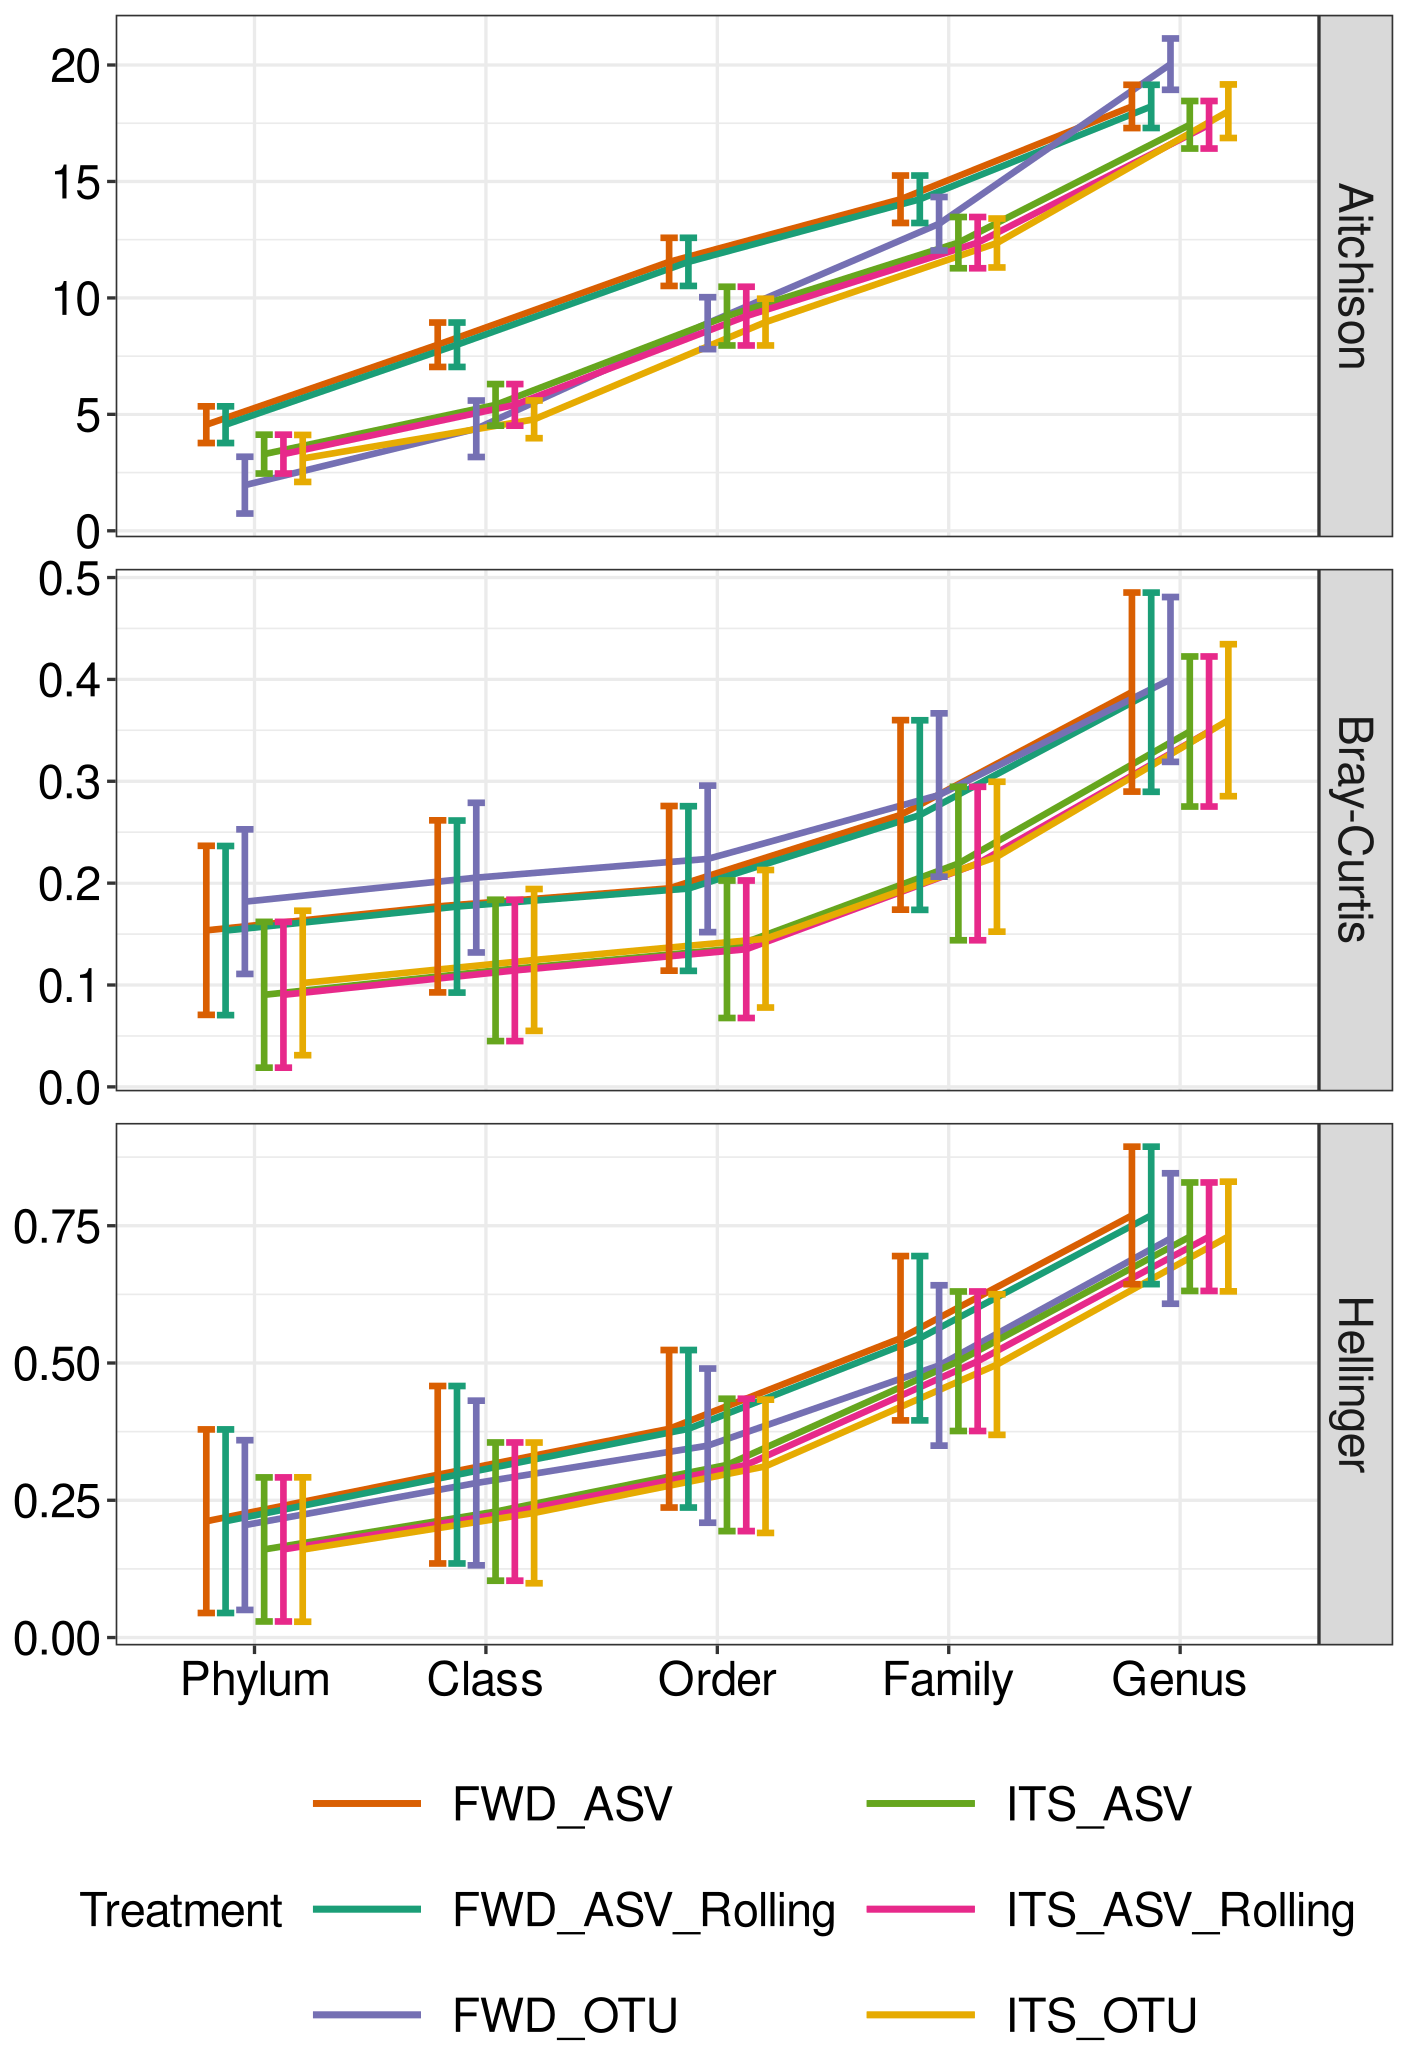
Figure 3Community composition assessed by distance from the TRUE community. Distances (Aitchison, Bray–Curtis and Hellinger) between ITS2 communities from the TRUE community with a diversity of 500 genomes and a large library size (50 000 reads). Error bars show standard deviation. The treatment abbreviations are explained in Table 1.
Statistical modelling to identify the key factors determining the distance from the TRUE community showed that the taxonomic level is consistently the most important factor (Figs. 4 and S26), with decreasing impact on Aitchison, Hellinger and, finally, Bray–Curtis distances. Although the other variables are nearly always significant, they tend not to explain a large proportion of the variation. There is an exception for Bray–Curtis distance, where treatment explains approximately 8 %–10 % of the variation in the short model. From the full model, we see that the primary contribution is due to processing, explaining 7 %–10 % of the total variation.
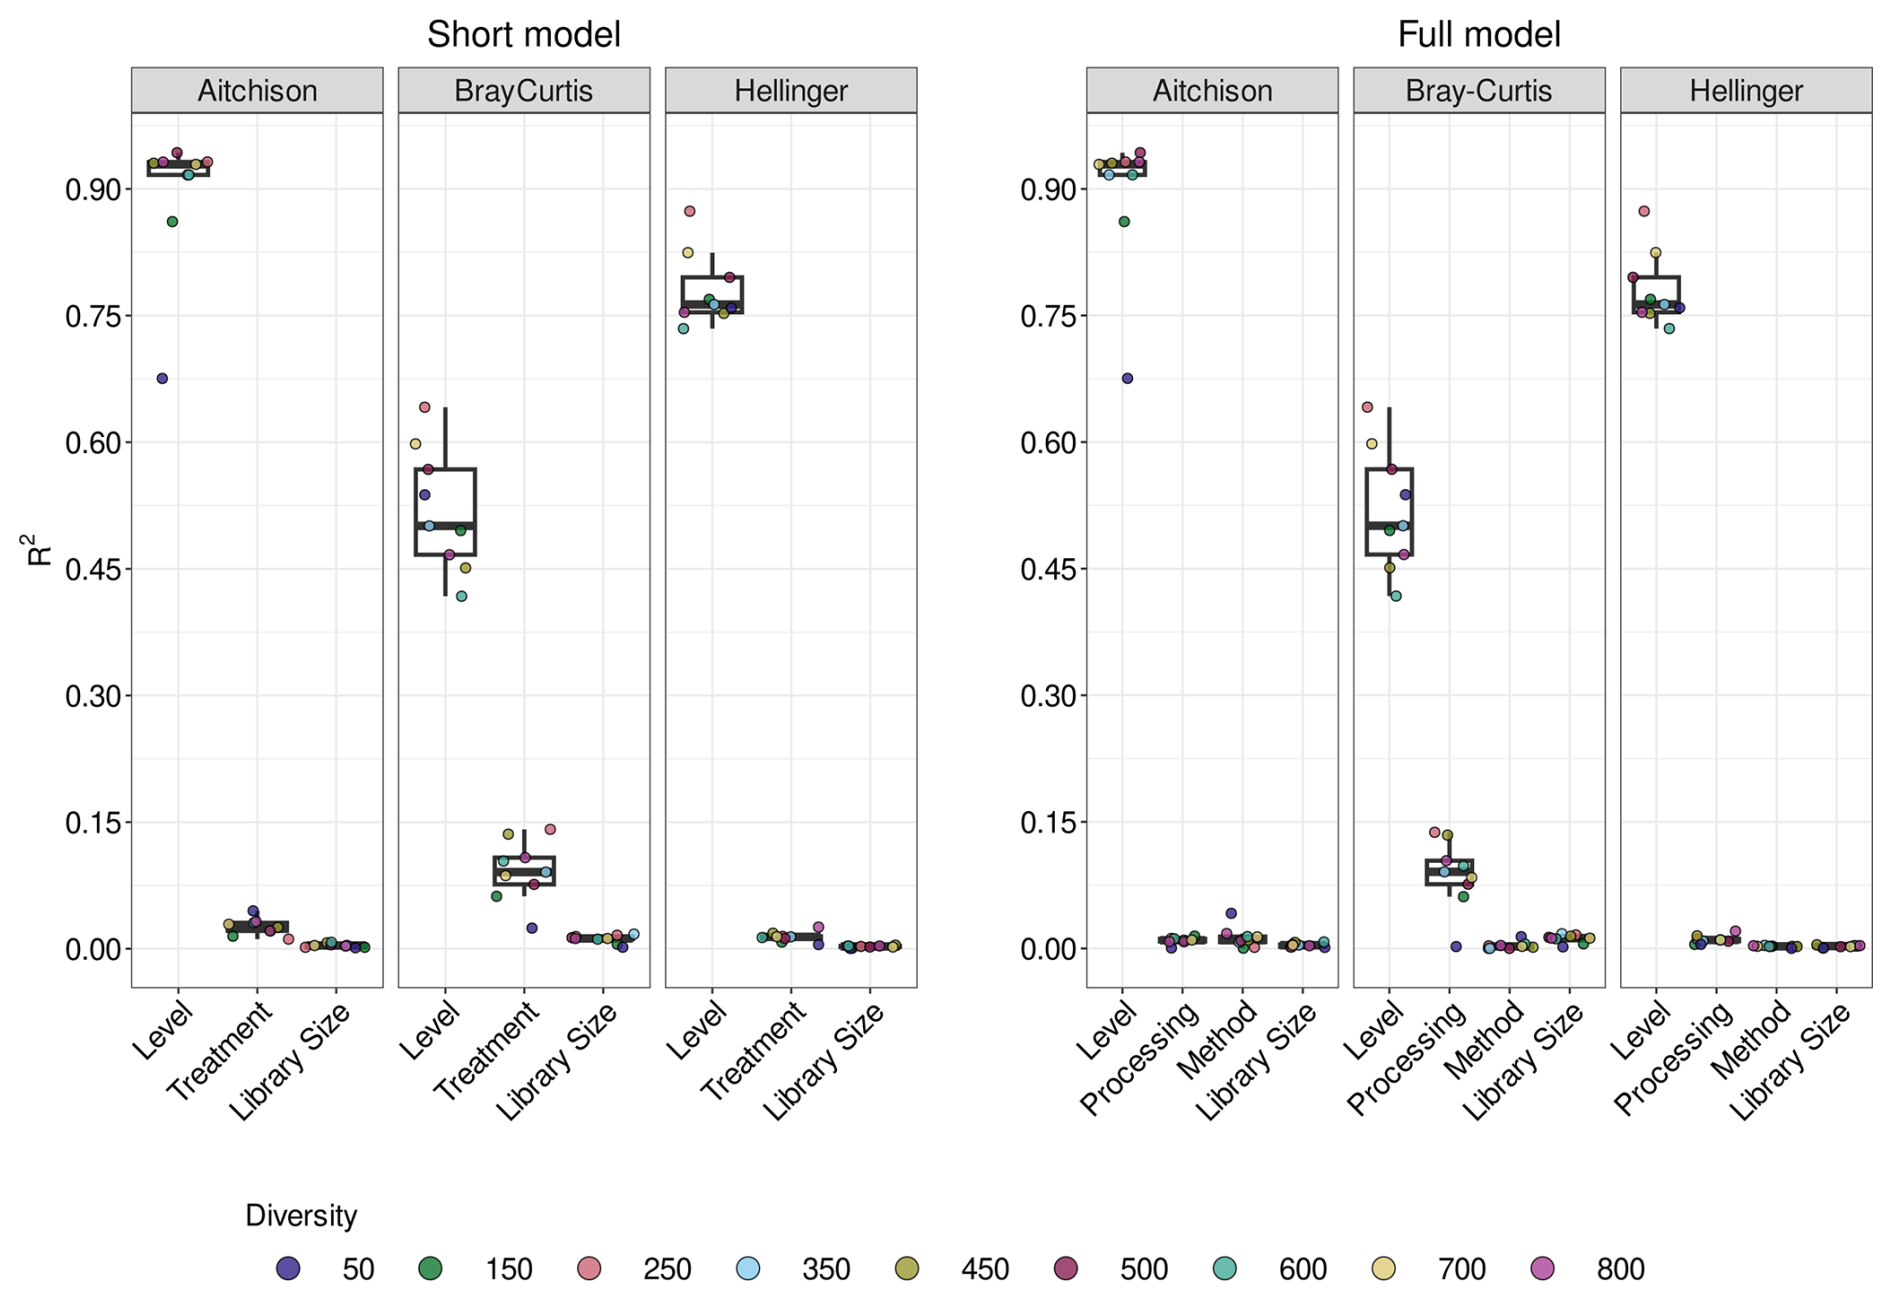
Figure 4Variation explained by factors in linear models. Boxplots of variation explained by different factors for either the short (treatment) or the full (method and processing) linear model for the ITS2 marker for communities of different diversity (number of fungal genomes). Residuals are not shown. The differences between treatment, method and processing are summarised in Table 1.
3.2 Reanalysis of Pauvert et al. (2019)
3.2.1 Taxonomy
The mock community of Pauvert et al. (2019) (Figs. S27–S31) is composed of 52.38 % Basidiomycota and 46.03 % Ascomycota. The most abundant orders are Agaricales (35.44 %), Hypocreales (13.22 %), Glomerellales (8.47 %), Helotiales (6.35 %), and Pleosporales and Russulales (both 5.82 %). At the genus level, the most abundant taxa are Fusarium (7.94 %), Colletotrichum (6.35 %) and Botrytis (4.76 %).
Due to knowing the composition of the mock community, we were able to identify specific taxa which were either missed or erroneously identified during the sequencing analysis. These details can be seen in the tables in the Supplement (Tables S1–S5). At the order level, taxa like Capnodiales, Pezizales, Amylocorticiales and Dacrymycetales were present in both the mock and the TRUE community but were not detected when analysing the sequencing data. Mortierellaceae and Mucorineae were present only in the mock community. Even more interesting were the taxa which were specific to certain methods; Ophiostomatales was present in the mock community and all the pipelines that used ITS-extracted reads, but it was in neither the TRUE community nor the treatments using only the forward reads. Similarly, Eurotiales and Tremellales were present in all treatments except for those using ITS-extracted reads.
At the genus level, the mock and TRUE communities were almost identical, suggesting that all genera should have been detected. However, in practice, some genera that should have been detected were not, and many genera that were detected were not present in either the mock or the TRUE communities. As with the order level, many taxa that should have been detected were specific to the processing; Clavariadelphus and Cosmospora were only detected when using FWD processing, and others, like Gliomastix, Metarhizium and Naevala, were only identified in the ITS-extracted samples.
3.2.2 Alpha diversity
We were able to fully capture the expected richness (189 fungal strains) in the TRUE community, indicating that it was theoretically possible, but all the treatments resulted in an underestimate of richness (Figs. S32 and S33). The underestimate was greatest in the ITS_ASV and ITS_ASV_Rolling treatments (median richness=125), and the best performance came from the FWD_OTU treatment (median richness=152). Similarly, all treatments underestimated the Shannon and Simpson indices (Figs. S34 and S35).
3.2.3 Sensitivity and specificity
FWD treatments were the most sensitive (Fig. S36), with average sensitivity scores higher than ITS treatments by 6.62 %. The percent of true taxa detected decreased with taxonomic depth, and there was no difference between FWD or ITS-extracted treatments at the family and genus level. Overall, we measured no significant difference between ASVs or OTUs.
The FWD treatments showed a peak in specificity at the order level (∼83 %), while ITS-extracted treatments were most accurate (∼86 %) at the family level (Fig. S37). ITS-extracted treatments maintained the best performance even at the genus level. However, statistically, there was no significant difference between any of the processing or methods overall.
3.2.4 Composition
The increase in Aitchison distance from the TRUE community as we tested lower taxonomic levels was linear, while Hellinger distance and Bray–Curtis dissimilarity resembled an exponential curve (Fig. 5). There was visible separation of the FWD and ITS-extracted treatments, but processing was only significant for Hellinger (, ) and Bray–Curtis (, ), not for Aitchison (, p=0.91). Method was also significant for Hellinger (, ) and Bray–Curtis (, p=0.02) but not Aitchison (, p=0.83).
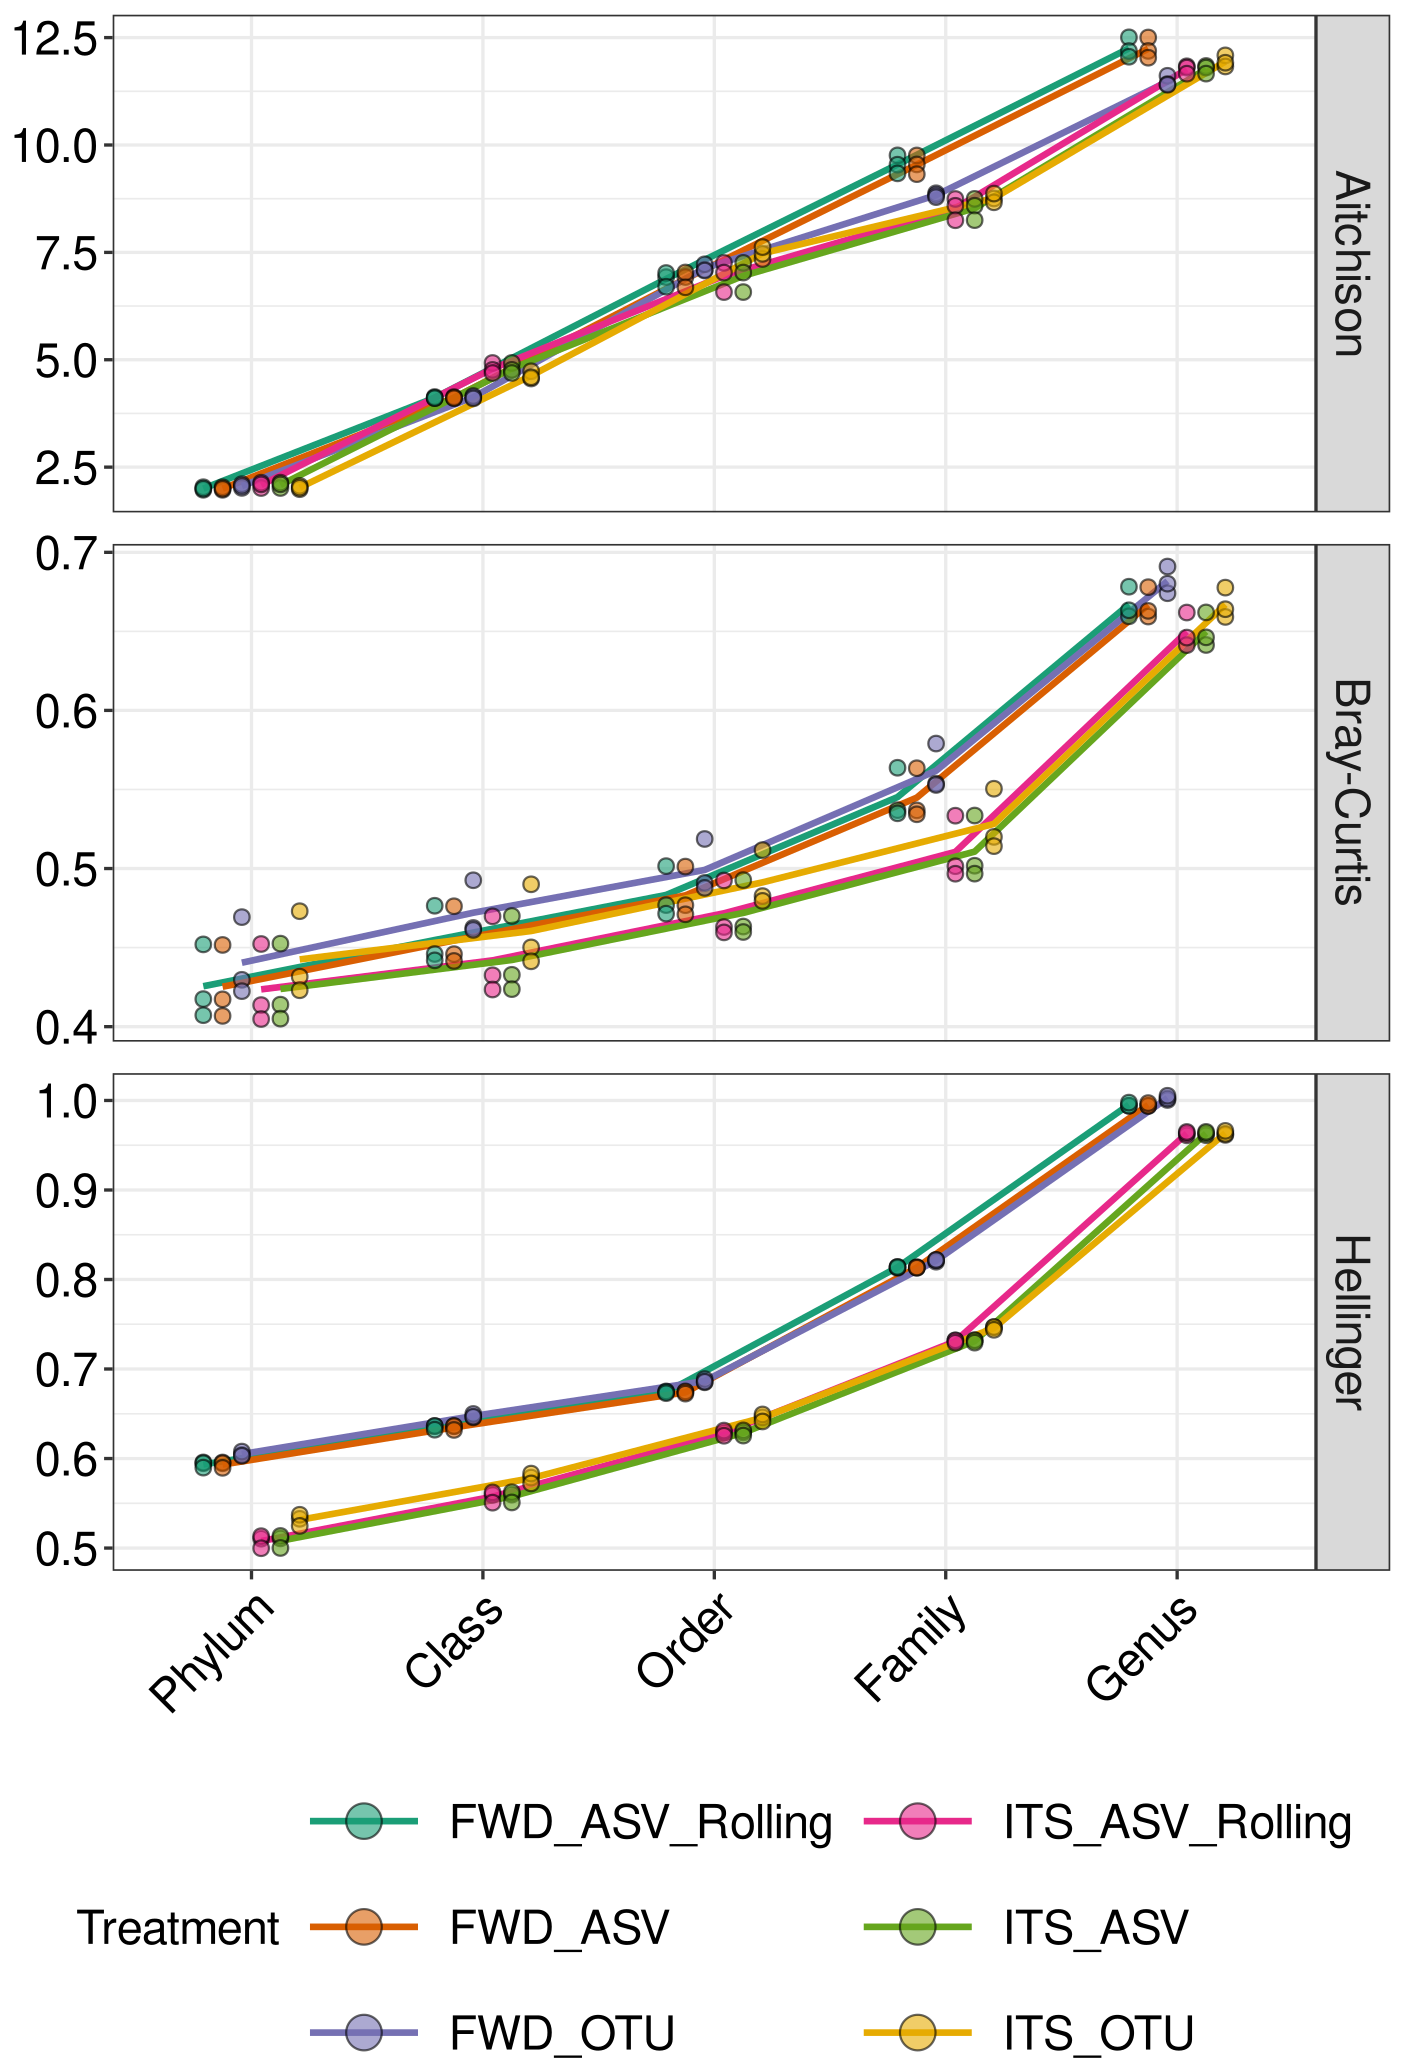
Figure 5Community composition of the Pauvert replicates assessed by distance from the TRUE community. Distances (Aitchison, Bray–Curtis and Hellinger) between ITS2 communities from the TRUE community. Each of the triplicate communities is indicated by a point. The treatment abbreviations are explained in Table 1.
4.1 Strengths and weaknesses
The major strength of this analysis is that, by using simulated sequences from whole genomes, we can achieve realistic levels of diversity and possess perfect knowledge of the community composition. Comparisons using real-world data are constrained by the fact that the ground truth is unknown, so, while differences between methods can be identified, it is not possible to tell which method gives a better approximation of the truth. Even mock communities suffer from this problem as differences in copy numbers and PCR biases mean that the abundances of the resulting sequences may not necessarily reflect the abundances of the cells which were mixed. That said, we also analysed a published mock community to test whether the results of the simulated communities were transferable to the real world.
While we believe our approach has several advantages compared to existing pipeline comparisons, we recognise two main limitations. First, our communities are not necessarily representative of the fungal diversity which is found in nature. Our communities are drawn only from those fungi which have been fully sequenced – a subset which is biased towards those that are simple to culture and of medical or commercial interest. Second, we have only addressed a limited number of ways in which sequence data could be processed; other studies have shown that there can be major differences in the results depending on your analysis decisions (Pauvert et al., 2019; Rzehak et al., 2024). However, we have tried to closely adhere to the analysis pipeline which we would use in practice, rather than trying combinations which might never be used. This is because our goal has not been to exhaustively explore all possible methods but to compare the results of using ASVs or OTUs for fungi. We hope that the comparisons remain valid regardless of the specific settings.
4.2 Fungal-specific changes to method parameters were unnecessary
Our ASV_Rolling treatment was designed to test the claims of Rolling et al. (2022) that fungal ASVs required modifications to the standard pipeline in order to maximise read retention and improve the quality of the results. The standard ASV pipeline used the default settings, which allowed for a maximum of two expected errors (maxEE=2, for the function filterAndTrim()) and truncated reads at the first base with a quality score≤2, while ASV_Rolling allowed a maximum of 8 expected errors and truncated reads at the first base with a quality score≤8. In our tests, we did not see a statistically significant difference in the number of reads retained for either our simulated data or the sequencing of a mock community prepared by Pauvert et al. (2019) (Figs. S1 and S2). While there may be a slight reduction in the distance between the TRUE community and the ASV_Rolling methods (Fig. 2), the two methods gave essentially identical results. This echoes recent results testing various parameters for 16S metabarcoding, where changing the maximum expected errors for ASV generation did decrease the UniFrac distance, but the distances were not significant (Nayman et al., 2023). Therefore, we do not see any pressing reason to recommend changing the default values when generating fungal ASVs.
4.3 Richness estimates require large library sizes and ITS extraction
In contrast to studies which predict increased richness from ASVs (Estensmo et al., 2021), we found that ASVs consistently underestimated richness, while OTUs tended to overestimate richness, particularly if ITS extraction was not performed, although this was dependent on the library size (Figs. S10 and S11). Our results align with many other studies that show that, in practice, ASVs estimate lower levels of richness than OTUs do (Pauvert et al., 2019; Joos et al., 2020). However, large library sizes, along with ITS extraction, resulted in both ASV and OTU methods giving roughly the same accurate richness in our simulated communities (Fig. 2). Large library sizes should now be standard for most metagenomic sequencing projects due to technological advances. We recommend merging fungal reads and performing ITS extraction, unless there is a compelling reason to use unidirectional reads, such as poor-quality reverse reads or species whose ITS region is too long for short-read sequencing. Members of the family Cantharellaceae have ITS1 lengths up to approximately 1100 bases (Feibelman et al., 1994), and the plant pathogenic oomycete Plasmopara halstedii has an ITS2 region of approximately 2200 bases (Thines et al., 2005), both of which will be missed by an approach that merges short reads.
While standard short reads were adequate for resolving species richness, they lacked the resolution to accurately measure richness when the community included strains of the same species. This can be seen as a discontinuity in the richness graphs at the 500- or 600-genome diversity levels for ITS1 and ITS2 respectively (Figs. S8–S11). We also saw that we underestimated community richness in the Pauvert et al. (2019) data, even with OTU methods. This can partially be explained by the fact that the Pauvert et al. (2019) community includes multiple strains of certain species, with 14 of the fungi having identical marker sequences to other members of the community (Pauvert et al., 2019). Strain-level identification must be achieved with full-length ITS sequences, or other markers, as has been shown for full-length bacterial 16S sequences (Callahan et al., 2019; Johnson et al., 2019).
4.4 Sensitivity is affected by read processing and analysis method
While differences in specificity were minimal between treatments, both processing and method had statistically significant effects on sensitivity in our simulated communities, with OTU clustering and ITS extraction leading to the greatest sensitivity. ITS extraction is likely more sensitive than FWD due to the increased information of the joined reads, while the greater sensitivity in OTU clustering is likely due to the increased richness compared to ASVs. This suggests that OTU approaches may be favoured in cases where it is important to identify a specific taxon, but ASV approaches should be favoured when the goal is to minimise false positives.
4.5 Read processing affects taxonomy composition more than the choice of ASVs or OTUs
We measured the distance from the TRUE community as a way to quantify the similarity in community composition – an identical community should have zero distance. We then determined which of our experimental parameters were influencing the distances. Aside from taxonomic level, the greatest explanatory power was due to read processing, with the largest effect in the commonly used Bray–Curtis dissimilarity (Figs. 4 and S26).
A close examination of the mock communities of Pauvert et al. (2019) did not show any orders (Table S3) or genera (Table S5) which were specific to either ASVs or OTUs. However, we identified several taxa which were specific to processing only the forward reads or merging and performing ITS extraction. This agrees with previous studies that found that ASVs and OTUs share the majority of taxa (Rzehak et al., 2024) and has important practical implications. If the goal of a study is to identify a specific taxon, e.g. pathogen surveillance, then it may be advisable to analyse the metagenomic data with both FWD and ITS processing to maximise the chances of correctly identifying the taxon of interest.
4.6 Differences from Pauvert et al. (2019)
The mock community that we used was originally presented by Pauvert et al. (2019) as part of an analysis of 260 bioinformatics pipelines. Their final recommendation was to use only forward reads and create ASVs with DADA2, while stating that ITS extraction was unnecessary. Our analysis of simulated communities and reanalysis of the same mock communities came to very different conclusions, but we believe there are several technological and methodological reasons for this.
The original analysis merged reads with fastq-join using either 50-, 100- or 150-base overlaps with no mismatches. This differs from our approach, based on SEED 2 (Větrovský et al., 2018), which also used fastq-join but only required a minimum overlap of 40 bases with a maximum difference of 15 %, i.e. 6 bases. These more relaxed requirements likely allowed many more reads to be joined and sent for ITS extraction. The original ITS extraction procedure made use of ITSx (Nilsson et al., 2010; Bengtsson-Palme et al., 2013) compared to our use here of ITSxpress (Rivers et al., 2018), which maintains the sequencing quality scores for downstream applications. The combination of these factors may explain why we found ITS extraction to be highly relevant and the original study did not.
In addition, the original study made use of a custom database of Sanger sequences of the relevant ITS1 regions in order to assign taxonomy. While this is a perfectly good way to identify sequences, it differs substantially from the procedures that are commonly used in environmental microbiology, where we do not know which taxa are present, whether they are in our database and where the database contains several other taxa. Of the 189 strains in the mock community, there were 14 exact matches to other members of the mock community. In practice, we made use of UNITE version 9 (Nilsson et al., 2019; Abarenkov et al., 2022) with 19 000 fungal taxa. The larger databases used in microbial ecology will include many more exact matches, limiting the taxonomic level which can be confidently assigned, and increase the risk of falsely matching another taxon due to PCR or sequencing errors.
Based on our results, we make the following recommendations for environmental microbiology studies using short-read fungal ITS data.
-
Prioritise large library sizes, e.g. 50 000 reads per sample, as larger library sizes were shown to improve performance. Thanks to improvements in sequencing technology, this should be achievable with little effort.
-
Unless there is a specific reason to only use forward reads, join forward and reverse reads, then perform ITS extraction.
-
Fears of ASVs greatly overinflating richness are unfounded for most taxa. For most cases, the choice of OTUs or ASVs should have only minimal effects, but OTUs are likely to perform slightly better.
In short, we recommend sequencing with as large a library size as possible, joining the reads to perform ITS extraction and then clustering the sequences into OTUs.
All scripts required to reproduce the analysis are available on GitHub (https://github.com/jasonbosch/ Decoding-Fungal-Communities-ITS-Extraction-Matters-More-Than-ASVs-vs-OTUs, last access: 10 December 2025). The communities, sequences and other data that were used in the analysis are available on Zenodo (https://doi.org/10.5281/zenodo.17853852, Tosadori and Bosch, 2025).
The supplement related to this article is available online at https://doi.org/10.5194/we-26-47-2026-supplement.
GT and JB were both involved in all stages of the work through conceptualisation, formal analysis, investigation, methodology, visualisation and writing.
The contact author has declared that neither of the authors has any competing interests.
Publisher's note: Copernicus Publications remains neutral with regard to jurisdictional claims made in the text, published maps, institutional affiliations, or any other geographical representation in this paper. The authors bear the ultimate responsibility for providing appropriate place names. Views expressed in the text are those of the authors and do not necessarily reflect the views of the publisher.
We would like to thank the Laboratory of Environmental Microbiology of the Institute of Microbiology, Czech Academy of Sciences, for providing computational resources. In addition, we want to thank Priscila Thiago Dobbler and Lukas Bell-Dereske for their helpful discussions and Tomáš Větrovský for providing feedback on the draft manuscript.
Gabriele Tosadori and Jason Bosch were supported by the Response of microbial communities to changing climate in Arctic tundra soils (21-19209M) grant from the Czech Science Foundation awarded to Jana Voříšková.
This paper was edited by Adrian Brennan and reviewed by two anonymous referees.
Abarenkov, K., Zirk, A., Piirmann, T., Pöhönen, R., Ivanov, F., Nilsson, R. H., and Kõljalg, U.: UNITE QIIME release for Fungi 2, https://doi.org/10.15156/BIO/2483916, 2022.
Angly, F. E., Willner, D., Rohwer, F., Hugenholtz, P., and Tyson, G. W.: Grinder: a versatile amplicon and shotgun sequence simulator, Nucleic Acids Res., 40, e94, https://doi.org/10.1093/nar/gks251, 2012.
Aronesty, E.: Comparison of sequencing utility programs, Open Bioinforma. J., 7, 1–8, https://doi.org/10.2174/1875036201307010001, 2013.
Bengtsson-Palme, J., Ryberg, M., Hartmann, M., Branco, S., Wang, Z., Godhe, A., De Wit, P., Sánchez-García, M., Ebersberger, I., de Sousa, F., Amend, A. S., Jumpponen, A., Unterseher, M., Kristiansson, E., Abarenkov, K., Bertrand, Y. J. K., Sanli, K., Eriksson, K. M., Vik, U., Veldre, V., and Nilsson, R. H.: Improved software detection and extraction of ITS1 and ITS2 from ribosomal ITS sequences of fungi and other eukaryotes for analysis of environmental sequencing data, Methods Ecol. Evol., https://doi.org/10.1111/2041-210X.12073, 2013.
Blaalid, R., Kumar, S., Nilsson, R. H., Abarenkov, K., Kirk, P. M., and Kauserud, H.: ITS1 versus ITS2 as DNA metabarcodes for fungi, Mol. Ecol. Resour., 13, 218–224, https://doi.org/10.1111/1755-0998.12065, 2013.
Bolger, A. M., Lohse, M., and Usadel, B.: Trimmomatic: a flexible trimmer for Illumina sequence data, Bioinformatics, 30, 2114–2120, https://doi.org/10.1093/bioinformatics/btu170, 2014.
Bolyen, E., Rideout, J. R., Dillon, M. R., Bokulich, N. A., Abnet, C. C., Al-Ghalith, G. A., Alexander, H., Alm, E. J., Arumugam, M., Asnicar, F., Bai, Y., Bisanz, J. E., Bittinger, K., Brejnrod, A., Brislawn, C. J., Brown, C. T., Callahan, B. J., Caraballo-Rodríguez, A. M., Chase, J., Cope, E. K., Da Silva, R., Diener, C., Dorrestein, P. C., Douglas, G. M., Durall, D. M., Duvallet, C., Edwardson, C. F., Ernst, M., Estaki, M., Fouquier, J., Gauglitz, J. M., Gibbons, S. M., Gibson, D. L., Gonzalez, A., Gorlick, K., Guo, J., Hillmann, B., Holmes, S., Holste, H., Huttenhower, C., Huttley, G. A., Janssen, S., Jarmusch, A. K., Jiang, L., Kaehler, B. D., Kang, K. B., Keefe, C. R., Keim, P., Kelley, S. T., Knights, D., Koester, I., Kosciolek, T., Kreps, J., Langille, M. G. I., Lee, J., Ley, R., Liu, Y., Loftfield, E., Lozupone, C., Maher, M., Marotz, C., Martin, B. D., McDonald, D., McIver, L. J., Melnik, A. V., Metcalf, J. L., Morgan, S. C., Morton, J. T., Naimey, A. T., Navas-Molina, J. A., Nothias, L. F., Orchanian, S. B., Pearson, T., Peoples, S. L., Petras, D., Preuss, M. L., Pruesse, E., Rasmussen, L. B., Rivers, A., Robeson, M. S., Rosenthal, P., Segata, N., Shaffer, M., Shiffer, A., Sinha, R., Song, S. J., Spear, J. R., Swafford, A. D., Thompson, L. R., Torres, P. J., Trinh, P., Tripathi, A., Turnbaugh, P. J., Ul-Hasan, S., van der Hooft, J. J. J., Vargas, F., Vázquez-Baeza, Y., Vogtmann, E., von Hippel, M., Walters, W., Wan, Y., Wang, M., Warren, J., Weber, K. C., Williamson, C. H. D., Willis, A. D., Xu, Z. Z., Zaneveld, J. R., Zhang, Y., Zhu, Q., Knight, R., and Caporaso, J. G.: Reproducible, interactive, scalable and extensible microbiome data science using QIIME 2, Nat. Biotechnol., 37, 852–857, https://doi.org/10.1038/s41587-019-0209-9, 2019.
Callahan, B. J., McMurdie, P. J., Rosen, M. J., Han, A. W., Johnson, A. J. A., and Holmes, S. P.: DADA2: High-resolution sample inference from Illumina amplicon data, Nat. Methods, 13, 581–583, https://doi.org/10.1038/nmeth.3869, 2016.
Callahan, B. J., McMurdie, P. J., and Holmes, S. P.: Exact sequence variants should replace operational taxonomic units in marker-gene data analysis, ISME J., 11, 2639–2643, https://doi.org/10.1038/ismej.2017.119, 2017.
Callahan, B. J., Wong, J., Heiner, C., Oh, S., Theriot, C. M., Gulati, A. S., McGill, S. K., and Dougherty, M. K.: High-throughput amplicon sequencing of the full-length 16S rRNA gene with single-nucleotide resolution, Nucleic Acids Res., 47, e103, https://doi.org/10.1093/nar/gkz569, 2019.
Cameron, E. S., Schmidt, P. J., Tremblay, B. J.-M., Emelko, M. B., and Müller, K. M.: Enhancing diversity analysis by repeatedly rarefying next generation sequencing data describing microbial communities, Sci. Rep., 11, 22302, https://doi.org/10.1038/s41598-021-01636-1, 2021.
Campitelli, E.: ggnewscale: Multiple fill and colour scales in “ggplot2”, CRAN [code], https://doi.org/10.32614/CRAN.package.ggnewscale, 2025.
Chen, B., He, X., Pan, B., Zou, X., and You, N.: Comparison of beta diversity measures in clustering the high-dimensional microbial data, PLOS ONE, 16, e0246893, https://doi.org/10.1371/journal.pone.0246893, 2021.
De Muinck, E. J., Trosvik, P., Gilfillan, G. D., Hov, J. R., and Sundaram, A. Y. M.: A novel ultra high-throughput 16S rRNA gene amplicon sequencing library preparation method for the Illumina HiSeq platform, Microbiome, 5, 68, https://doi.org/10.1186/s40168-017-0279-1, 2017.
Edgar, R. C.: UNOISE2: improved error-correction for Illumina 16S and ITS amplicon sequencing, bioRxiv, 081257, https://doi.org/10.1101/081257, 2016.
Estensmo, E. L. F., Maurice, S., Morgado, L., Martin-Sanchez, P. M., Skrede, I., and Kauserud, H.: The influence of intraspecific sequence variation during DNA metabarcoding: A case study of eleven fungal species, Mol. Ecol. Resour., 21, 1141–1148, https://doi.org/10.1111/1755-0998.13329, 2021.
Feibelman, T., Bayman, P., and Cibula, W. G.: Length variation in the internal transcribed spacer of ribosomal DNA in chanterelles, Mycol. Res., 98, 614–618, https://doi.org/10.1016/S0953-7562(09)80407-3, 1994.
García-López, R., Cornejo-Granados, F., Lopez-Zavala, A. A., Cota-Huízar, A., Sotelo-Mundo, R. R., Gómez-Gil, B., and Ochoa-Leyva, A.: OTUs and ASVs produce comparable taxonomic and diversity from shrimp microbiota 16S profiles using tailored abundance filters, Genes-Basel, 12, 564, https://doi.org/10.3390/genes12040564, 2021.
Garnier, S., Ross, N., Rudis, R., Camargo A. P., Sciaini, M., and Scherer, C.: viridis(Lite) – Colorblind-friendly color maps for R, Zenodo [code], https://doi.org/10.5281/zenodo.4679423, 2024.
Glassman, S. I. and Martiny, J. B. H.: Broadscale ecological patterns are robust to use of exact sequence variants versus operational taxonomic units, mSphere, 3, e00148-18, https://doi.org/10.1128/mSphere.00148-18, 2018.
Gloor, G. B., Macklaim, J. M., Pawlowsky-Glahn, V., and Egozcue, J. J.: Microbiome datasets are compositional: And this is not optional, Front. Microbiol., 8, 2224, https://doi.org/10.3389/fmicb.2017.02224, 2017.
Graves, S., Piepho, H., Selzer, L., and Dorai-Raj, S.: multcompView: Visualizations of paired comparisons, CRAN [code], https://CRAN.R-project.org/package=multcompView (last access: 25 April 2024), 2024.
Hothorn, T., Bretz, F., and Westfall, P.: Simultaneous inference in general parametric models, Biom. J., 50, 346–363, 2008.
Ihrmark, K., Bödeker, I. T. M., Cruz-Martinez, K., Friberg, H., Kubartova, A., Schenck, J., Strid, Y., Stenlid, J., Brandström-Durling, M., Clemmensen, K. E., and Lindahl, B. D.: New primers to amplify the fungal ITS2 region – evaluation by 454-sequencing of artificial and natural communities, FEMS Microbiol. Ecol., 82, 666–677, https://doi.org/10.1111/j.1574-6941.2012.01437.x, 2012.
Johnson, J. S., Spakowicz, D. J., Hong, B.-Y., Petersen, L. M., Demkowicz, P., Chen, L., Leopold, S. R., Hanson, B. M., Agresta, H. O., Gerstein, M., Sodergren, E., and Weinstock, G. M.: Evaluation of 16S rRNA gene sequencing for species and strain-level microbiome analysis, Nat. Commun., 10, 5029, https://doi.org/10.1038/s41467-019-13036-1, 2019.
Joos, L., Beirinckx, S., Haegeman, A., Debode, J., Vandecasteele, B., Baeyen, S., Goormachtig, S., Clement, L., and De Tender, C.: Daring to be differential: metabarcoding analysis of soil and plant-related microbial communities using amplicon sequence variants and operational taxonomical units, BMC Genomics, 21, 733, https://doi.org/10.1186/s12864-020-07126-4, 2020.
Kassambara, A.: ggpubr: “ggplot2” based publication ready plots, CRAN [code], https://CRAN.R-project.org/package=ggpubr (last access: 25 April 2024), 2023.
Kauserud, H.: ITS alchemy: On the use of ITS as a DNA marker in fungal ecology, Fungal Ecol., 101274, https://doi.org/10.1016/j.funeco.2023.101274, 2023.
Latz, M. A. C., Grujcic, V., Brugel, S., Lycken, J., John, U., Karlson, B., Andersson, A., and Andersson, A. F.: Short- and long-read metabarcoding of the eukaryotic rRNA operon: Evaluation of primers and comparison to shotgun metagenomics sequencing, Mol. Ecol. Resour., 22, 2304–2318, https://doi.org/10.1111/1755-0998.13623, 2022.
Legendre, P. and Gallagher, E. D.: Ecologically meaningful transformations for ordination of species data, Oecologia, 129, 271–280, https://doi.org/10.1007/s004420100716, 2001.
Lofgren, L. A., Uehling, J. K., Branco, S., Bruns, T. D., Martin, F., and Kennedy, P. G.: Genome-based estimates of fungal rDNA copy number variation across phylogenetic scales and ecological lifestyles, Mol. Ecol., 28, 721–730, https://doi.org/10.1111/mec.14995, 2019.
McMurdie, P. J. and Holmes, S.: phyloseq: An R package for reproducible interactive analysis and graphics of microbiome census data, PLoS ONE, 8, e61217, https://doi.org/10.1371/journal.pone.0061217, 2013.
Mills, B. R.: MetBrewer: Color palettes inspired by works at the Metropolitan Museum of Art, CRAN [code], https://CRAN.R-project.org/package=MetBrewer (last access: 25 April 2024), 2022.
Nayman, E. I., Schwartz, B. A., Polanco, F. C., Firek, A. K., Gumabong, A. C., Hofstee, N. J., Narasimhan, G., Cickovski, T., and Mathee, K.: Microbiome depiction through user-adapted bioinformatic pipelines and parameters, J. Med. Microbiol., 72, https://doi.org/10.1099/jmm.0.001756, 2023.
Neuwirth, E.: RColorBrewer: ColorBrewer palettes, CRAN [code], https://CRAN.R-project.org/package=RColorBrewer (last access: 25 April 2024), 2022.
Nguyen, N. H., Smith, D., Peay, K., and Kennedy, P.: Parsing ecological signal from noise in next generation amplicon sequencing, New Phytol., 205, 1389–1393, 2015.
Nilsson, R. H., Kristiansson, E., Ryberg, M., Hallenberg, N., and Larsson, K.-H.: Intraspecific ITS variability in the kingdom fungi as expressed in the international sequence databases and its implications for molecular species identification, Evol. Bioinform., 4, EBO.S653, https://doi.org/10.4137/EBO.S653, 2008.
Nilsson, R. H., Veldre, V., Hartmann, M., Unterseher, M., Amend, A., Bergsten, J., Kristiansson, E., Ryberg, M., Jumpponen, A., and Abarenkov, K.: An open source software package for automated extraction of ITS1 and ITS2 from fungal ITS sequences for use in high-throughput community assays and molecular ecology, Fungal Ecol., 3, 284–287, https://doi.org/10.1016/j.funeco.2010.05.002, 2010.
Nilsson, R. H., Larsson, K.-H., Taylor, A. F. S., Bengtsson-Palme, J., Jeppesen, T. S., Schigel, D., Kennedy, P., Picard, K., Glöckner, F. O., Tedersoo, L., Saar, I., Kõljalg, U., and Abarenkov, K.: The UNITE database for molecular identification of fungi: handling dark taxa and parallel taxonomic classifications, Nucleic Acids Res., 47, D259–D264, https://doi.org/10.1093/nar/gky1022, 2019.
Ogle, D. H., Doll, J. C., Wheeler, A. P., and Dinno, A.: FSA: Simple fisheries stock assessment methods, CRAN [code], https://CRAN.R-project.org/package=FSA (last access: 25 April 2024), 2023.
Oksanen, J., Simpson, G. L., Blanchet, F. G., Kindt, R., Legendre, P., Minchin, P. R., O'Hara, R. B., Solymos, P., Stevens, M. H. H., Szoecs, E., Wagner, H., Barbour, M., Bedward, M., Bolker, B., Borcard, D., Carvalho, G., Chirico, M., Caceres, M. D., Durand, S., Evangelista, H. B. A., FitzJohn, R., Friendly, M., Furneaux, B., Hannigan, G., Hill, M. O., Lahti, L., McGlinn, D., Ouellette, M.-H., Cunha, E. R., Smith, T., Stier, A., Braak, C. J. F. T., and Weedon, J.: vegan: Community ecology package, CRAN [code], https://CRAN.R-project.org/package=vegan (last access: 25 April 2024), 2022.
Pauvert, C., Buée, M., Laval, V., Edel-Hermann, V., Fauchery, L., Gautier, A., Lesur, I., Vallance, J., and Vacher, C.: Bioinformatics matters: The accuracy of plant and soil fungal community data is highly dependent on the metabarcoding pipeline, Fungal Ecol., 41, 23–33, https://doi.org/10.1016/j.funeco.2019.03.005, 2019.
Pinheiro, J., Bates, D., and R Core Team: nlme: Linear and nonlinear mixed effects models, CRAN [code], https://doi.org/10.32614/CRAN.package.nlme, 2025.
Pinheiro, J. C. and Bates, D. M.: Mixed-effects models in S and S-PLUS, Springer, New York, https://doi.org/10.1007/b98882, 2000.
Quast, C., Pruesse, E., Yilmaz, P., Gerken, J., Schweer, T., Yarza, P., Peplies, J., and Glöckner, F. O.: The SILVA ribosomal RNA gene database project: improved data processing and web-based tools, Nucleic Acids Res., 41, D590–D596, https://doi.org/10.1093/nar/gks1219, 2013.
R Core Team: R: A language and environment for statistical computing, R Foundation for Statistical Computing, Vienna, Austria, https://www.R-project.org/ (last access: 14 June 2024), 2024.
Rice, P., Longden, I., and Bleasby, A.: EMBOSS: The European Molecular Biology Open Software Suite, Trends Genet., 16, 276–277, https://doi.org/10.1016/S0168-9525(00)02024-2, 2000.
Ricotta, C.: Can we trust the chord (and the Hellinger) distance?, Community Ecol., 20, 104–106, https://doi.org/10.1556/168.2019.20.1.11, 2019.
Rivers, A. R., Weber, K. C., Gardner, T. G., Liu, S., and Armstrong, S. D.: ITSxpress: Software to rapidly trim internally transcribed spacer sequences with quality scores for marker gene analysis, F1000Research, 7, 1418, https://doi.org/10.12688/f1000research.15704.1, 2018.
Robeson, M. S., O'Rourke, D. R., Kaehler, B. D., Ziemski, M., Dillon, M. R., Foster, J. T., and Bokulich, N. A.: RESCRIPt: Reproducible sequence taxonomy reference database management, PLOS Comput. Biol., 17, e1009581, https://doi.org/10.1371/journal.pcbi.1009581, 2021.
Rognes, T., Flouri, T., Nichols, B., Quince, C., and Mahé, F.: VSEARCH: a versatile open source tool for metagenomics, PeerJ, 4, e2584, https://doi.org/10.7717/peerj.2584, 2016.
Rolling, T., Zhai, B., Frame, J., Hohl, T. M., and Taur, Y.: Customization of a DADA2-based pipeline for fungal internal transcribed spacer 1 (ITS1) amplicon data sets, JCI Insight, 7, https://doi.org/10.1172/jci.insight.151663, 2022.
Rzehak, T., Praeg, N., Galla, G., Seeber, J., Hauffe, H. C., and Illmer, P.: Comparison of commonly used software pipelines for analyzing fungal metabarcoding data, BMC Genomics, 25, 1085, https://doi.org/10.1186/s12864-024-11001-x, 2024.
Schirmer, M., D'Amore, R., Ijaz, U. Z., Hall, N., and Quince, C.: Illumina error profiles: resolving fine-scale variation in metagenomic sequencing data, BMC Bioinformatics, 17, 125, https://doi.org/10.1186/s12859-016-0976-y, 2016.
Schloss, P. D.: Waste not, want not: Revisiting the analysis that called into question the practice of rarefaction, bioRxiv, https://doi.org/10.1101/2023.06.23.546312, 2023.
Simonsohn, U. and Gruson, H.: groundhog: Version-control for CRAN, GitHub, and GitLab packages, CRAN [code], https://CRAN.R-project.org/package=groundhog (last access: 25 April 2024), 2023.
Slowikowski, K.: ggrepel: Automatically position non-overlapping text labels with “ggplot2”, CRAN [code], https://CRAN.R-project.org/package=ggrepel (last access: 25 April 2024), 2024.
Steenwyk, J. L.: ggpubfigs: ggpubfigs, GitHub [code], https://github.com/JLSteenwyk/ggpubfigs (last access: 25 April 2024), 2024.
Stoler, N. and Nekrutenko, A.: Sequencing error profiles of Illumina sequencing instruments, NAR Genomics Bioinforma., 3, lqab019, https://doi.org/10.1093/nargab/lqab019, 2021.
Tedersoo, L., Bahram, M., Zinger, L., Nilsson, R. H., Kennedy, P. G., Yang, T., Anslan, S., and Mikryukov, V.: Best practices in metabarcoding of fungi: from experimental design to results, Mol. Ecol., https://doi.org/10.1111/mec.16460, 2022.
Thines, M., Komjáti, H., and Spring, O.: Exceptional length of ITS in Plasmopara halstedii is due to multiple repetitions in the ITS-2 region, Eur. J. Plant Pathol., 112, 395–398, https://doi.org/10.1007/s10658-005-6606-6, 2005.
Tipton, L., Zahn, G. L., Darcy, J. L., Amend, A. S., and Hynson, N. A.: Hawaiian fungal amplicon sequence variants reveal otherwise hidden biogeography, Microb. Ecol., 83, 48–57, https://doi.org/10.1007/s00248-021-01730-x, 2022.
Tosadori, G. and Bosch, J.: Data for Decoding Fungal Communities: ITS Extraction Matters More Than ASVs vs OTUs, Zenodo [data set], https://doi.org/10.5281/zenodo.17853852, 2025.
Větrovský, T., Baldrian, P., and Morais, D.: SEED 2: a user-friendly platform for amplicon high-throughput sequencing data analyses, Bioinformatics, 34, 2292–2294, https://doi.org/10.1093/bioinformatics/bty071, 2018.
Wickham, H.: ggplot2: Elegant graphics for data analysis, Springer-Verlag New York, ISVB 978-3-319-24277-4, https://ggplot2.tidyverse.org (last access: 25 April 2024), 2016.
Wickham, H.: stringr: Simple, consistent wrappers for common string operations, CRAN [code], https://doi.org/10.32614/CRAN.package.stringr, 2023.
Wickham, H., François, R., Henry, L., Müller, K., and Vaughan, D.: dplyr: A grammar of data manipulation, CRAN [code], https://CRAN.R-project.org/package=dplyr (last access: 25 April 2024), 2023.
Wilke, C. O.: cowplot: Streamlined plot theme and plot annotations for “ggplot2”, CRAN [code], https://CRAN.R-project.org/package=cowplot (last access: 25 April 2024), 2024.
Wilke, C. O. and Wiernik, B. M.: ggtext: Improved text rendering support for “ggplot2”, CRAN [code], https://CRAN.R-project.org/package=ggtext (last access: 25 April 2024), 2022.
Yilmaz, P., Parfrey, L. W., Yarza, P., Gerken, J., Pruesse, E., Quast, C., Schweer, T., Peplies, J., Ludwig, W., and Glöckner, F. O.: The SILVA and “All-species Living Tree Project (LTP)” taxonomic frameworks, Nucleic Acids Res., 42, D643–D648, https://doi.org/10.1093/nar/gkt1209, 2014.
Fungal ecology is often studied using short fragments of Deoxyribonucleic acid (DNA). These DNA fragments can approximate fungal species using different computational methods but the best choice is not clear. We analysed large, simulated fungal communities to overcome the limitations of experimental work and compare different analysis workflows. Our results identify the analysis choices which give the closest match to reality. This should help guide study design in fungal ecology.
Fungal ecology is often studied using short fragments of Deoxyribonucleic acid (DNA). These DNA...