the Creative Commons Attribution 4.0 License.
the Creative Commons Attribution 4.0 License.
 | 20 Feb 2018
Generalized nonlinear height–diameter models for a Cryptomeria fortunei plantation in the Pingba region of Guizhou Province, China
Zongzheng Chai
Wei Tan
Yuanyuan Li
Lan Yan
Hongbo Yuan
Zhaojun Li
The relationship between height and diameter (H-D) is an important component in forest growth and yield models, and a better understanding of the relationship will improve forest monitoring, management, and biomass estimation. Sixteen nonlinear growth functions were fitted to H-D data for 1261 trees from a Cryptomeria fortunei plantation in the Pingba region of Guizhou Province, China. Of the 1261 trees, 80 % were randomly selected for model calibration, while the remaining trees were reserved for model validation. All models were evaluated and compared by means of multiple-model performance criteria. Although all 16 models showed a good fit to the dataset and each of them accounted for more than 75 % of the total variation in height, a large difference in asymptotic estimates was observed. The Chapman–Richards, Weibull, and Näslund models were recommended for C. fortunei plantations, due to their satisfactory height prediction and biological interpretability.
- Article
(1049 KB) - Full-text XML
- BibTeX
- EndNote


Tree height and diameter at breast height (DBH, 1.3 m above ground) are fundamental essential individual tree variables used in forest measurements and inventories (Adamec and Drápela, 2015; Misir, 2010; Subedi and Sharma, 2011). DBH can be easily and accurately measured in field inventories, whereas due to visual obstructions the estimation of tree height is less accurate and often far more difficult and time consuming, especially in tall and closed-canopy stands (Ahmadi et al., 2013; Bi et al., 2012). Therefore, height–diameter (H-D) models are commonly used to predict the heights of the remaining trees, thus reducing the cost of data acquisition (Crecente-Campo et al., 2010; Schmidt et al., 2011).
The development of a suitable H-D model is very important for estimating tree growth, biomass production, and carbon storage capacity, as well as for forest management and monitoring (Aishan et al., 2016; Schmidt et al., 2011; Vospernik et al., 2010). A wide variety of models have been proposed to determine the H-D relationships in different tree species, regions, and ecological zones (Feldpausch et al., 2011; Temesgen et al., 2014). Generally, the models can be divided into linear and nonlinear types, but the H-D relationship is influenced by numerous factors, particularly site quality and silvicultural treatments. In many cases, such relationships feature a complex nonlinear process, which is difficult to describe using ordinary linear models (Adamec and Drápela, 2015; Nanos et al., 2004; Watt and Kirschbaum, 2011). Thus, there is a general consensus that nonlinear models can improve measurement accuracy and reliability, leading to better predictions (Cimini and Salvati, 2011; Crecente-Campo et al., 2010; Paulo et al., 2011). Because many H-D models have been proposed in the literature, comparisons among different models are required to identify appropriate H-D relationships.
Cryptomeria fortunei Hooibrenk ex Otto et Dietr is a widespread and economically important coniferous species in plantations in Guizhou Province, China. Because of its relatively fast growth and good-quality timber, as well as its ability to grow in harsh conditions, it plays an important role in timber production, carbon storage, and ecological restoration. Traditionally simple, low-efficiency, and high-consumption management modes have been operated for a long time; however, this has seriously restricted the development and extension of C. fortunei plantations. For these reasons, there is a need to monitor and accurately estimate the growth and yield, and develop a rational extension plan for commodity production and the provision of ecological services. To achieve this, it is necessary to explore the H-D relationship for estimating tree growth and biomass production. No generalized H-D model for C. fortunei has yet been developed or proposed in the literature.
In this study, 16 nonlinear growth functions were fitted to H-D data for a C. fortunei plantation in the Pingba region of Guizhou Province. Four statistical criteria were applied to assess the model performance, and 20 % of an independent dataset was used to validate and compare the performance of each model. The objectives of this study were to (1) compare and evaluate the relative performance of 16 classical nonlinear H-D models and (2) develop appropriate H-D models for a C. fortunei plantation in the Pingba region of Guizhou Province.
2.1 Study site
Guizhou Province is located in the center of the Southeast Asian karst region, which is the largest karst area in the world. Karstification is highly developed in this area, and the karst types are the most diverse of any karst area in the world (Han and Liu, 2004). Guizhou is situated on a plateau, with a mean altitude of about 1000 m. It has a typical subtropical humid monsoon climate, with an average annual temperature of 15 ∘C and annual precipitation of 1100–4000 mm (Feng et al., 2002).
The study took place in the Dapo Forest Farm (105∘59′–106∘34′ E, 25∘15′–26∘37′ N) in the Pingba region in central Guizhou Province. The altitude of the area ranges between 1350 and 1600 m, with an area of 680 km2. The Pingba region has high biodiversity and abundant forest resources, and it experiences a mild and humid continental monsoon climate, with a mean annual temperature of 13 ∘C and annual mean rainfall of 1300 mm. The forest has been harvested in recent decades, and much of the area is now covered by secondary forest and plantation. The dominant tree species are Cunninghamia lanceolata (Lamb.) Hook., C. fortunei, Pinus massoniana Lamb., P. armandii Franch., bamboo, and various broad-leaved forest species. The forest cover is 97.6 %.
2.2 Data collection
We studied a plantation along a time series ranging from 4- to 38-year-old stands. In each stand, two sample plots were established. The plot locations were established at random; a total of 15 plots (20 m × 30 m) were established for a C. fortunei plantation within the study area. Tree species, DBH, stem height (height of the first major branch), tree height, crown width, and tree health were measured for all trees in each plot with a DBH ≥ 5.0 cm, and their locations were recorded.
Tree height and DBH for 1261 trees were recorded in total. The trees were split into two groups, with 80 % of them used for model calibration (n=1009), while the remaining ones (20 %) were used for model validation (n=252). Data for model calibration and validation were acquired by stratified random sampling according to stand age (Fig. 1). Summary statistics for tree height and DBH are given in Table 3.
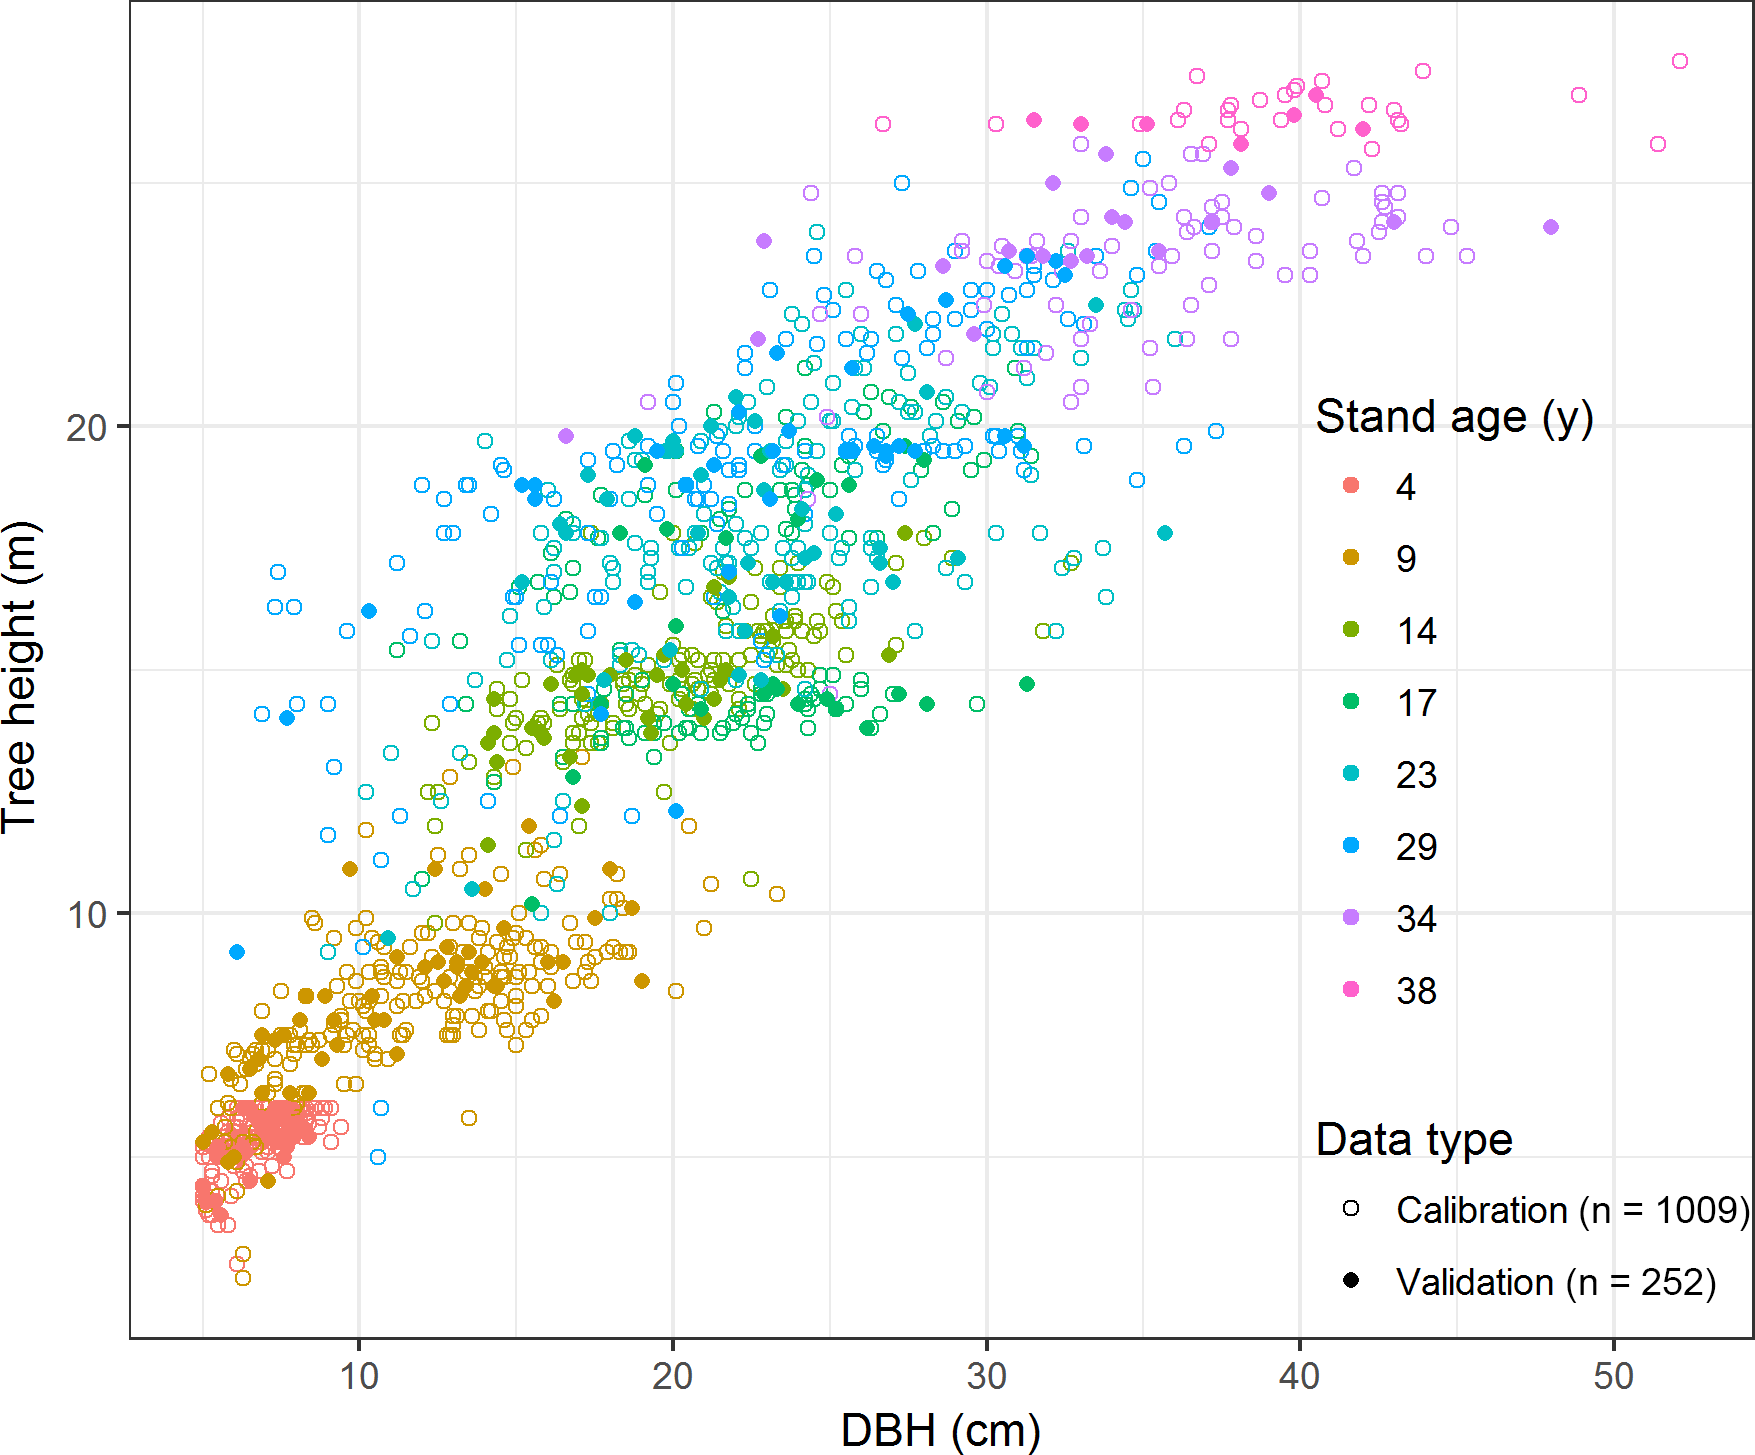
Figure 1Tree height and diameter at breast height (DBH) for model fitting data for a Cryptomeria fortunei plantation in the Pingba region of Guizhou Province, China.
2.3 Data analysis
2.4 Nonlinear growth function
Sixteen candidate nonlinear H-D growth functions (Table 1) were selected from previous studies based on the suitability of their mathematical features, the possible biological interpretation of model parameters, and satisfactory previous predictions of the H-D relationship in the literature (Huang et al., 1992; Mehtätalo et al., 2015).
Table 1Nonlinear height–diameter (H-D) growth models selected for use in this study (Mehtätalo et al., 2015).
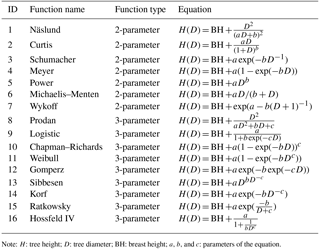
Note: H: tree height; D: tree diameter; BH: breast height; a, b, and c: parameters of the equation.
2.5 Model performance criteria
Four statistical criteria – the adjusted determinant coefficient (), relative mean absolute error (RMA), root mean square error (RMSE), and Akaike's information criterion (AIC) – were obtained from the residuals. They were used to compare the performance of the models and determine which of them described the relationship between height and diameter for individual trees most accurately. The expressions of these statistical criteria are summarized in Table 2. is a measure used to determine the relative correlation and the goodness of fit between the estimated and measured data; RMA and RMSE indicate the accuracy of the estimates; and the AIC is an index used to select the best model from a group of candidate models (Aishan et al., 2016; Castaño-Santamaría et al., 2013; Özçelik et al., 2014). In general, models with the lowest RMSE, RMA, and AIC, and with the highest are known to perform best (Aertsen et al., 2010; Ahmadi et al., 2013).
Table 2Model performance criteria selected for this study.
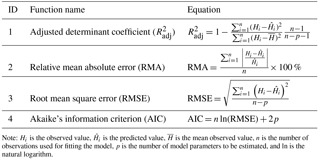
Note: Hi is the observed value, is the predicted value, is the mean observed value, n is the number of observations used for fitting the model, p is the number of model parameters to be estimated, and ln is the natural logarithm.
2.6 Statistical analysis
All statistical analyses were performed using R version 3.4.0 (R Core Team, 2017). Stratified sampling was conducted using the sampling package. A nonlinear regression was conducted using the lmfor package. The figures were drawn and the data were manipulated using the ggplot2 and plyr packages, respectively.
3.1 Data summary
The dataset covered a wide array of stand ages (4–38 years), DBHs from 5.00 to 52.10 cm, and tree heights from 2.50 to 27.50 m (Table 3). The calibration data were obtained from 1009 individual trees and covered a wide range of tree sizes, with diameters ranging from 5.00 to 52.10 cm and tree heights from 2.50 to 27.50 m. The validation data was obtained from 252 individual trees, with diameters ranging from 5.00 to 48.00 cm and tree heights from 3.80 to 26.80 m.
Table 3Summary statistics for all sampled trees and trees used for model calibration and validation.
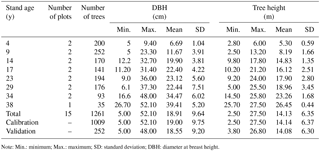
Note: Min.: minimum; Max.: maximum; SD: standard deviation; DBH: diameter at breast height.
3.2 Model calibration
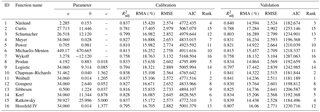
H-D models were developed for a C. fortunei plantation using 16 nonlinear growth functions. The fitting results of the models are presented in Table 4, and all models were examined and evaluated based on multiple-model performance criteria. All models had a good fit to the dataset and explained more than 76 % of the observed variability (), with RMA values below 18.572 %, RMSE values less than 3.110 m, and low AIC values. Considering the abovementioned criteria, the Chapman–Richards, Weibull, Ratkowsky, and Näslund functions performed relatively well, and the Chapman–Richards and Weibull functions provided the most satisfactory height predictions.
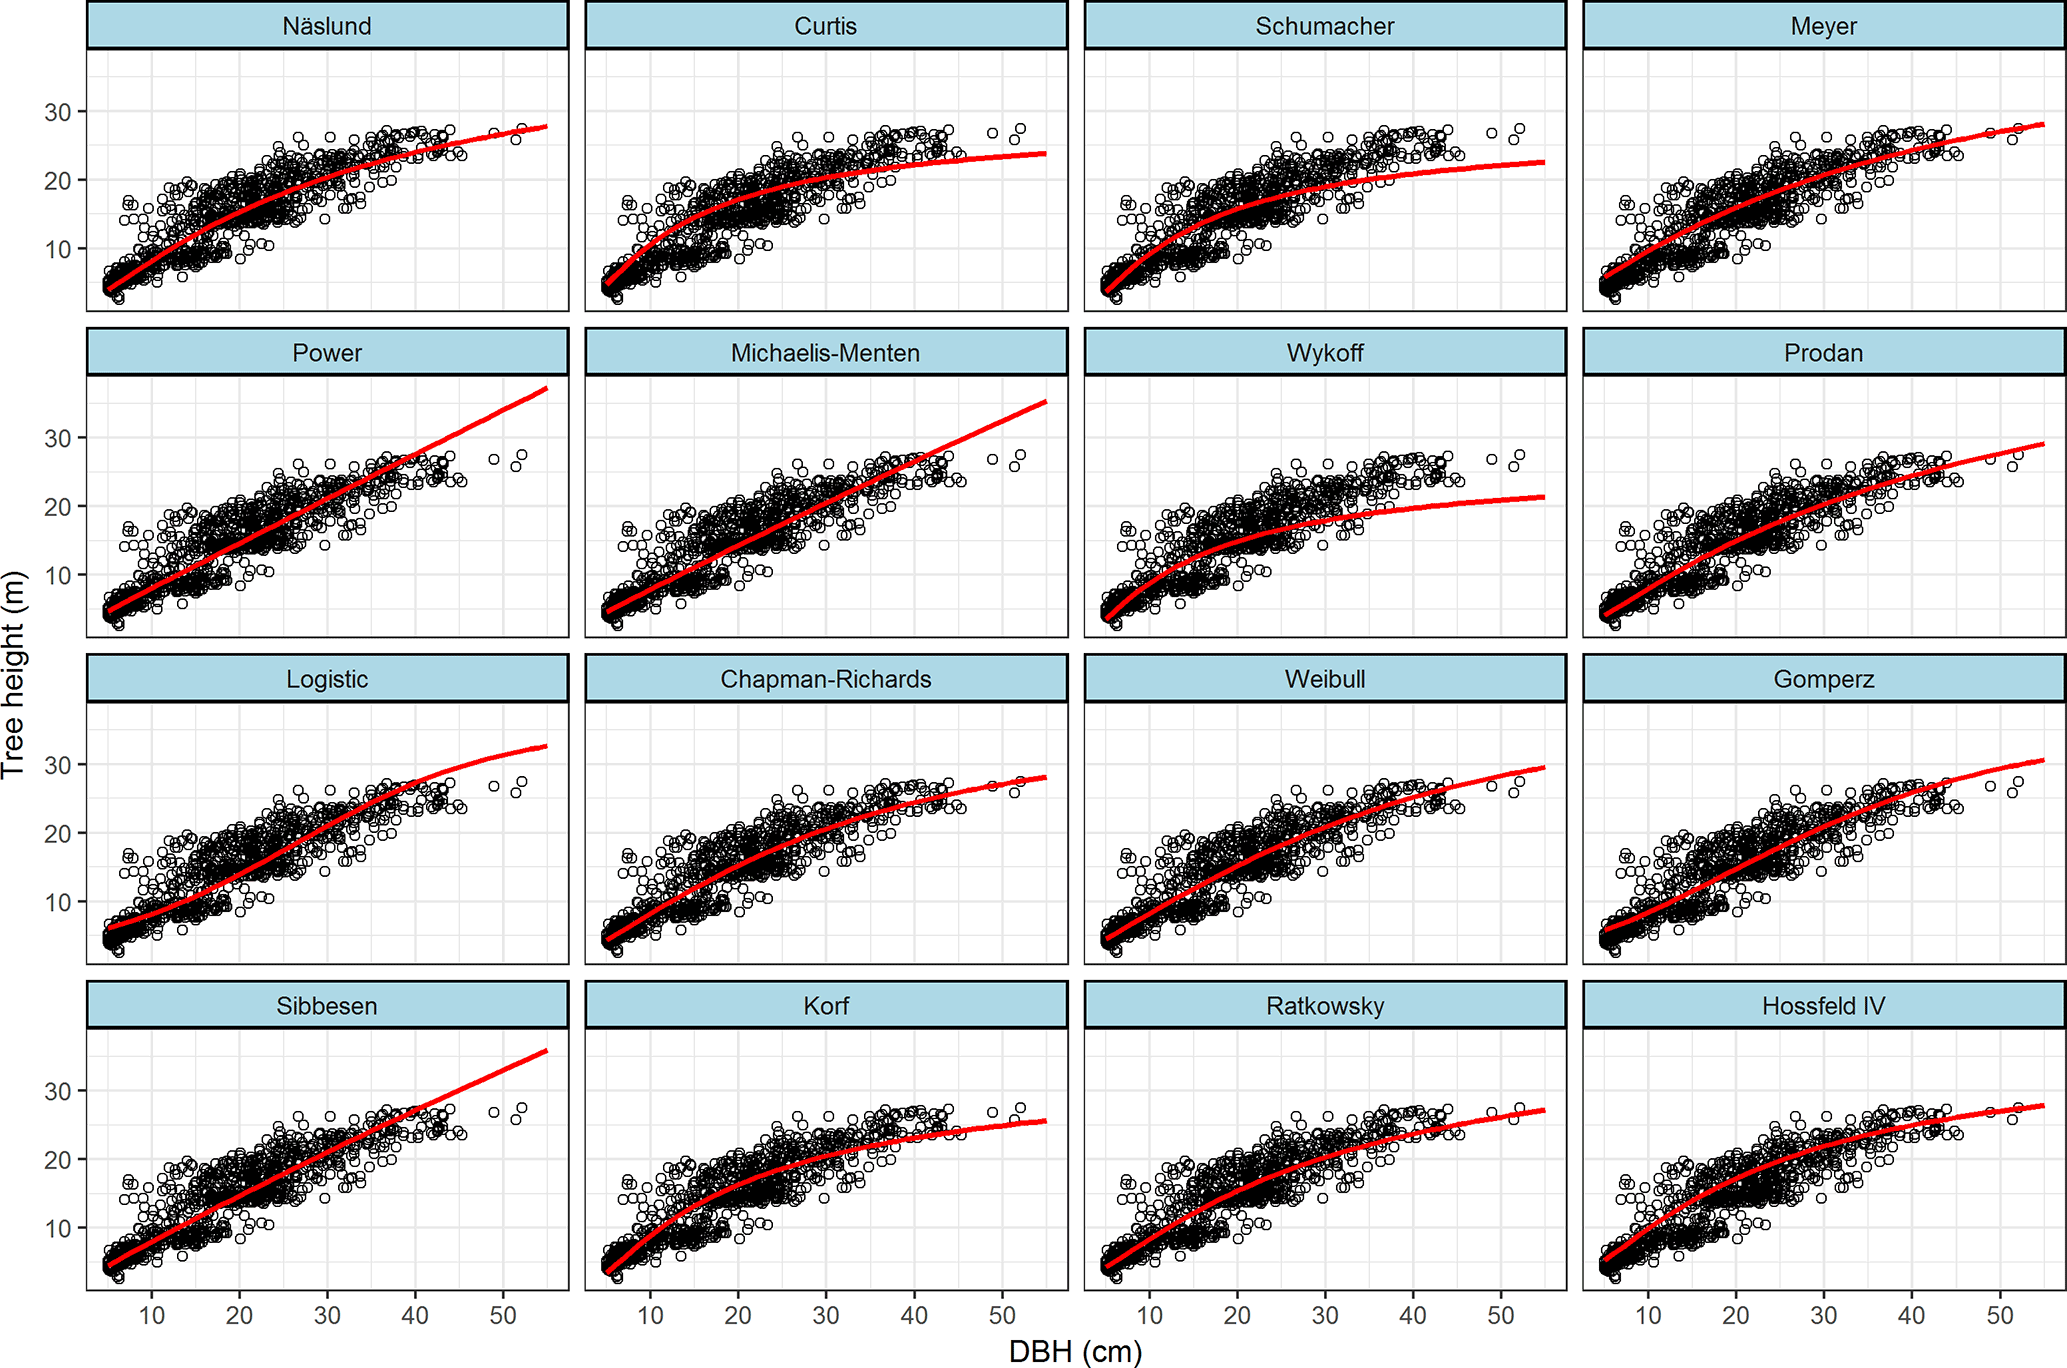
Figure 2Sixteen nonlinear height–diameter curves for a Cryptomeria fortunei plantation in the Pingba region of Guizhou Province, China.
The predictive performances of all models were investigated with tree diameters ranging from 5 to 55 cm. Figure 2 shows the curves for all 16 H-D growth models for the C. fortunei plantation. For small and medium trees (5 < DBH < 30 cm), the 16 growth functions gave a similar prediction of tree height. For large trees, the Chapman–Richards, Weibull, Ratkowsky, and Näslund functions displayed an identical trend that was much greater than that of the other functions. Some functions had a very poor fitting performance, with the Wykoff and Curtis functions predicting very low tree heights; while the logistic, Michaelis–Menten, and power functions predicted tree heights that were much greater than the observed values (Fig. 2).
3.3 Model validation
The various model performance criteria are presented in Table 4 for each model based on the validation dataset. The differences between the model performance criteria varied substantially. The values ranged from 0.758 to 0.841, RMA values ranged from 14.236 to 18.142 %, RMSE values ranged from 2.511 to 3.104, and AIC values ranged from 1181.189 to 1287.063. The results of the model validation were in agreement with the model calibration, with the Chapman–Richards, Weibull, Ratkowsky, and Näslund functions providing the most satisfactory height predictions. In summary, we selected the Chapman–Richards, Weibull, and Näslund functions as the H-D models for a C. fortunei plantation in the Pingba region of Guizhou Province, China. This was because the Chapman–Richards and Weibull functions were the best three-parameter models, while the Näslund function was the best two-parameter model.
Most of the candidate models (Table 2) performed quite well in fitting the H-D relationship for a C. fortunei plantation based on an analysis of the multimodel performance criteria. When selecting a functional form for the H-D relationship, the following features should be considered: prediction effect and precision, and the function's mathematical properties and its biological interpretation (Huang et al., 1992; Misir, 2010; Stankova and Diéguez-Aranda, 2012). Although any function may be considered superior or inferior in a particular situation, in general, we found that the Chapman–Richards, Weibull, and Näslund models proved more effective for predicting the tree height of C. fortunei than other candidate models, because they had a relatively low RMSE, RMA, and AIC, and high values. To a certain extent, our results are consistent with findings reported previously (Crecente-Campo et al., 2014; Jiang and Li, 2010; Rupšys, 2015; Scaranello et al., 2012). Huang et al. (1992) fitted and evaluated twenty nonlinear H-D functions for major Alberta species based on a dataset consisting of 13 489 trees of 16 different species, and they found that the Chapman–Richards and Weibull functions gave the most satisfactory results. Mehtätalo et al. (2015) reported that an extensive comparison of 16 nonlinear functions using a total of 28 datasets from a wide range of tree species, regions, and ecological zones confirmed that the Näslund function provided a satisfactory fit in most datasets for the H-D relationship. We think the reason for this is that the recommended functions also have the flexibility to assume various shapes with different parameter values and produce satisfactory curves under most circumstances, especially with their extensive application. In addition, the relationship between tree height and DBH could be described by an S-shape curve, where the tree height generally grew with the increase of DBH and then stabilized. The above three functions are sigmoidal models, with an asymptote that can characterize this kind of phenomenon (Huang et al., 1992). Therefore, we recommend that the Chapman–Richards, Weibull, and Näslund models be applied for accurate predictions of the H-D relationship for C. fortunei plantations in the Pingba region of Guizhou Province.
Table 4Parameter estimates and performance criteria of 16 nonlinear height–diameter models for a Cryptomeria fortunei plantation in the Pingba region of Guizhou Province, China.
The differences between the Chapman–Richards, Weibull, and Näslund models are that the Chapman–Richards and Weibull functions are three-parameter functions, while the Näslund function is a two-parameter function. It was found that three-parameter functions are often most appropriate for large datasets; however, the three-parameter models sometimes suffer from problems regarding model convergence and a non-positive definite random-effect variance–covariance matrix (Mehtätalo et al., 2015), while our results also showed that three-parameter models always had high levels of accuracy. Nevertheless, two-parameter models are easy to fit and are quick to achieve convergence in most situations. Therefore, we suggest that the Chapman–Richards and Weibull three-parameter models should be applied when there are large amounts of data to handle and high levels of accuracy are required, while the Näslund two-parameter model should be used when there is limited data available and a relatively lower level of accuracy can be accepted. This is because the Näslund computing processes are often more simple, stable, and efficient than those of the Chapman–Richards and Weibull models.
Many years of forestry practice have confirmed that C. fortunei can be cultivated in central Guizhou Province on a large scale, and this will continue due to its good growth performance and excellent development potential. These proposed generalized H-D models will help forest managers to reduce costs and save time during the inventory process and at the same time to make better decisions in forest management and planning. A generalized H-D model, with a wider range of geographical applicability, can be built by considering stand variables (Ahmadi et al., 2013; Crecente-Campo et al., 2010). Although we proposed three generalized H-D models for use with a dataset that encompassed a wide range of stand ages, there was a clear limitation concerning the number of stands used in the analysis. This was because the C. fortunei plantation in our study region was mostly distributed at middle-altitude sites, with a gentle slope, and the differences among habitats were relatively small. The incorporation of variables that describe site-specific conditions and how such models might relate to the relatively more empirical mixed-model approach implemented here should be investigated in the future.
The data are available upon request to the corresponding author, Wei Tan (wtan@gzu.edu.cn).
The authors declare that they have no conflict of interest.
The authors thank two reviewers for valuable
comments on the manuscript. We also thank Forestry Bureau of Pingba District,
Pingba District, Guizhou Province, for considerable support to our field
investigation. This study was funded by the Science and
Technology Planning Project of Guizhou Province (grant no. [2017]2520-1) and
the Experiment and Implement of Sustainable Management of Pinus massoniana Forest in Qianzhong Region (grant no. ASZX-2015-PJ015).
Edited by: John M. Halley
Reviewed by: Valentino Govigli and one anonymous referee
Adamec, Z. and Drápela, K.: Generalized additive models as an alternative approach to the modelling of the tree height-diameter relationship, J. For. Sci., 61, 235–243, 2015.
Aertsen, W., Kint, V., Van Orshoven, J., Özkan, K., and Muys, B.: Comparison and ranking of different modelling techniques for prediction of site index in Mediterranean mountain forests, Ecol. Model., 221, 1119–1130, 2010.
Ahmadi, K., Alavi, S. J., Kouchaksaraei, M. T., and Aertsen, W.: Non-linear height-diameter models for oriental beech (Fagus orientalis Lipsky) in the Hyrcanian forests, Iran/Modèles non linéaires de diamètre de hauteur pour le hêtre oriental (Fagus orientalis Lipsky) dans les forêts Hyrcaniennes en Iran, Biotechnol. Agron. Soc., 17, 431–440, 2013.
Aishan, T., Halik, Ü., Betz, F., Gärtner, P., and Cyffka, B.: Modeling height–diameter relationship for Populus euphratica in the Tarim riparian forest ecosystem, Northwest China, J. Forestry Res., 27, 889–900, https://doi.org/10.1007/s11676-016-0222-5, 2016.
Bi, H., Fox, J. C., Li, Y., Lei, Y., and Pang, Y.: Evaluation of nonlinear equations for predicting diameter from tree height, Can. J. Forest Res., 42, 789–806, 2012.
Castaño-Santamaría, J., Crecente-Campo, F., Fernández-Martínez, J. L., Barrio-Anta, M., and Obeso, J. R.: Tree height prediction approaches for uneven-aged beech forests in northwestern Spain, Forest Ecol. Manag., 307, 63–73, 2013.
Cimini, D. and Salvati, R.: Comparison of generalised nonlinear height-diameter models for Pinus halepensis Mill. and Quercus cerris L. in Sicily (Southern Italy), Italian Journal of Forest and Mountain Environments, 66, 395–400, 2011.
Crecente-Campo, F., Tomé, M., Soares, P., and Diéguez-Aranda, U.: A generalized nonlinear mixed-effects height–diameter model for Eucalyptus globulus L. in northwestern Spain, Forest Ecol. Manag., 259, 943–952, 2010.
Crecente-Campo, F., Corral-Rivas, J. J., Vargas-Larreta, B., and Wehenkel, C.: Can random components explain differences in the height–diameter relationship in mixed uneven-aged stands?, Ann. For. Sci., 71, 51–70, 2014.
Feldpausch, T. R., Banin, L., Phillips, O. L., Baker, T. R., Lewis, S. L., Quesada, C. A., Affum-Baffoe, K., Arets, E. J. M. M., Berry, N. J., Bird, M., Brondizio, E. S., de Camargo, P., Chave, J., Djagbletey, G., Domingues, T. F., Drescher, M., Fearnside, P. M., França, M. B., Fyllas, N. M., Lopez-Gonzalez, G., Hladik, A., Higuchi, N., Hunter, M. O., Iida, Y., Salim, K. A., Kassim, A. R., Keller, M., Kemp, J., King, D. A., Lovett, J. C., Marimon, B. S., Marimon-Junior, B. H., Lenza, E., Marshall, A. R., Metcalfe, D. J., Mitchard, E. T. A., Moran, E. F., Nelson, B. W., Nilus, R., Nogueira, E. M., Palace, M., Patiño, S., Peh, K. S.-H., Raventos, M. T., Reitsma, J. M., Saiz, G., Schrodt, F., Sonké, B., Taedoumg, H. E., Tan, S., White, L., Wöll, H., and Lloyd, J.: Height-diameter allometry of tropical forest trees, Biogeosciences, 8, 1081–1106, https://doi.org/10.5194/bg-8-1081-2011, 2011.
Feng, X., Sommar, J., Lindqvist, O., and Hong, Y.: Occurrence, emissions and deposition of mercury during coal combustion in the province Guizhou, China, Water Air Soil Poll., 139, 311–324, 2002.
Han, G. and Liu, C.-Q.: Water geochemistry controlled by carbonate dissolution: a study of the river waters draining karst-dominated terrain, Guizhou Province, China, Chem. Geol., 204, 1–21, 2004.
Huang, S., Titus, S. J., and Wiens, D. P.: Comparison of nonlinear height–diameter functions for major Alberta tree species, Can. J. Forest Res., 22, 1297–1304, 1992.
Jiang, L. and Li, Y.: Application of Nonlinear Mixed-Effects Modeling Approach in Tree Height Prediction, JCP, 5, 1575–1581, 2010.
Mehtätalo, L., de-Miguel, S., and Gregoire, T.: Modeling height-diameter curves for prediction, Can. J. Forest Res., 45, 826–837, 2015.
Misir, N.: Generalized height-diameter models for Populus tremula L. stands, Afr. J. Biotechnol., 9, 4348–4355, 2010.
Nanos, N., Calama, R., Montero, G., and Gil, L.: Geostatistical prediction of height/diameter models, Forest Ecol. Manag., 195, 221–235, 2004.
Özçelik, R., Yavuz, H., Karatepe, Y., Gürlevik, N., and Kiriş, R.: Development of ecoregion-based height-diameter models for 3 economically important tree species of southern Turkey, Turk. J. Agric. For., 38, 399–412, 2014.
Paulo, J. A., Tomé, J., and Tomé, M.: Nonlinear fixed and random generalized height–diameter models for Portuguese cork oak stands, Ann. Forest Sci., 68, 295–309, 2011.
Rupšys, P.: Height–diameter models with stochastic differential equations and mixed-effects parameters, Journal of Forest Research, 20, 9–17, https://doi.org/10.1007/s10310-014-0454-1, 2015.
Scaranello, M. A. d. S., Alves, L. F., Vieira, S. A., Camargo, P. B. d., Joly, C. A., and Martinelli, L. A.: Height-diameter relationships of tropical Atlantic moist forest trees in southeastern Brazil, Sci. Agr., 69, 26–37, 2012.
Schmidt, M., Kiviste, A., and von Gadow, K.: A spatially explicit height–diameter model for Scots pine in Estonia, Eur. J. For. Res., 130, 303–315, https://doi.org/10.1007/s10342-010-0434-8, 2011.
Stankova, T. V. and Diéguez-Aranda, U.: Height-diameter relationships for Scots pine plantations in Bulgaria: optimal combination of model type and application, Ann. For. Res., 56, 149–163, 2012.
Subedi, N. and Sharma, M.: Individual-tree diameter growth models for black spruce and jack pine plantations in northern Ontario, Forest Ecol. Manag., 261, 2140–2148, https://doi.org/10.1016/j.foreco.2011.03.010, 2011.
Temesgen, H., Zhang, C., and Zhao, X.: Modelling tree height–diameter relationships in multi-species and multi-layered forests: a large observational study from Northeast China, Forest Ecol. Manag., 316, 78–89, 2014.
Vospernik, S., Monserud, R. A., and Sterba, H.: Do individual-tree growth models correctly represent height:diameter ratios of Norway spruce and Scots pine?, Forest Ecol. Manag., 260, 1735–1753, https://doi.org/10.1016/j.foreco.2010.07.055, 2010.
Watt, M. S. and Kirschbaum, M. U.: Moving beyond simple linear allometric relationships between tree height and diameter, Ecol. Model., 222, 3910–3916, 2011.