the Creative Commons Attribution 4.0 License.
the Creative Commons Attribution 4.0 License.
 | 13 Jan 2023
Plant clustering generates negative plant–soil feedback without changing the spatial distribution of soil fauna
Peihua Zhang
Dries Bonte
Gerlinde De Deyn
Martijn L. Vandegehuchte
The spatial distribution of resources affects ecological processes at all levels of biological organization. However, it remains to be tested how the spatial configuration of belowground resources affects the community dynamics of soil organisms and resulting plant–soil feedbacks.
We used Agrostis stolonifera plants in different spatial configurations in mesocosms to study the dispersal patterns of soil nematodes and rotifers. Plant–soil feedbacks were later assessed by re-sowing the mesocosms with Lolium perenne and Plantago lanceolata after removing all the initial A. stolonifera plants from the mesocosms. Bacterial-feeding nematodes and rotifers spread fast, whereas plant-feeding nematodes barely dispersed from the release sites. These spread patterns of nematodes and rotifers depended on the life-history traits and not on the spatial pattern of the plants. However, more clustered plants developed a higher total biomass and caused a reduced growth of the subsequent vegetation.
Our results demonstrate that the mere spatial pattern of a single plant species can alter the strength of plant–soil feedbacks. This has important implications for understanding the impact of planting or replanting schemes and other changes in the spatial configuration of plants on long-term vegetation development and succession.
- Article
(2468 KB) - Full-text XML
-
Supplement
(741 KB) - BibTeX
- EndNote


Many organisms experience their environment as patchy and spatially structured (Forman, 1995). Populations then live in units, often referred to as patches, that can persist as a network via metapopulation dynamics if dispersal of individuals among patches is sufficient (Hanski, 1998). Dispersal is costly (Bonte et al., 2012), and the degree to which local populations are effectively linked by dispersal, i.e. connectivity (Calabrese and Fagan, 2004), varies. Dispersal can be a rare event occurring during well-defined periods of the life cycle, as for sedentary individuals, but may also be a consequence of more gradual diffusion processes (Clobert et al., 2009). Colonization of new resource patches depends on the organism's movement ability, the permeability of the matrix in between the patches, and the distance between and accessibility of patches (Neher, 2010).
Soil organisms play major roles in the functioning of terrestrial ecosystems, but their spatial ecology has been less studied than that of aboveground organisms (Bardgett and Van Der Putten, 2014). This is especially true for the soil microfauna, including nematodes and rotifers. Soil nematodes are a highly abundant and diverse group of invertebrates and can be categorized by feeding type as bacterivores, fungivores, omnivores, predators, and plant feeders (Wharton, 1986). Soil nematodes are small soil fauna (Weil and Brady, 2017), which depend on water films around soil particles to move through the soil system (Neher, 2010). Competition (interspecific and intraspecific), feeding habits, and life-history traits are important drivers for active dispersal of nematodes at small scales (Liu et al., 2019). Nematode feeding type is a main determinant of microscale patchiness of soil nematodes (Park et al., 2013; Quist et al., 2017), suggesting that dispersal of soil nematodes is feeding type-specific. Studies of community succession in soil organisms found that opportunistic species, or colonizers, with short generation times, rapid dispersal, and generalist feeding habits, such as bacteria and bacterial-feeding nematodes, are favoured in the early stages of succession (De Goede et al., 1993; Ettema and Bongers, 1993; Steel et al., 2013). Fungi and fungivorous nematodes increase in abundance at a later stage. Secondary and tertiary consumers or predators establish the latest (reviewed by Neher, 2010). Rotifers are also widespread soil fauna inhabiting water films in the surface layer of the soil. They feed on small plant particles, small green and diatom algae, bacteria, yeasts, and microdetritus (Kutikova, 2003). Rotifers thus play an important role in nutrient cycling and trophic dynamics in the soil food web (Arndt, 1993). However, their spatial distribution and dispersal in the soil remain poorly explored compared with studies in aquatic systems (May and Wallace, 2019).
Plants can exert effects on soil biology, chemistry, and structure that alter subsequent plant growth, known as plant–soil feedbacks (PSFs) (Van der Putten et al., 2013). Plants, as primary producers, determine the quantity and quality of substrates entering the soil, which could drive the distribution of soil fauna by either directly attracting herbivores or by supplying plant residues that support specific feeding groups (Bardgett and Van Der Putten, 2014; Liu et al., 2019). Plants can therefore be regarded as “islands” in the belowground community assembly of soil organisms such as fungi (Glassman et al., 2017; Mony et al., 2020; Peay et al., 2010). The spatial distribution of plants can thus influence that of soil biota with respect to life forms, sizes, and functions (Coleman et al., 2004), which in turn can affect the functioning of terrestrial ecosystems, to a large extent via plant–soil feedbacks (reviewed by Liu et al., 2019). Studies on the effect of plants on soil nematode distribution have mainly focused on the community composition, functional type, and species identity of plants (De Deyn et al., 2004; Viketoft, 2007; Viketoft et al., 2005, 2009; Wardle et al., 2004). How the spatial configuration of plants (i.e. structural connectivity of resource habitats) affects the dispersal of soil microfauna and the resulting community dynamics is not well understood. Tests of how the configuration or size of resource patches affects the dispersal and spatial population dynamics of soil-dwelling animals have focused on soil macrofauna such as beetles and ants and mesofauna such as springtails (Benton and Bowler, 2012; Ingimarsdóttir et al., 2012; Lehmitz et al., 2012), and less on soil nematodes (but see Bukovinszky et al., 2012). Because of their much smaller body size and the inherent difficulty of observing soil organisms given the opaqueness of soil, studying community dynamics of soil microfauna such as nematodes and rotifers is challenging.
The importance of soil biota in determining the strength of PSF has been increasingly acknowledged (Bennett and Klironomos, 2019; Cesarano et al., 2017; Van der Putten et al., 2013). Plant–soil feedbacks can be positive, neutral, or negative (Van der Putten et al., 2013). Positive PSF effects often involve rapid litter decomposition due to locally adapted microbial communities (home-field advantage) and increased densities of symbiotic mutualists (Ayres et al., 2009; Madritch and Lindroth, 2011; Van der Putten et al., 2013). The majority of reported PSF effects are negative and intraspecific, resulting in degeneration of plants or mortality of seedlings close to the parent (reviewed by Van der Putten et al., 2013). The accumulation of soilborne pathogens and parasites, coupled with a shift in soil microbial community composition, is one of the main hypotheses for explaining negative PSF (Cesarano et al., 2017). Plant-parasitic nematode abundances have been found to greatly contribute to negative PSF in both agricultural and natural systems and across plant functional types (Cortois et al., 2016; Van Der Putten and Van Der Stoel, 1998; Wilschut et al., 2019). The spatial distribution of root-associated soil organisms (e.g. the differential build-up of populations of plant-pathogenic organisms, root herbivores, or mycorrhizal fungi across space) can influence the spatial patterning of plant species in a community, and this is regulated by plant–soil feedbacks (reviewed by Ettema and Wardle, 2002). As Mariotte et al. (2018) pointed out, PSFs in agricultural systems have been mostly investigated from the temporal perspective with less emphasis on the spatial context. Therefore, how the interaction between the spatial configuration of plants and that of soil fauna alters the strength of PSF remains an open question.
In this study, we evaluated how the spatial configuration of plants affects the spatial distribution and structure of soil microfauna communities (nematodes of different feeding types and rotifers). We established mesocosms with equal numbers of plants organized in different spatial configurations with respect to their distribution only, ranging from a clustered distribution to an even distribution. We tested how the plant spatial patterning of Agrostis stolonifera affected the soil fauna community and consequently the growth of later-grown Lolium perenne and Plantago lanceolata plants. In a homogeneous soil environment, active dispersal of soil microfauna depends largely on their own locomotion modes and life strategies. Thus, our hypotheses are the following: (1) plant-feeding nematodes, due to their sedentary or less mobile life history, will spread more efficiently and establish better if plant patches are clustered. (2) Those soil fauna with high fecundity and fast dispersal ability such as the bacterial-feeding nematodes and rotifers will quickly colonize the entire mesocosm, regardless of the spatial configuration of the plants. (3) A larger population of plant-feeding nematodes in the more clustered plant patches will cause a larger negative feedback effect on the growth of subsequent plants.
2.1 Spatial networks
Ten rectangular containers (80, 60, and 22 cm in respective length, width, and height) made of polypropylene were used as mesocosms. The mesocosm preparation and soil characteristics are described in Sect. S1 in the Supplement. In each container, a spatial pattern for nine local plant patches was created to span a distribution from clustered to regular while maintaining the overall mean distance among the nine patches. These nine plant patches can thus be considered as the nodes in the spatial network. The location coordinates were generated by brute forcing, i.e. by simulating 10 000 possible configurations and selecting those adhering to the criterion of inter-distances with equal averages but different variances among all nodes. Relative differences in the variance of these distances represent different amounts of dispersion of the nodes, ranging from under- to overdispersion. We scaled the variance of each mesocosm by dividing it by the variance of a completely random configuration. This results in a ratio of 1 for completely random distributions and values ranging between 0.6 and 1.29, with higher values implying increasing regularity of the network (Table S1, Fig. S1).
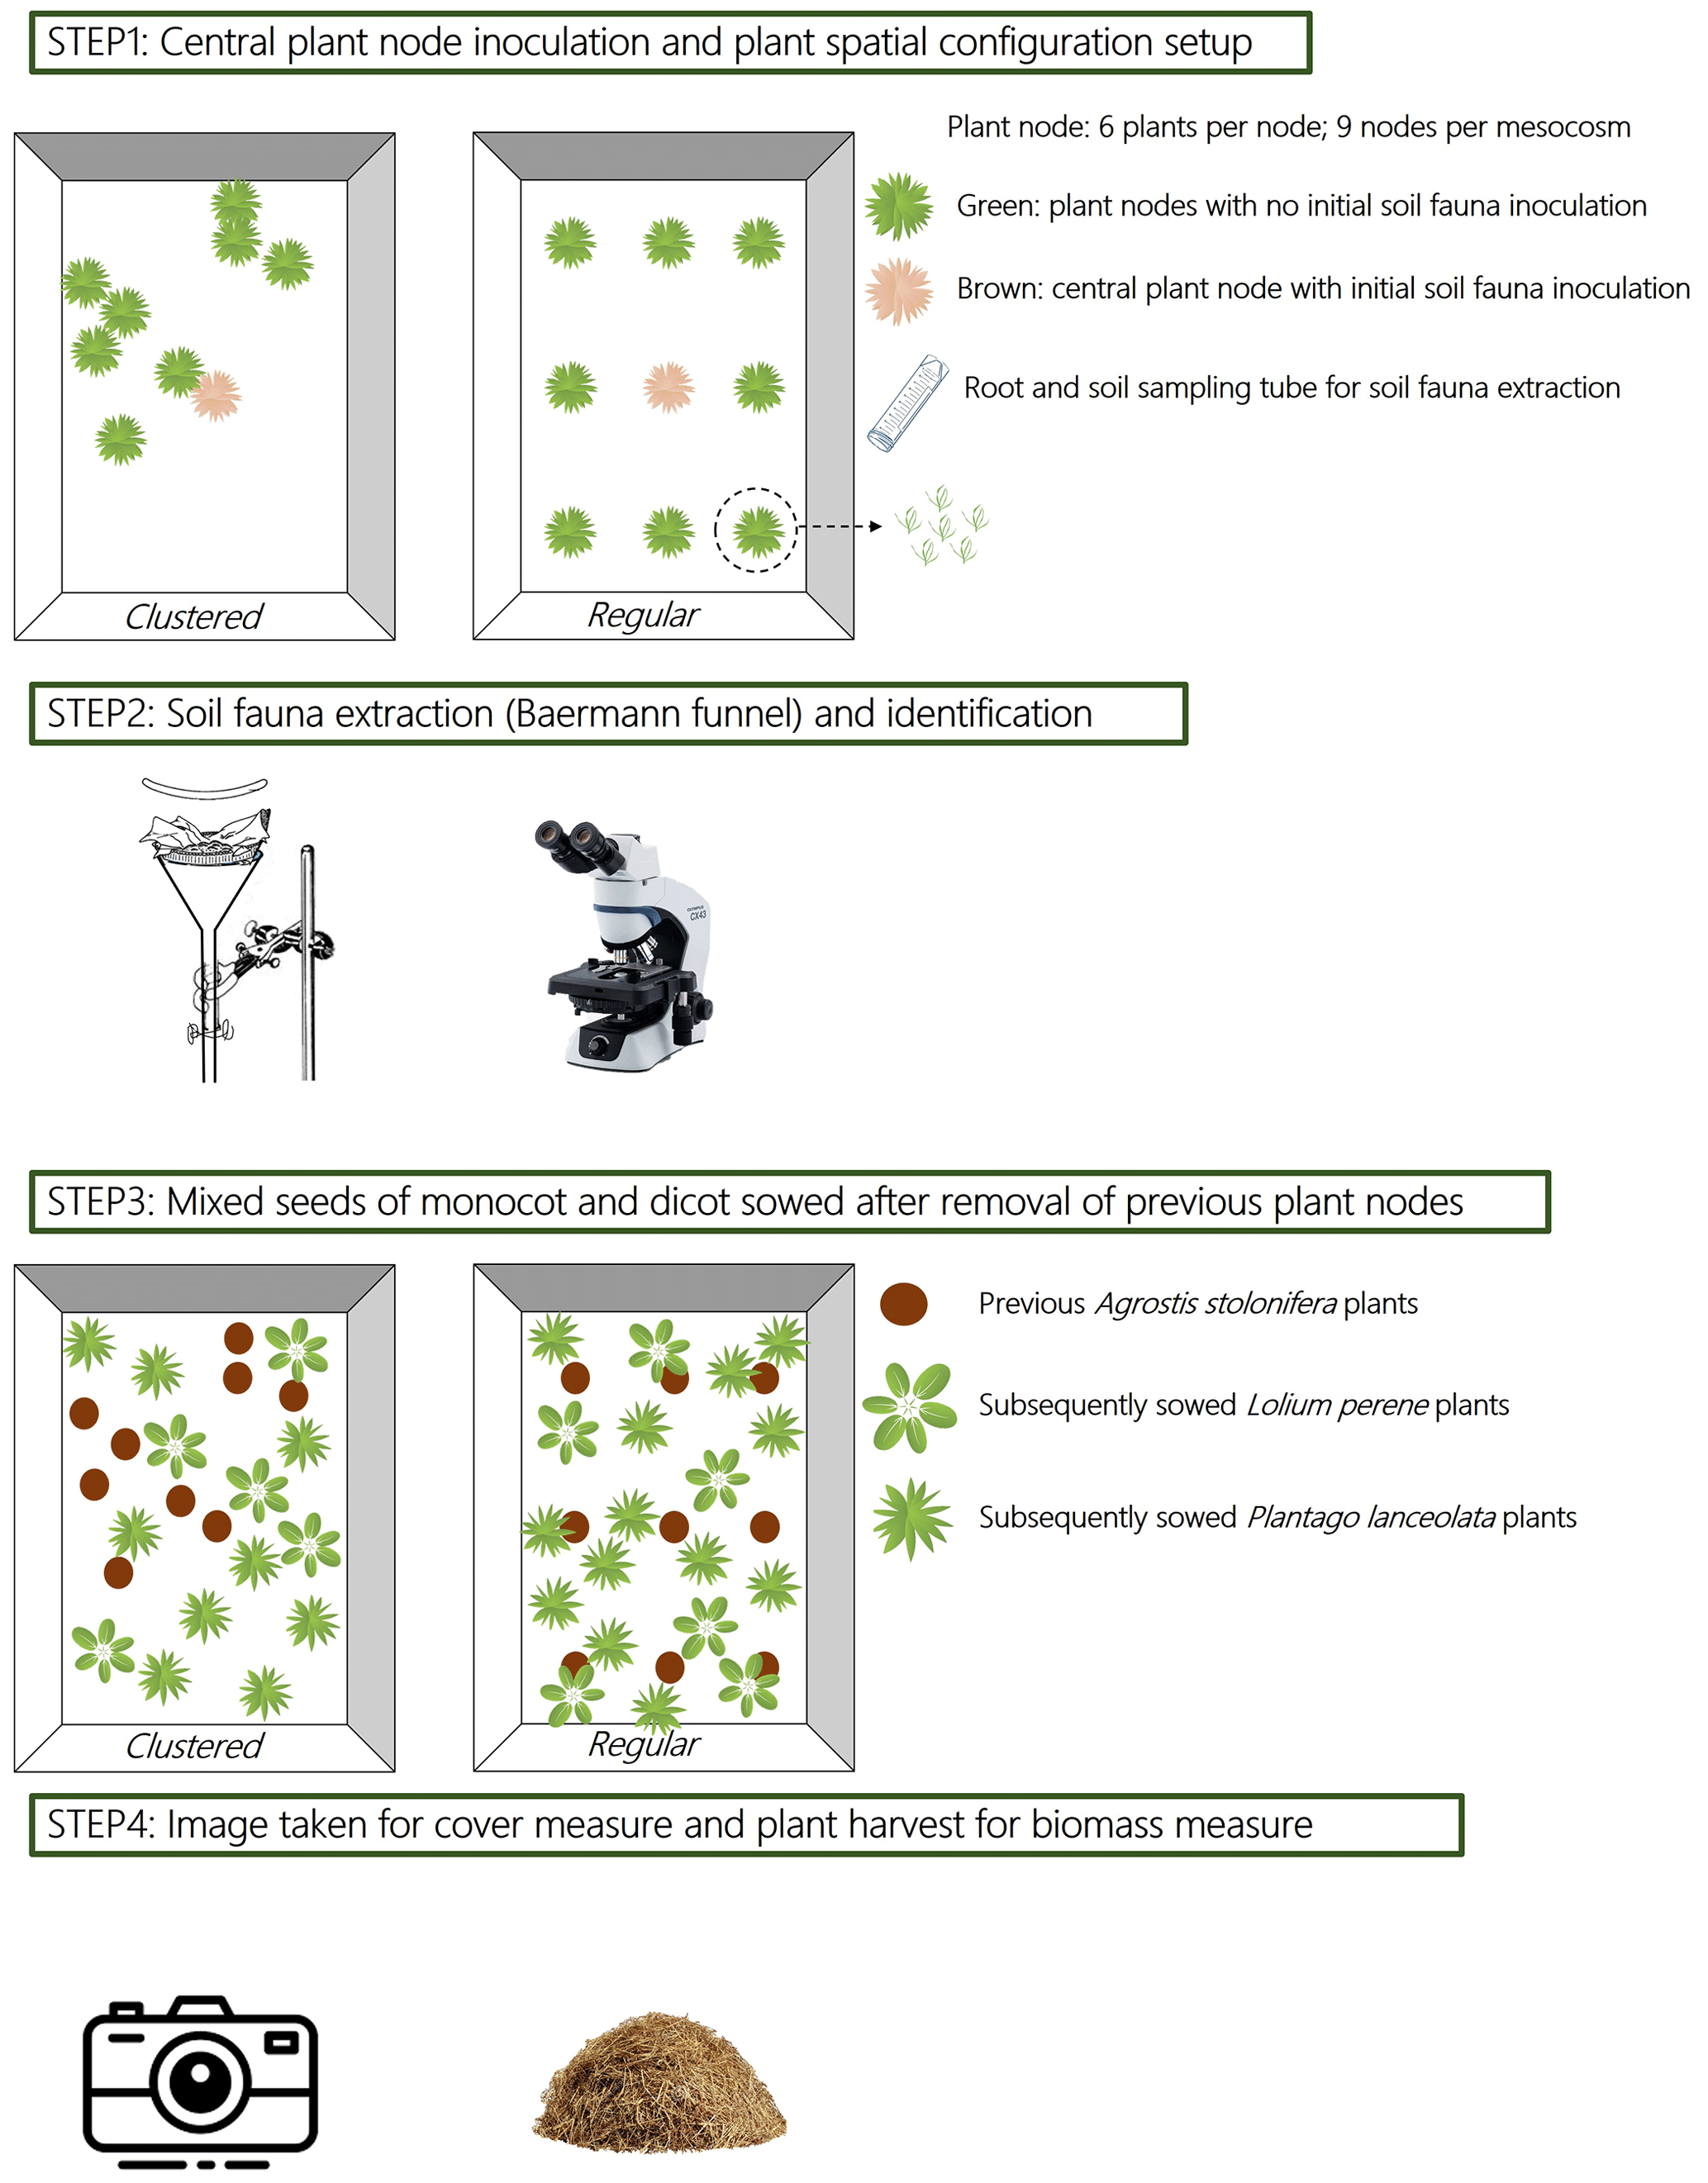
Figure 1Schematic diagram of the experiment on soil fauna dispersal and the experiment on legacy effects. Step 1 shows two mesocosms (one clustered and one regular plant spatial configuration) with nine plant nodes (each node consists of six Agrostis stolonifera plants, see inset figure), the central node was firstly inoculated with soil fauna before adding it into the mesocosm. Step 2 indicates that one A. stolonifera plant was sampled from each plant node every 15 d for soil fauna extraction from the roots and rhizosphere soil using Baermann funnels. The collected soil fauna were counted under the microscope. Step 3 shows two mesocosms (one clustered and one regular plant spatial configuration) which were sowed with new seeds of Lolium perenne and Plantago lanceolata after the removal of previous A. stolonifera plants from the soil fauna dispersal experiment. Step 4 illustrates that photographs were taken from the mesocosms shown in step 1 once a week, starting after 2 weeks of seed germination for a total of 7 weeks. The aboveground biomass of L. perenne and P. lanceolata was harvested after 9 weeks of growing, and dried for biomass measurement. The photographs were then analysed using an image analysing package in R to assess plant cover.
Rectangular coordinates were built in the containers by setting the longer side as the x axis (from 0 to 80 cm) and the shorter side as the y axis (from 0 to 60 cm). One central node was marked in each mesocosm at coordinates (40, 30 cm). The computed coordinates of each of the other eight nodes was then projected to the soil surface in the containers and marked using black plastic tubes (1 cm in length and 0.4 cm in diameter) inserted into the soil. Containers thus represented mesocosms of nodes differing in spatial regularity. A schematic diagram of the regular spatial configuration is given in Fig. 1.
2.2 Soil micro-fauna inoculum
We collected Agrostis stolonifera plants from the field (Ghent, Belgium), including roots and rhizosphere soil, and grew them in the lab using the same soil mixture as described above and in a constant environment (with temperature of 22 ∘C, a light/dark regime of 16 h/8 h, and a watering regime of 3 times a week). These field-collected plants were cultivated for 3 months and used for soil fauna extraction to obtain a soil microfauna inoculum. The roots were first harvested from the pots, and large soil particles attached to the roots carefully removed. Segmented roots (1 cm in length) with some rhizosphere soil were then used to extract root and rhizosphere soil fauna for 3 d using the tray method of Whitehead and Hemming (1965). Every 24 h, the extract was emptied into a vial and left to settle for 12 h before removing the supernatant. A total of 130 mL of inoculum was obtained in this way. Five subsamples of 2.5 mL of the inoculum were checked under the microscope to count nematode feeding types (bacterial feeders, fungal feeders, plant feeders, omnivores, and predators) and rotifers (Table S2). Plant-feeding nematodes occurred at a relatively low abundance and were not further categorized as according to feeding type into ectoparasites, semi-endoparasites, or endoparasites. Rotifers were highly abundant in the initial inoculum of the extracted soil microfauna and were hence included in this experiment.
2.3 Plants in the spatial configurations
A. stolonifera seeds were germinated to obtain plants for the spatial configuration experiment. These seeds were purchased from a commercial supplier (Cruydt-Hoeck, the Netherlands). Seeds were firstly surface sterilized: they were treated with 4 % household bleach for 10 min, rinsed 10 times with distilled water, treated with 10 % ethanol for another 10 min, and rinsed another 10 times with distilled water (Vandegehuchte et al., 2010). The surface-sterilized seeds were placed on wet filter papers in a Petri dish (50 seeds per dish) and left to germinate at 22 ∘C constant room temperature in a plant-breeding room with a light/dark regime of 16 h/8 h. Each of the nine nodes in each mesocosm were planted with six 2-week-old seedlings of A. stolonifera (with an averaged shoot length of 1.5 cm and root length of 2 cm). One seedling was located at the coordinates of the node and the other five around it at a same distance. A piece of cardboard was made into a regular pentagon shape by firstly drawing a circle with radius of 1.5 cm and then fixing five vertices. The piece of cardboard was used to determine the locations for the seedlings in each of the plant nodes by placing the centre over the black plastic tube marking the node coordinate and setting the five vertices as the locations for the other five seedlings. These locations were also marked with black plastic tubes inserted into the soil. Two-week-old seedlings were transplanted into the marked locations, except for the central coordinate of each mesocosm which was prepared for a plant node inoculated with a soil mesofauna community. Each seedling in the mesocosms received 5 mL of distilled water every 2 d during the first month after transplantation. Plants for the central nodes were firstly cultivated in separate paper cups for the purpose of soil fauna inoculation. Ten paper cups were prepared, and the locations for seedlings were marked as described above using the same pentagon. Each paper cup was planted with six seedlings for the central node at the same time the mesocosms were planted with seedlings for the remaining eight plant nodes. Nutrient supplement of 5 mL (2 g of the product in 1 L distilled water, COMPO, NPK:16-9-20) was added to each seedling in both mesocosms and paper cups. Seedlings in the paper cup were watered twice a week with 5 mL of distilled water each for 3 weeks before soil fauna inoculation. Of the soil fauna inoculum, 2 mL was added into a hole at 0.5 cm distance from the stem of each seedling in the paper cup and 2 cm below the soil surface. The inoculated central plant nodes, i.e. six plants, were left to grow in the paper cup for another week before transplantation into the centre of each mesocosm. Before the transplantation, the same amount of soil was firstly removed from the centre of each mesocosm with an identical paper cup. Next, a cut was carefully made along the bottom and one side of the paper cups with the seedlings before taking the soil with the inoculated plants out and placing it into the central hole in each mesocosm. This was regarded as day 0 for the experiment with a total duration of 90 d. The watering regimes are described in Sect. S1.
2.4 Soil mesofauna extraction and count
To understand the spatial dynamics of the investigated rotifers and nematodes, one plant per plant node was harvested every 15 d using a 50 mL tube (11.5 cm in height and 3 cm in diameter) to sample the plant roots and soil during the 90 d experiment. This sampling process always followed the same order as the furthest node first and the central node last. The sampled roots with soil were then cleaned and separated into roots with rhizosphere soil and bulk soil. Of roots (including adherent rhizosphere soil), 15 g collected from each plant individual were used for fauna extraction using Baermann funnels (Baermann, 1917), and another approximately 15 g of bulk soil was used to assess water content. Less than 15 g of roots were available at the first sampling time as roots were still small, and a maximum of 5 g of bulk soil was used at this time to complement the roots and obtain a total weight of 15 g. Plant shoots were dried at 70 ∘C for 72 h before weighing. Extracted soil fauna were counted per feeding type under the microscope, and their abundance was expressed as the density per 10 g of dry soil. Omnivores remained unseen during the extraction for each sampling time, hence they were not included in this study.
2.5 Legacy effect
To test the effect of former plant spatial configurations along with the spatial dynamics of soil microfauna on the subsequent plant performance, a follow-up test of plant–soil feedbacks was conducted. After the sixth plant sampling, with all plants now harvested, the mesocosms were covered with black plastic film and the room was darkened to restrain the growth of stolons from roots remaining in the soil. Sprouting stolons were removed with scissors twice a week for 1 month. After which, a mixture of Lolium perenne and Plantago lanceolata seeds were evenly sowed onto the soil surface of each mesocosm. Sprouting A. stolonifera stolons were removed to minimize their effect on the later grown L. perenne and P. lanceolata, both of which are widespread plant species of grassland systems around the world. We opted to re-sow with a grass and a forb species to assess whether any plant–soil feedback effects would be stronger in a more related species, in this case, L. perenne.
The germination rate of the seeds was tested in a separate experiment by using 100 seeds of L. perenne and P. lanceolata, soaking the seeds in water at 4 ∘C for 24 h, and then sowing them onto the same soil mixture as described above, but now in 10 rows of 10 seeds each. The germinated seeds were counted after 2 weeks in the same plant-breeding room, and the results were 50 % germination for P. lanceolata and 20 % for L. perenne. The weight of 100 seeds for L. perenne and P. lanceolata was 0.2122 and 0.1428 g respectively. In order to have a composition ratio for monocot (L. perenne) and dicot (P. lanceolata) close to 3 : 1, a mixture of 7.52 g of L. perenne and 0.57 g of P. lanceolata seed was prepared for each mesocosm (7.52 g 0.2122 g × 100 × 0.2 = 708 plants of L. perenne, 0.57 g 0.1428 g × 100 × 0.5 = 199 plants of P. lanceolata, composition ratio is 3.5 : 1). After sowing, the plants were left to grow for a total of 9 weeks. As of 2 weeks after sowing, images were taken weekly for 7 weeks (camera: LEIKA VARIO-SUMMILUX-H1:1,6-2.4/27-BO ASPH) from a fixed height of 80 cm above the mesocosms. Plants were harvested 9 weeks after sowing, and the aboveground biomass of each species was measured after drying at 70 ∘C for 72 h. A schematic diagram of the design of the legacy effect experiment is given in Fig. 1.
2.6 Statistical analysis
We analysed the responses of the soil fauna communities using the Package Codyn (Hallett et al., 2016) in R (version 3.6.1), to calculate community dynamic statistics such as synchrony and stability of the soil fauna community, and community structure statistics such as Shannon's diversity. The degree of synchrony in functional type abundances (different feeding types of nematodes and rotifers) within a community (each plant node of each mesocosm) over time was calculated using Loreau's method, by comparing the temporal variance of the abundance summed across functional types with the summed temporal variance of individual functional types (Loreau and De Mazancourt, 2008). The formula is as follows:
where
with xi = abundance of individual functional group i from the aggregated community at the sampled node of each mesocosm and t = time (1 through 6).
Measured synchrony (per node) is between 0 and 1, with 0 equal to perfect asynchrony and 1 to perfect synchrony. Community stability (per node), the stability of summed feeding type abundances, was calculated as the temporal mean of the summed feeding type abundances divided by their temporal standard deviation (Tilman, 1999). Community diversity was calculated as Shannon's diversity at each sampling time and each plant node (Shannon and Weaver, 1949). The initial Shannon's diversity in the central nodes of all mesocosms was based on the averaged counts of different feeding types of nematodes and rotifers in the inoculum, as shown in Table S2.
In each mesocosm, soil fauna were inoculated in the central plant node. Thus, the abundance of one particular soil fauna type found in a certain node and the distance between that node and the central node can be used to measure its population expansion (PE) at each sampling time in each mesocosm, as follows:
with D = distance and A = abundance.
The theoretically maximum attainable population expansion for each functional group was calculated by multiplication of the maximum abundance found across all nodes in all mesocosms across all time points for that functional group, with the sum of the distances to the central node at each time in each mesocosm (referred to as PEmax), as follows:
We then calculated the population build-up rate as
This is the division of PE by PEmax. This population build-up rate describes at which rate each functional group is building up its population toward the maximum attainable population expansion at each time in each mesocosm. The diffusion was another measure of how fast each soil fauna functional group spread from the central node to the other plant resource patches, calculated as
with ATot = the abundance of a certain soil fauna group summed across all nine nodes of a certain mesocosm at a certain time. Plant biomass varied among the 10 mesocosms at each sampling time, which may differentially affect the population growth of each feeding type of nematodes and rotifers. Thus, is used here to standardize effects of different amounts of plant resources among mesocosms on the abundance of each functional group in each mesocosm at each sampling time. For each soil fauna group, there was only one value of diffusion and of build-up rate for each mesocosm and harvest time.
The calculated community dynamics and nematode spread ability variables were then analysed using linear models in R package afex (mixed function) (Singmann et al., 2016) to test the fixed effect of regularity (continuous) on the soil fauna community synchrony and stability, the fixed effects of regularity, time (continuous) and their interaction on Shannon's diversity, and the fixed effects of regularity, soil fauna functional type (categorical), time, and their interactions on build-up rate and diffusion. Before each sampling event, the amount of plant resources present in each mesocosm was calculated by the sum of the aboveground biomass of all sampled plants multiplied with the currently present plant number per node (i.e. (A1 + A2 + + A9) × 6 for the first sampling time, (B1 + B2 + + B9) × 5 for the second sampling time, (C1 + C2 + + C9) × 4 for the third sampling time, and (F1 + F2 + … + F9) for the last sampling time, with numbers indicating nodes and letters indicating plants harvested per time point in one mesocosm). This was included as a fixed main effect in the linear mixed effect model for build-up rate along with other effects described above. Since our data of community diversity, synchrony, stability, diffusion, and build-up rate did not follow a normal distribution pattern due to a high prevalence of zeros, we used permutation tests (package afex, mixed function, using package pbkrtest, PBmodcomp function) (Singmann et al., 2016) with parametric bootstrapping to calculate p values in linear mixed effect models. The number of simulations were all set to 10 000. Mesocosm was included as random effect in models of node-specific community synchrony and stability. Mesocosm and the interaction between taxon and mesocosm were included as random effects in the models of build-up rate and diffusion. Mesocosm and plant node nested within mesocosm were included as random effects in the model of community diversity.
Digital images of the newly grown vegetation composed of L. perenne and P. lanceolata were analysed using the R package Raster (Hijmans and van Etten, 2012).RGB values were obtained, and greenness was calculated as follows: . Pixels with a greenness value of more than 20 were considered plant and 0–20 soil background, after which plant cover was assessed as the number of plant pixels.
We used images taken at the fourth week (i.e. 6 weeks after sowing the seeds), when plant cover peaked, and the last (i.e. 9 weeks after sowing the seeds) to compare the differences in plant cover decline among mesocosms. We used a negative binomial generalized linear model in R package MASS, glm.nb function (Venables and Ripley, 2002) to analyse the effect of the regularity of previous A. stolonifera plants on the cover (total number of green pixels) by both succeeding plant species combined at week 6 and week 9. A linear model (lm function, R package stats, R core team, 2013) was used to analyse the effect of previous A. stolonifera plants' regularity on the separate and combined biomass of subsequent P. lanceolata and L. perenne harvested and on the biomass ratio of L. perenne and P. lanceolata at the last time photographs were taken (seventh time) and on the total combined aboveground biomass of previous A. stolonifera (i.e. for each mesocosm, A1 + A2 + + A9 + B1 + B2 + + B9 + + F1 + F2 + … + F9 as the total plant biomass produced during the 90 d cultivation period). Model residuals were normally distributed according to Shapiro–Wilk's test.
Pearson product–moment correlations between regularity and other measured variables were calculated using R package PerformanceAnalytics, chart.Correlation function (Peterson and Carl, 2020). Measured variables were the following: abundance of all counted nematode feeding types and rotifers (the sum of all nine plant nodes per mesocosm averaged over all six sampling times), total aboveground biomass of plants across all six times and all nine nodes, synchrony and community stability (averaged per mesocosm across all nine plant nodes), and total aboveground biomass and plant cover of the new L. perenne and P. lanceolata vegetation for each mesocosm.
3.1 The spatial spread of the soil fauna
The spatial configuration of the plants showed no significant effect on the diffusion of our studied soil fauna (Table 1). The diffusion significantly differed among soil fauna functional types and, unsurprisingly, increased significantly over time for all soil fauna groups. There was also a significant interaction between soil fauna functional type and time in their effect on diffusion, implying different diffusion rates among functional groups (Table 1, Fig. 2). Bacterial-feeding nematodes had the fastest diffusion, already colonizing further empty plant nodes by the earlier harvest times, and their diffusion only slowed down toward the end of the experiment. Rotifers and predators followed bacterial-feeding nematodes in their diffusion at early time points. The diffusion of predators to other plant nodes stabilized at low values, while rotifers showed a constantly increasing diffusion throughout the duration of the experiment. Fungal-feeding nematodes were the second-to-last to disperse from the central plant nodes, but still reached relatively fast diffusion towards further plant nodes at later time points. Plant-feeding nematodes were the last to disperse from the central plant nodes and only to the nearest nodes with a very slow speed compared with other functional groups.
Table 1Effect of time, soil fauna functional group, and regularity of the plant spatial network (lower values indicate more clustered configurations) on soil fauna diffusion; effect of A. stolonifera plant biomass per mesocosm, time, soil fauna functional group, and plant regularity on soil fauna population build-up rate; effect of plant regularity on soil fauna community synchrony and stability; effect of time and plant regularity on soil fauna Shannon's diversity. P values were calculated based on parametric bootstrap type III tests.
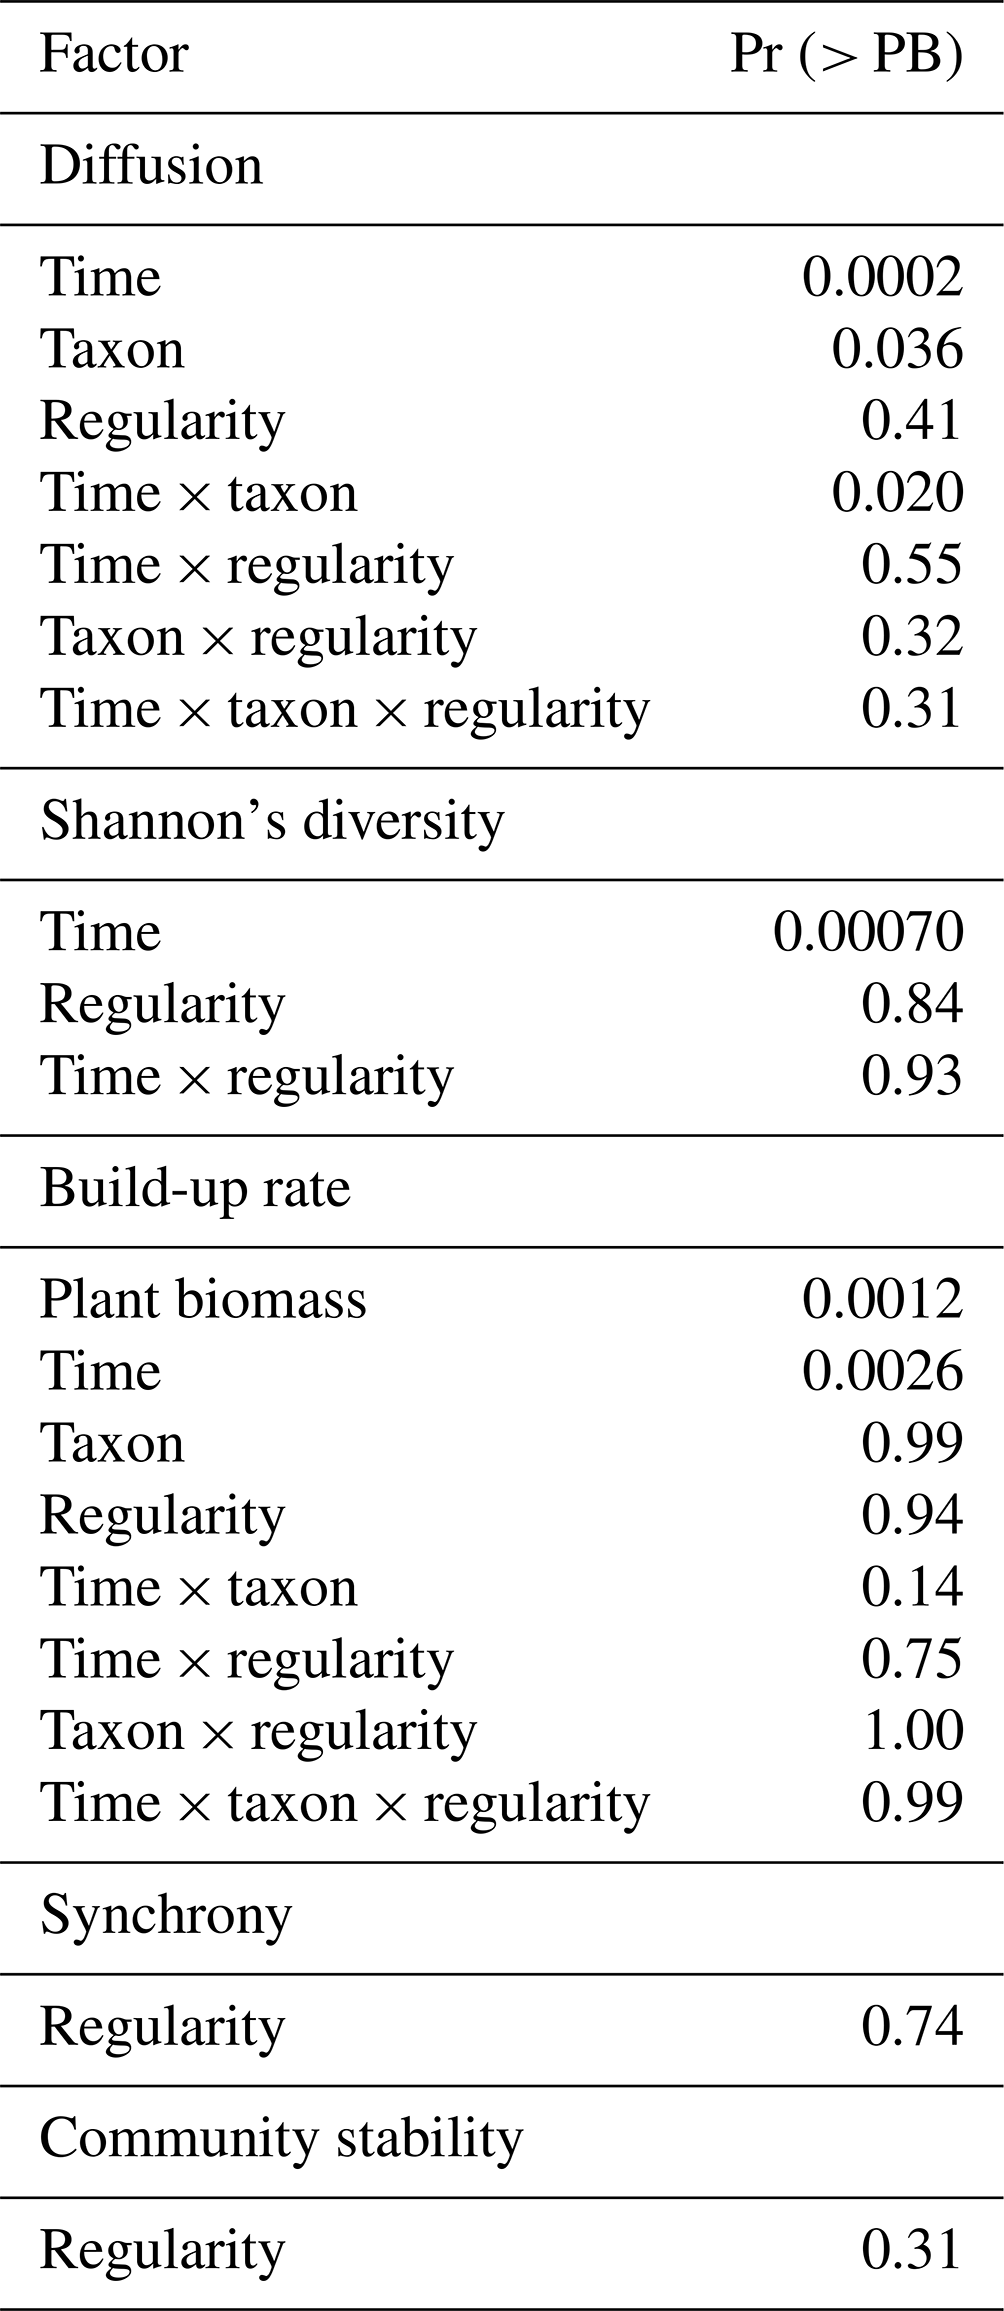

Figure 2Dispersal of soil fauna functional groups and plant biomass over time (0–90 d). The seven sampling times include the time of inoculation. There were 15 d in between sampling times. (a) Diffusion and (b) population build-up rates of each soil fauna functional group; (c) total biomass of the A. stolonifera plants present in the mesocosm. BF: bacterial-feeding nematodes; FF: fungal-feeding nematodes; PF: plant-feeding nematodes; PRE: predatory nematodes; ROT: rotifers. Lines here indicate the predicted diffusion for a mean regularity and population build-up rate for a mean regularity and mean aboveground plant biomass per functional type of nematodes and rotifers across time.
Total mesocosm-level plant biomass and time both showed a significant positive effect on the population build-up rate of our studied soil fauna (Table 1). In general, the population build-up rates were higher in mobile soil fauna such as bacterial-feeding nematodes, rotifers, and fungal-feeding nematodes, and the observed pattern for build-up rate was similar to that for diffusion (Fig. 2b). However, build-up rate did not differ among functional groups of soil fauna in the beginning of the experiment, and at later times showed smaller differences and more variation than diffusion, resulting in a non-significant interaction between time and soil fauna type. Plant biomass per mesocosm increased over time to reach a peak and maximum variation around the fourth sampling time, after which both mean and variance declined again toward the end of the experiment (Fig. 2c). This pattern was expected, as growth of the plants was eventually compensated by the harvesting of one more plant per node at each time step.
3.2 Community dynamics: synchrony, stability, structure
The spatial regularity of the plants showed no significant effect on soil nematode community dynamics in terms of synchrony, stability, or Shannon's diversity (Table 1). Shannon's diversity increased significantly with time as more soil fauna groups dispersed out of the central plant nodes and arrived in the other plant nodes (Fig. 3).
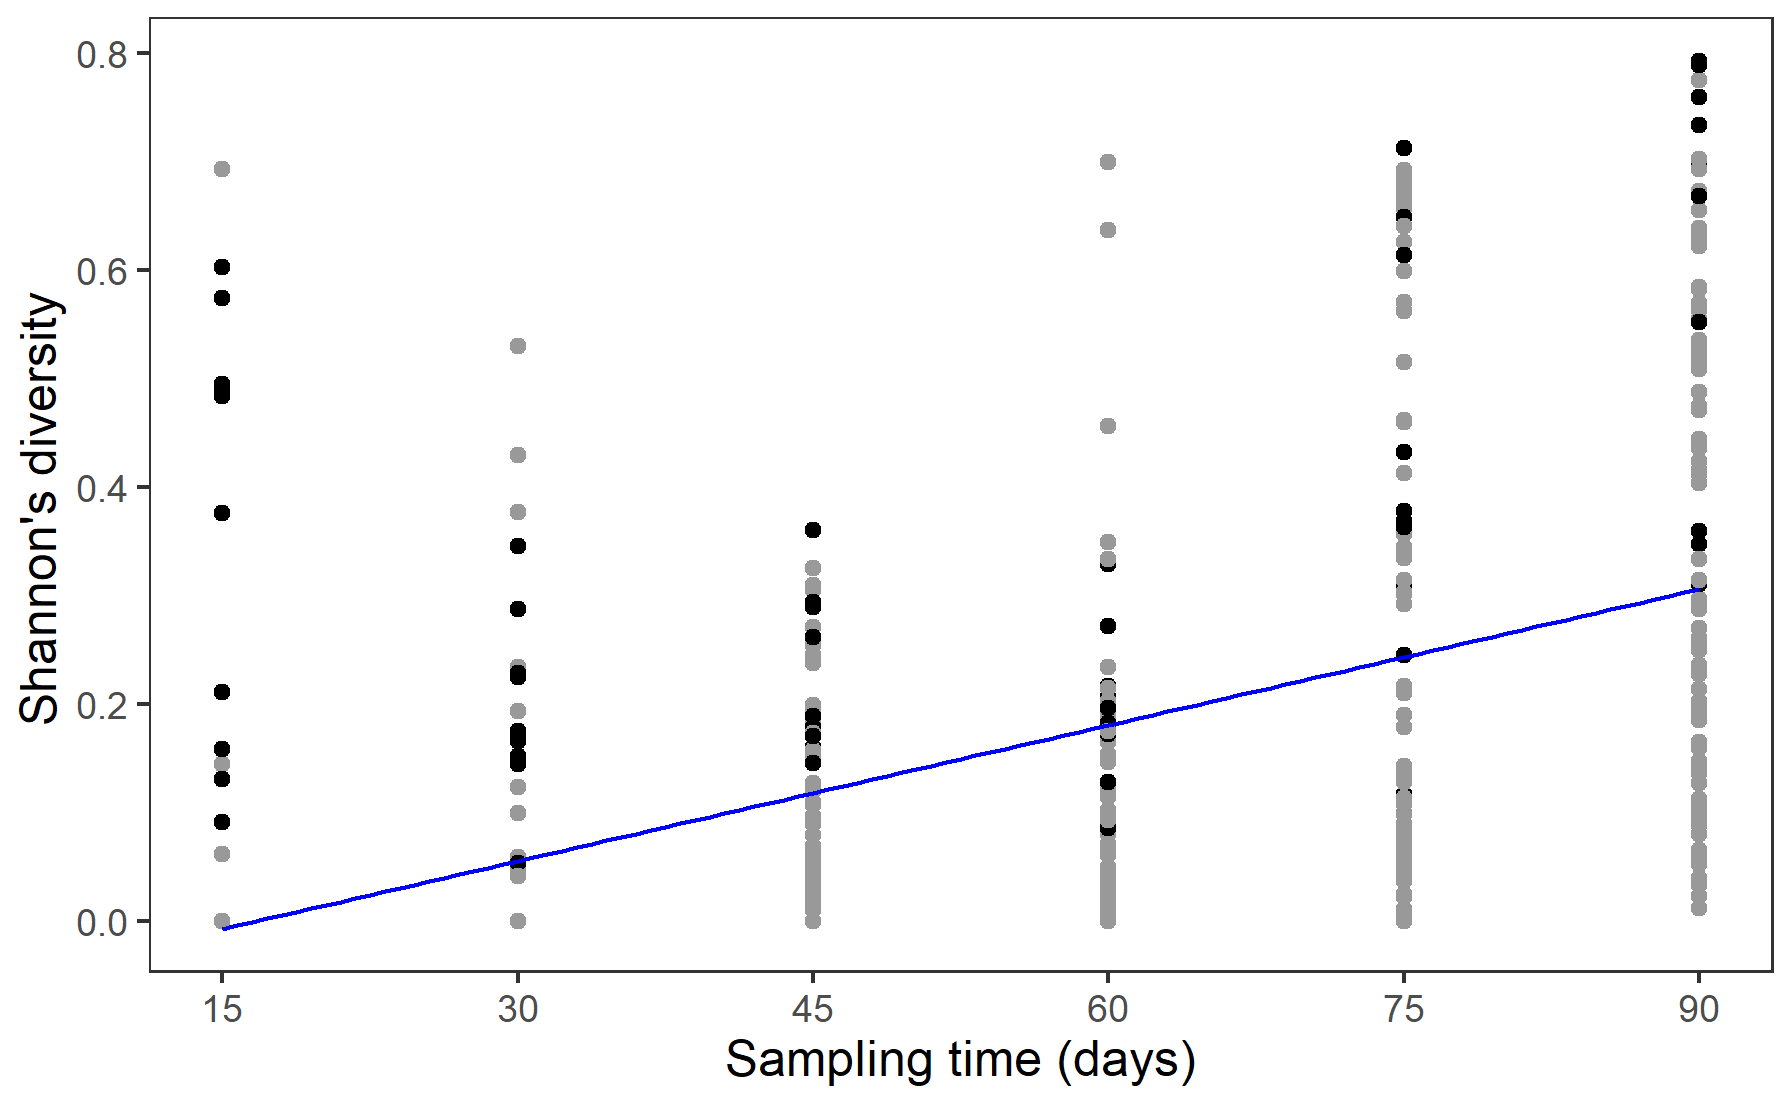
Figure 3Shannon's diversity (SD) of the soil fauna functional groups in each node of all mesocosms across time (inoculation time not included due to the consideration of initial diversity of the inoculum cannot represent the actual diversity of the surviving soil fauna). Line here indicated the predicted Shannon's diversity for a mean regularity across time (days after inoculation time). Black points refer to the species diversity in the central nodes, while grey nodes refer to species diversity in the other nodes in the mesocosms.
3.3 Legacy effect
The accumulated aboveground biomass of the A. stolonifera plants significantly decreased with the regularity of their spatial configuration (Table 2, Fig. 4a). The cover of subsequent plants after the removal of previous A. stolonifera plants increased significantly with the regularity of previous plants' spatial configuration, both at the fourth and seventh measurement time (i.e. 6 and 9 weeks after sowing the seeds for the new vegetation) (Table 2, Figs. 4c, d, S2, and S3). However, their final dry aboveground biomass (combined and separately) and the biomass ratio between L. perenne and P. lanceolata were not significantly affected by the previous plants' spatial configuration (Table 2, Figs. 4b and S4).
Table 2Effect of plant spatial regularity on accumulated aboveground biomass of initial A. stolonifera plants and new L. perenne and P. lanceolata vegetation cover measured at the fourth and seventh measurement time (i.e. 6 and 9 weeks after sowing the seeds), and its aboveground biomass measured at the seventh measurement time. Negative binomial generalized linear models were fit for plant cover by the subsequent vegetation of L. perenne and P. lanceolata. Linear models were fitted for initial A. stolonifera plant biomass and biomass of the subsequent vegetation.
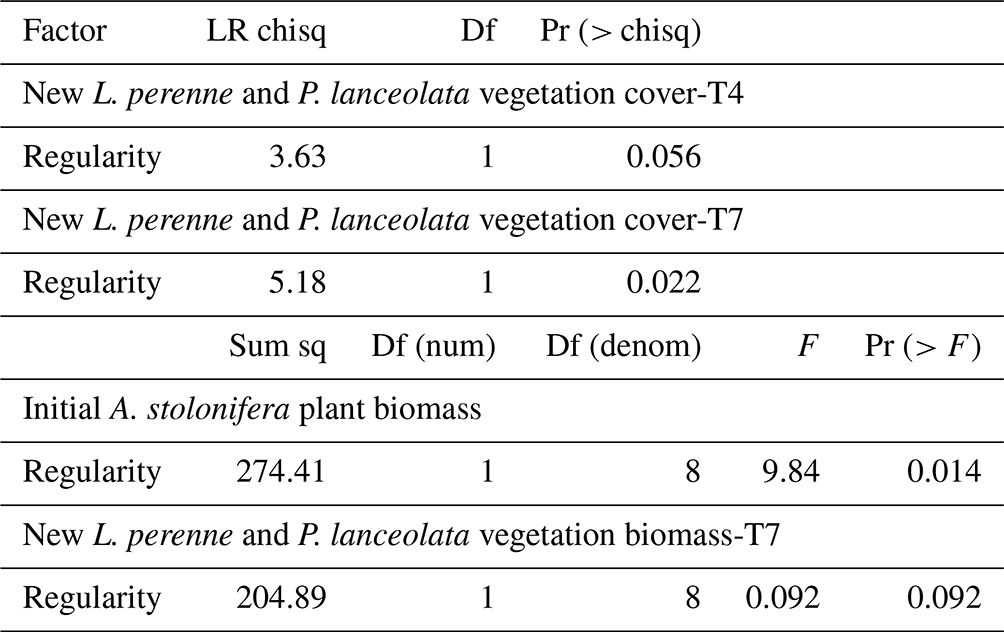
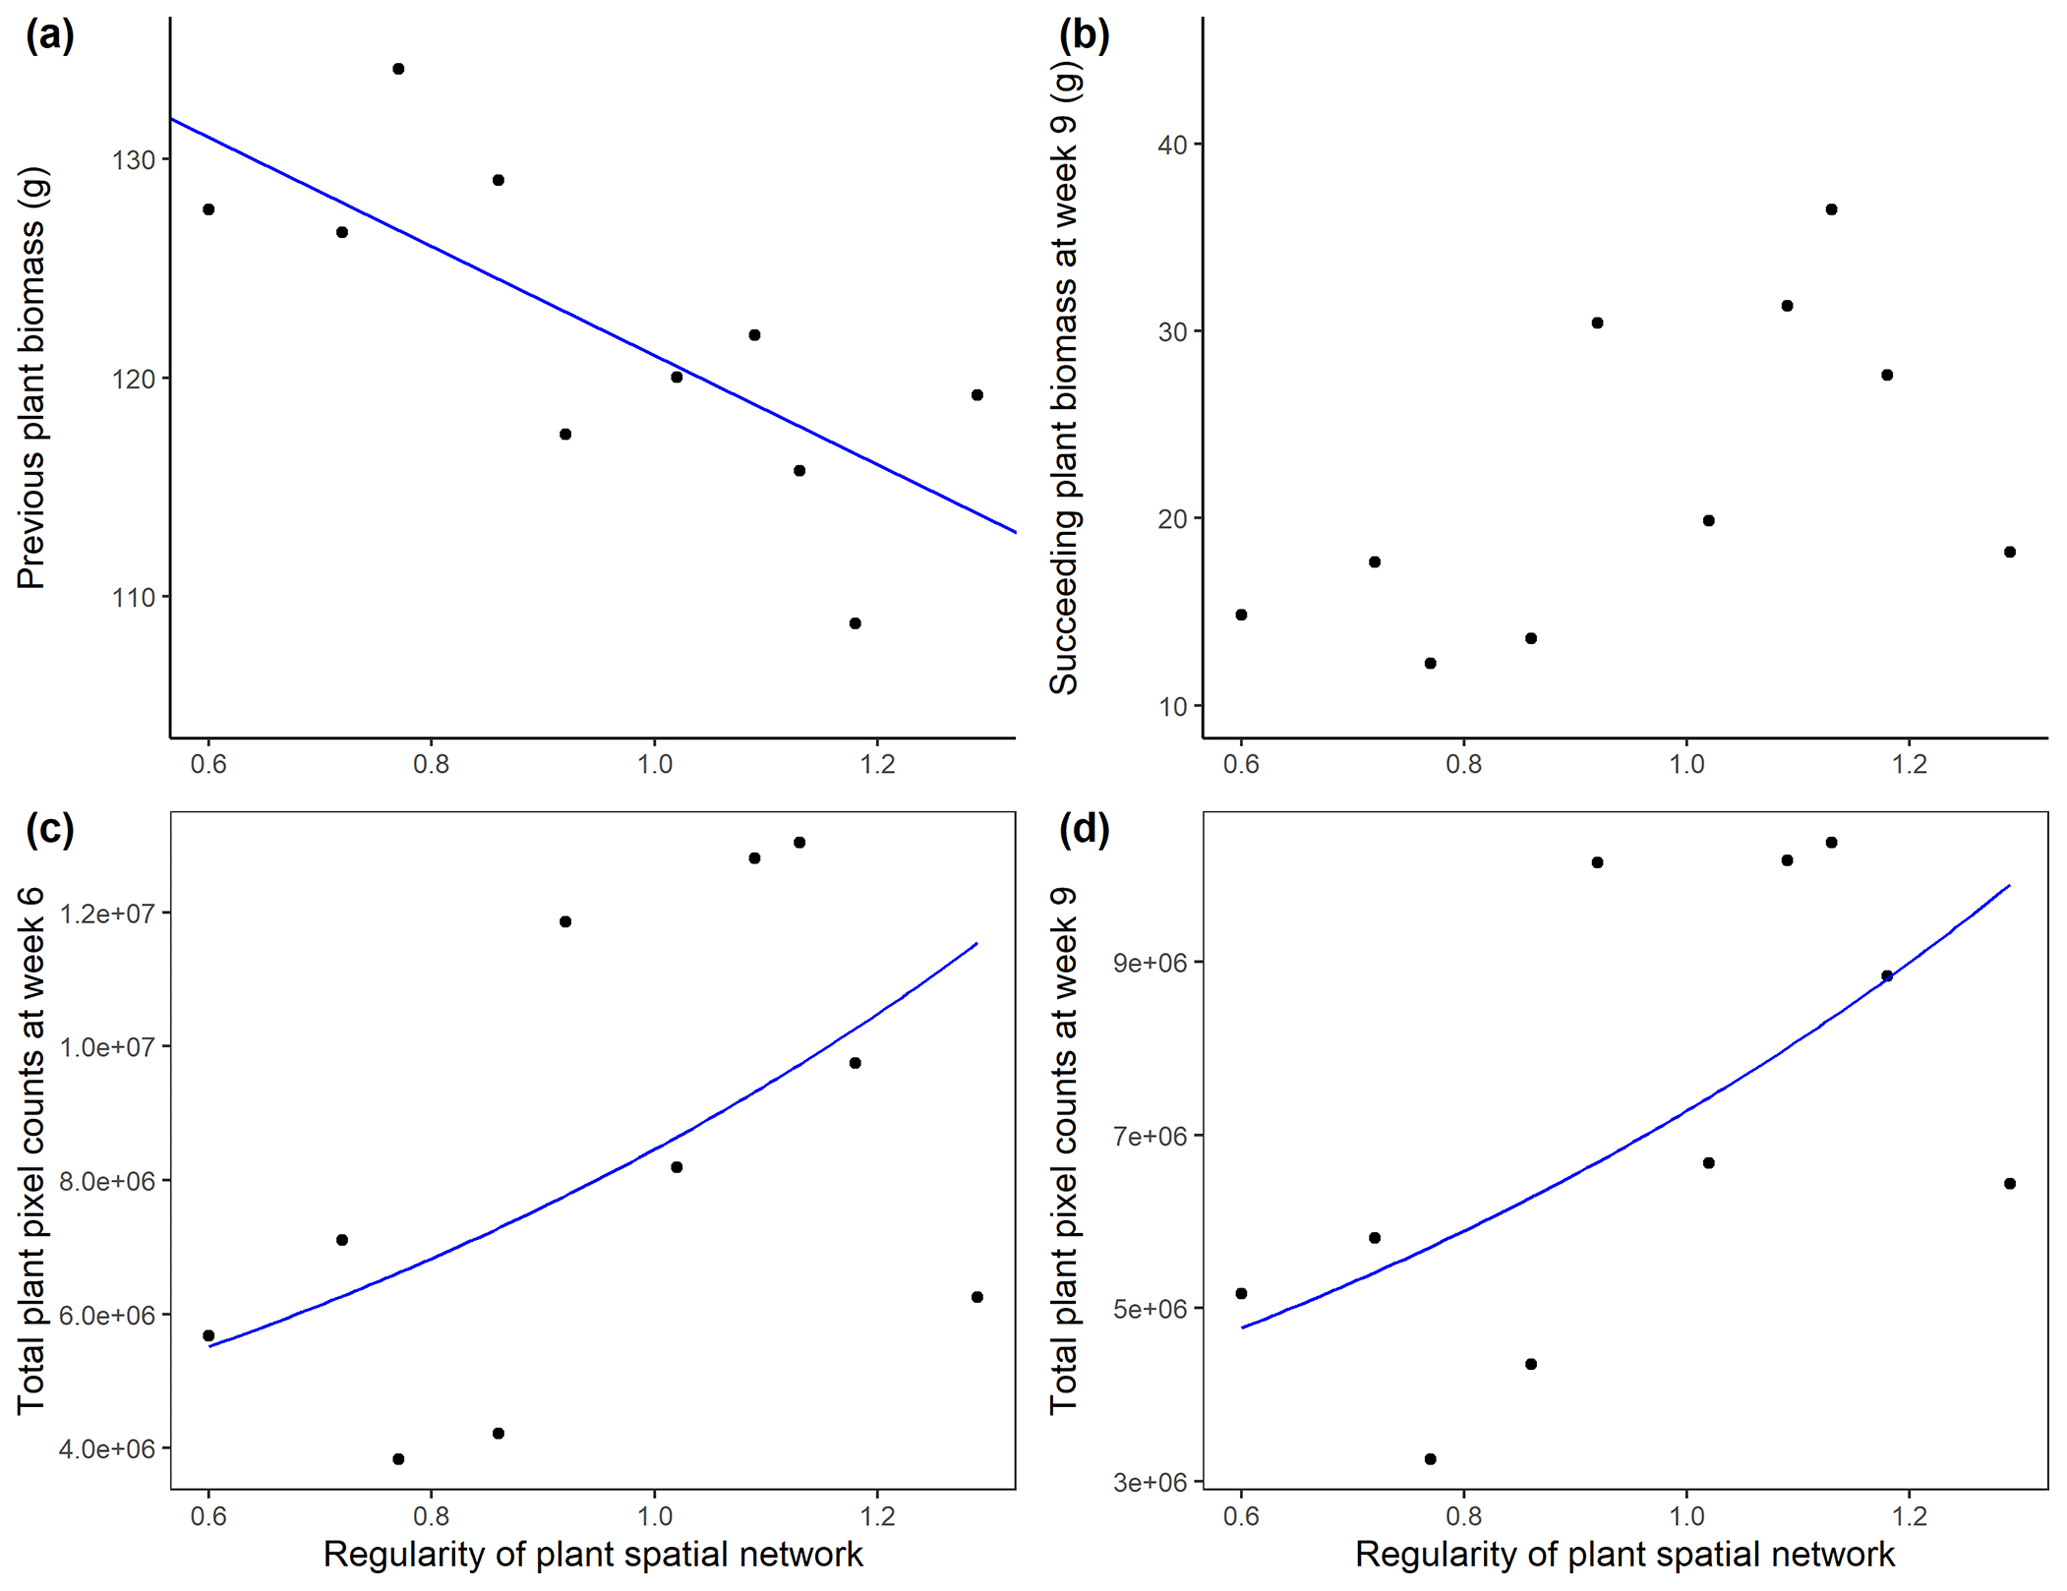
Figure 4Aboveground biomass (g, dry weight) of initial A. stolonifera plants (a) and aboveground biomass in week 9 (b), and plant cover (unitless plant pixel count) in week 6 (c) and week 9 (d) of the newly grown L. perenne and P. lanceolata vegetation as a function of the regularity (unitless) of the initial Agrostis stolonifera plants' spatial configuration.
3.4 Correlation analysis
The abundance of bacterial-feeding nematodes and the synchrony of the soil fauna community were positively correlated (Table 3). The aboveground biomass of L. perenne and P. lanceolata and their percentage cover in the mesocosms were highly positively correlated (Table 3).
Table 3Pearson's correlations among regularity, averaged abundance of all feeding types of nematodes and rotifers, accumulated total biomass of initial A. stolonifera plants, averaged synchrony and stability, and aboveground biomass and plant cover of the new L. perenne and P. lanceolata vegetation.

∗ p < 0.05, p < 0.01, p < 0.001, p < 0.0001.
Reg: regularity; ABF, AFF, APF, APRE, AROT: averaged abundance of the sum of
all nine plant nodes per mesocosm across time of rotifers and
bacterial-feeding, fungal-feeding, plant-feeding, and predatory nematodes,
respectively. PTB: plant total biomass of A. stolonifera; ASYN: averaged
value of synchrony across nine nodes per mesocosm; ASTB: averaged value of
stability across nine nodes per mesocosm; SPB: plant biomass of succeeding
L. perenne and P. lanceolata; SPC: plant cover of succeeding L. perenne and
P. lanceolata.
The abundance of rotifers and synchrony of the soil fauna community were negatively correlated (Table 3). Synchrony and community stability of the soil fauna were negatively correlated (Table 3). The aboveground biomass of A. stolonifera accumulated over all six sampling times was negatively correlated with both the aboveground biomass and cover of the L. perenne and P. lanceolata vegetation (Table 3).
4.1 The spatial spread of the soil fauna
As expected, plant-feeding nematodes showed a distinct pattern of slow dispersal compared with other functional groups of soil fauna. However, contrary to our first hypothesis, the dispersal speed of these plant feeders was not higher when plant patches were more clustered. The community dynamics of the studied soil fauna were largely driven by mobile dispersers such as the bacterial-feeding nematodes and rotifers, which, in accordance with our second hypothesis, quickly colonized all plant patches, regardless of patch configuration. A recent study of distribution patterns of soil nematodes in microplots (0.25 and 1 m2) located on arable fields or semi-natural grasslands (Quist et al., 2017) showed that feeding preference was a main determinant of microscale patchiness in soil nematodes. Bacterivorous and fungivorous taxa had a low level of microscale patchiness, predators showed degrees of local clustering, and plant-feeding nematodes were only detected in a few fields due to their host specificity (Quist et al., 2017). In accordance with their findings, bacterial-feeding nematodes were the first and fastest to colonize all further plant patches in our mesocosm of 80 × 60 cm2. Fungal feeders, though starting off later, also showed a relatively fast diffusion rate. In contrast, plant-feeding nematodes remained where they were introduced and only spread to neighbouring patches. Their different dispersal pattern can be explained by their feeding type characteristics. An integration of trophic group classifications and colonizer-persister groups shows that bacterial-feeding nematodes are mainly found in c-p classes 1–3, fungal feeders in classes 2–4, plant-feeding nematodes in classes 3–5, and predators in classes 4–5 (Bongers, 1990; Bongers and Bongers, 1998). Classes with lower numbers indicate “colonizers”, i.e. nematodes that can rapidly increase in abundance under favourable conditions, while those with higher numbers indicate “persisters”, i.e. nematodes characterized by a low reproduction rate and long life cycle. In line with their c-p category, predatory nematodes had a small population with a relatively fast dispersal ability. Although among the first to move out from the central plant patch, the appearance of live predatory nematodes in the other plant nodes was erratic. This random spatial distribution pattern has been mostly attributed to their varied diet and slow reproduction rate (Park et al., 2013; Quist et al., 2017). Moreover, predatory nematodes, being “persisters”, are most sensitive to disturbance (Bongers, 1990). The relatively low abundance in the initial inoculum along with possible disturbance during the inoculation procedure may also have contributed to this random distribution.
Rotifers have a sliding and fast locomotion (Kutikova, 2003) and can increase their population rapidly due to their amictic reproduction with eggs that do not need to be fertilized (Fontaneto and Ricci, 2006; Ricci, 2001, 1998). Fontaneto and Ricci (2006) found that food resources in different habitat patches could be a strong factor for rotifers to colonize new patches, while geographical distance between sites had no effect on rotifers species composition in two habitat types, suggesting that rotifers were not dispersal-limited. Similarly, rotifers in our study showed a fast dispersal ability to further plant patches, and their diffusion kept increasing for the duration of our experiment. Their population increased rapidly with the increasing amount of plant resources in the mesocosm, as did the population of bacterial-feeding nematodes. This could be because more plant resources can support more bacteria in the rhizosphere as food resource for rotifers and bacterial-feeding nematodes to feed on.
A previous study by Viketoft (2013) has shown that the spatial pattern of soil nematodes at small scales (10 and 60 cm intervals) in semi-natural grasslands can be explained equally by spatial factors (sampling locations), vegetation, and abiotic environmental factors (moisture, pH, and nutrients). The contribution of these determinants differed between different feeding groups: spatial factors had more influence on plant-feeding nematodes, vegetation had more influence on fungal-feeding nematodes and predators, and bacterial-feeding nematodes were more influenced by abiotic factors. In our study, the plants' spatial configuration had no significant effect on the spread of nematodes and rotifers. In addition, all feeding groups of nematodes exhibited similar levels of spatial aggregation in small patches of around 1 m in the field (Viketoft, 2013). This may help explain why at the similarly small scale of our experiment, the spatial configuration of the plants had no effect. If enough time is given, the relatively less mobile nematodes can likely also occupy all the further plant patches regardless of the plants' spatial configuration at the microscale. A larger-scale field study of soil nematodes' spatial distribution by Quist et al. (2019) found that a combination of soil organic matter content and life history characteristics can be used to explain their spatial distribution patterns. The authors argued that opportunistic nematodes can be limited by their own primary food source (bacteria and fungi) which might be differentially stimulated by the organic matter content. The fungal-feeding to bacterial-feeding nematode abundance ratio, an indicator of ecological succession, had a higher value in late-successional stage communities due to a shift from bacterial-dominated to fungal-dominated microbial communities (Kardol et al., 2005; Neher, 2010). We can also see this trend in our study after a relatively short time, as fungal-feeding nematodes keep increasing their diffusion and population build-up rate while bacterial-feeding nematode population build-up already seems to plateau after the 90 d of our experiment. In our study, the soil condition was homogeneous in terms of soil organic matter content and metapopulations of plants were monocultures, which may explain the lack of observed relationships between the soil fauna spatial dynamics and the spatial pattern of the plants. Future studies can use a combination of host and non-host plants or plants with different quality of litter and exudates to expand our knowledge on this aspect.
4.2 Community synchrony, stability, diversity
When species fluctuate asynchronously in a community, responding differentially to variations in their environment, a decrease in one species abundance can be compensated by the increase of another species, ultimately causing no net change in the aggregated community (Loreau and De Mazancourt, 2008). Our results showed no effect of plant spatial configuration on the soil fauna's community dynamics. Only two groups (bacterial-feeding nematodes and rotifers) occupied all plant resource patches regardless of their spatial configurations, whereas other groups stayed relatively close to where they were released. Dispersal and trophic interactions are two key biotic determinants of spatial synchrony (Liebhold et al., 2004). Species with high dispersal abilities often display more spatial synchrony than less mobile species (Paradis et al., 1999). In our case, the calculated community dynamics (synchrony and stability) were largely dependent on the temporal fluctuations of populations of bacterial-feeding nematodes and rotifers in each plant resource patch. We used the Loreau method to calculate community synchrony, which is based on variances and more heavily influenced by abundant species (Hallett et al., 2016). The most abundant were the bacterial-feeding nematodes (10–100 times more abundant than the rotifers). This explains the positive correlation between the synchrony and average abundance of the bacterial-feeding nematodes. Bacterial-feeding nematodes were the first to arrive in vacant plant patches forming large populations, followed by rotifers forming smaller populations.
4.3 Effects of A. stolonifera spatial configuration on its own performance
The key question is why we observed an increased growth of A. stolonifera in clustered spatial configurations. Nematode activity may play an important role here in stimulating plant growth. Studies have shown that plant-feeding nematodes can stimulate microbial growth and activity by increasing root leakage of rhizodeposits due to the damage they cause to roots (Gebremikael et al., 2016). Bacterial-feeding nematodes can furthermore release the nutrients by grazing on the activated microbes which can in turn enhance plant growth (Bardgett et al., 1999; Haase et al., 2007; Poll et al., 2007). However, all these studies either used small pots or mini rhizotrons with large numbers (1000 per plant) of plant-feeding nematodes, which was much higher than in our study (25 per plant at the time of inoculation). Bardgett et al. (1999) showed an increased root growth not only in host white clover plants infected with cyst nematodes but also in the uninfected neighbouring ryegrass when growing together in the microcosms. Possibly, such stimulated growth can also occur in neighbouring plants at much lower nematode densities and depends on the spatial configuration of these plants as suggested by our study. Effects of root leakage, caused by plant-feeding nematodes, on soil microbes, which were added into the mesocosms along with the soil fauna inoculum, may thus have stimulated neighbouring plants more strongly than spatially distant plants. This could explain why A. stolonifera growth increased more in more clustered plant spatial configurations, as also suggested by our previous work (Zhang et al., 2020).
4.4 Legacy effect (PSF)
We did not find better spread or establishment of plant-feeding nematodes among more clustered plant patches as hypothesized. Nevertheless, our results indicated a more negative PSF of clustered A. stolonifera plants on subsequent L. perenne and P. lanceolata vegetation growth, as put forward by our third hypothesis. However, this was not due to larger populations of plant feeders as we predicted. In our study, mesocosms with more clustered spatial configurations of the initial A. stolonifera plants had higher aboveground plant biomass followed by a lower aboveground biomass of the subsequent L. perenne and P. lanceolata vegetation. The increased growth of A. stolonifera in clustered spatial configurations likely caused nutrient depletion given that the initial nutrient levels of all mesocosms were comparable (Bennett and Klironomos, 2019). These stimulated plants would consume more nutrients in the soil to support their growth, which could deplete nutrients for subsequent plants and thus cause the observed negative PSF in more clustered plant configurations, as indicated by the significant negative correlation between total biomass of previous grown A. stolonifera plants and plant cover of later grown vegetation in Table 3. Even though nutrient depletion seems like the most obvious driver of the more negative PSF in clustered A. stolonifera configurations, we cannot rule out some other mechanisms. For example, such a negative PSF could also be caused by plant-pathogenic microorganisms introduced with the inoculum, which also could have thrived better in mesocosms with higher initial plant biomass. Finally, we want to point out that while clustering of plants caused a negative PSF at the local (patch) scale, in real-world ecosystems and at larger spatial scales, this may be compensated by a more positive (or less negative) PSF in nearby patches with a more regular distribution of initial vegetation.
Our results show that the dispersal patterns of soil microfauna were feeding-type specific but not affected by the spatial configurations of plants. However, we observed that plant–soil feedbacks were altered by the configuration of plants in space. Negative plant–soil feedbacks in agricultural systems have been mostly attributed to the build-up of plant-specific soil pathogens and root herbivores (McDonald and Stukenbrock, 2016), which was not obviously observed in our study. Our study therefore points at the importance of considering other possible mechanisms underlying plant–soil feedbacks related to the spatial patterning of plant resources and the dispersal ecology of the soil organisms involved.
The data are original and have been produced during this study. The codes and data are available at Zenodo under the MIT licence: https://doi.org/10.5281/zenodo.7528078 (ZPHSOIL, 2023).
The supplement related to this article is available online at: https://doi.org/10.5194/we-23-1-2023-supplement.
PZ conducted the experiment, analysed the data, and wrote the original draft; DB and MLV conceived and designed the study; DB, MLV, and GDD wrote and edited the paper.
The contact author has declared that none of the authors has any competing interests.
Publisher's note: Copernicus Publications remains neutral with regard to jurisdictional claims in published maps and institutional affiliations.
Financial support from CSC (China Scholarship Council) and the Terrestrial Ecology Unit of Ghent University is gratefully acknowledged. Peihua Zhang was supported by CSC as a doctoral fellow (grant no. 201506190135). We also thank Hans Matheve for assistance with the analysis of digital vegetation images.
This research has been supported by the China Scholarship Council, Chinese Government Scholarship (grant no. 201506190135) and the Terrestrial Ecology Unit of Ghent University.
This paper was edited by Erinne Stirling and reviewed by three anonymous referees.
Arndt, H.: Rotifers as predators on components of the microbial web (bacteria, heterotrophic flagellates, ciliates) – a review, Hydrobiologia, 255, 231–246, https://doi.org/10.1007/BF00025844, 1993.
Ayres, E., Steltzer, H., Simmons, B. L., Simpson, R. T., Steinweg, J. M., Wallenstein, M. D., Mellor, N., Parton, W. J., Moore, J. C., and Wall, D. H.: Home-field advantage accelerates leaf litter decomposition in forests, Soil Biol. Biochem., 41, 606–610, https://doi.org/10.1016/j.soilbio.2008.12.022, 2009.
Baermann, G.: Eine einfache Methode zur Auffindung von Ankylostomum (Nematoden) Larven in Erdproben, Geneeskundig Tijdschrift Voor Nederlandsch-Indie Batavia, 57, 131–137, 1917.
Bardgett, R. D. and Van Der Putten, W. H.: Belowground biodiversity and ecosystem functioning, Nature, 515, 505–511, https://doi.org/10.1038/nature13855, 2014.
Bardgett, R. D., Denton, C. S., and Cook, R.: Below-ground herbivory promotes soil nutrient transfer and root growth in grassland, Ecol. Lett., 2, 357–360, https://doi.org/10.1046/j.1461-0248.1999.00001.x, 1999.
Bennett, J. A. and Klironomos, J.: Mechanisms of plant–soil feedback: interactions among biotic and abiotic drivers, New Phytol., 222, 91–96, https://doi.org/10.1111/nph.15603, 2019.
Benton, T. G. and Bowler, D. E.: Dispersal in invertebrates: influences on individual decisions, in: Dispersal Ecology and Evolution, edited by: Clobert, J., Baguette, M., Benton, T. G., and Bullock, J. M., Oxford University Press, 41–49, https://doi.org/10.1093/acprof:oso/9780199608898.003.0004, 2012.
Bongers, T.: The maturity index: an ecological measure of environmental disturbance based on nematode species composition, Oecologia, 83, 14–19, https://doi.org/10.1007/BF00324627, 1990.
Bongers, T. and Bongers, M.: Functional diversity of nematodes, Appl. Soil Ecol., 10, 239–251, https://doi.org/10.1016/S0929-1393(98)00123-1, 1998.
Bonte, D., Van Dyck, H., Bullock, J.M., Coulon, A., Delgado, M., Gibbs, M., Lehouck, V., Matthysen, E., Mustin, K., Saastamoinen, M., Schtickzelle, N., Stevens, V. M., Vandewoestijne, S., Baguette, M., Barton, K., Benton, T. G., Chaput-Bardy, A., Clobert, J., Dytham, C., Hovestadt, T., Meier, C. M., Palmer, S. C. F., Turlure, C., and Travis, J. M. J.: Costs of dispersal, Biol. Rev., 87, 290–312, https://doi.org/10.1111/j.1469-185X.2011.00201.x, 2012.
Bukovinszky, T., Bakker, E. S., Raaijmakers, C. E., Verschoor, A. M., and Bezemer, T. M.: Host location success of root-feeding nematodes in patches that differ in size and quality: A belowground release-recapture experiment, Basic Appl. Ecol., 13, 221–231, https://doi.org/10.1016/j.baae.2012.03.002, 2012.
Calabrese, J. M. and Fagan, W. F.: A comparison-shopper's guide to connectivity metrics, Front. Ecol. Environ., 2, 529–536, https://doi.org/10.1890/1540-9295(2004)002[0529:ACGTCM]2.0.CO;2, 2004.
Cesarano, G., Zotti, M., Antignani, V., Marra, R., Scala, F., and Bonanomi, G.: Soil sickness and negative plant-soil feedback: A reappraisal of hypotheses, J. Plant Pathol., 99, 545–570, https://doi.org/10.4454/jpp.v99i3.3960, 2017.
Clobert, J., Le Galliard, J. F., Cote, J., Meylan, S., and Massot, M.: Informed dispersal, heterogeneity in animal dispersal syndromes and the dynamics of spatially structured populations, Ecol. Lett., 12, 197–209, https://doi.org/10.1111/j.1461-0248.2008.01267.x, 2009.
Coleman, D. C., Crossley, D. A., and Hendrix, P. F.: Fundamentals of Soil Ecology, Elsevier Academic Press, Amsterdam, https://doi.org/10.1016/C2015-0-04083-7, 2004.
Cortois, R., Schröder-Georgi, T., Weigelt, A., van der Putten, W. H., and De Deyn, G. B.: Plant–soil feedbacks: role of plant functional group and plant traits, J. Ecol., 104, 1608–1617, https://doi.org/10.1111/1365-2745.12643, 2016.
De Deyn, G. B., Raaijmakers, C. E., Van Ruijven, J., Berendse, F., and Van Der Putten, W. H.: Plant species identity and diversity effects on different trophic levels of nematodes in the soil food web, Oikos, 106, 576–586, https://doi.org/10.1111/j.0030-1299.2004.13265.x, 2004.
De Goede, R. G. M., Georgieva, S. S., Verschoor, B. C., and Kamerman, J. W.: Changes in nematode community structure in a primary succession of blown-out areas in a drift sand landscape, Fund. Appl. Nematol., 16, 501–513, 1993.
Ettema, C. H. and Bongers, T.: Characterization of nematode colonization and succession in disturbed soil using the Maturity Index, Biol. Fert. Soils, 16, 79–85, https://doi.org/10.1007/BF00369407, 1993.
Ettema, C. H. and Wardle, D. A.: Spatial soil ecology, Trends Ecol. Evol., 17, 177–183, https://doi.org/10.1016/S0169-5347(02)02496-5, 2002.
Fontaneto, D. and Ricci, C.: Spatial gradients in species diversity of microscopic animals: The case of bdelloid rotifers at high altitude, J. Biogeogr., 33, 1305–1313, https://doi.org/10.1111/j.1365-2699.2006.01502.x, 2006.
Forman, R. T. T.: Land Mosaics: The Ecology of Landscapes and Regions, Cambridge University Press, Cambridge, https://doi.org/10.1016/0169-5347(96)88908-7, 1995.
Gebremikael, M. T., Steel, H., Buchan, D., Bert, W., and De Neve, S.: Nematodes enhance plant growth and nutrient uptake under C and N-rich conditions, Sci. Rep., 6, 32862, https://doi.org/10.1038/srep32862, 2016.
Glassman, S. I., Lubetkin, K. C., Chung, J. A., and Bruns, T. D.: The theory of island biogeography applies to ectomycorrhizal fungi in subalpine tree “islands” at a fine scale, Ecosphere, 8, e01677, https://doi.org/10.1002/ecs2.1677, 2017.
Haase, S., Ruess, L., Neumann, G., Marhan, S., and Kandeler, E.: Low-level herbivory by root-knot nematodes (Meloidogyne incognita) modifies root hair morphology and rhizodeposition in host plants (Hordeum vulgare), Plant Soil, 301, 151–164, https://doi.org/10.1007/s11104-007-9431-1, 2007.
Hallett, L. M., Jones, S. K., MacDonald, A. A. M., Jones, M. B., Flynn, D. F. B., Ripplinger, J., Slaughter, P., Gries, C., and Collins, S. L.: codyn: An r package of community dynamics metrics, Methods Ecol. Evol., 7, 1146–1151, https://doi.org/10.1111/2041-210X.12569, 2016.
Hanski, I.: Metapopulation dynamics, Nature, 396, 41–49, https://doi.org/10.1038/23876, 1998.
Hijmans, R.J. and van Etten, J.: raster: Geographic analysis and modeling with raster data, R package version 2.0-12, http://CRAN.R-project.org/package=raster (last access: 12 January 2023), 2012.
Ingimarsdóttir, M., Caruso, T., Ripa, J., Magnúsdóttir, Ó. B., Migliorini, M., and Hedlund, K.: Primary assembly of soil communities: Disentangling the effect of dispersal and local environment, Oecologia, 170, 745–754, https://doi.org/10.1007/s00442-012-2334-8, 2012.
Kardol, P., Bezemer, T. M., Van Der Wal, A., and Van Der Putten, W. H.: Successional trajectories of soil nematode and plant communities in a chronosequence of ex-arable lands, Biol. Conserv., 126, 317–327, https://doi.org/10.1016/j.biocon.2005.06.005, 2005.
Kutikova, L. A.: Bdelloid rotifers (Rotifera, Bdelloidea) as a component of soil and land Biocenoses, Biology Bull., 30, 271–274, https://doi.org/10.1023/A:1023811929889, 2003.
Lehmitz, R., Russell, D., Hohberg, K., Christian, A., and Xylander, W. E. R.: Active dispersal of oribatid mites into young soils, Appl. Soil Ecol., 55, 10–19, https://doi.org/10.1016/j.apsoil.2012.11.001, 2012.
Liebhold, A., Koenig, W. D., and Bjørnstad, O. N.: Spatial Synchrony in Population Dynamics, Annu. Rev. Ecol. Evol. S., 35, 467–490, https://doi.org/10.1146/annurev.ecolsys.34.011802.132516, 2004.
Liu, T., Hu, F., and Li, H.: Spatial ecology of soil nematodes: Perspectives from global to micro scales, Soil Biol. Biochem., 137, 107565, https://doi.org/10.1016/j.soilbio.2019.107565, 2019.
Loreau, M. and De Mazancourt, C.: Species synchrony and its drivers: Neutral and nonneutral community dynamics in fluctuating environments, Am. Nat., 172, E48–E66, https://doi.org/10.1086/589746, 2008.
Madritch, M. D. and Lindroth, R. L.: Soil microbial communities adapt to genetic variation in leaf litter inputs, Oikos, 120, 1696–1704, https://doi.org/10.1111/j.1600-0706.2011.19195.x, 2011.
Mariotte, P., Mehrabi, Z., Bezemer, T. M., De Deyn, G. B., Kulmatiski, A., Drigo, B., Veen, G. F., van der Heijden, M. G. A., and Kardol, P.: Plant–soil feedback: bridging natural and agricultural sciences, Trends Ecol. Evol., 33, 129–142, https://doi.org/10.1016/j.tree.2017.11.005, 2018.
May, L. and Wallace, R. L.: An examination of long-term ecological studies of rotifers: comparability of methods and results, insights into drivers of change and future research challenges, Hydrobiologia, 844, 129–147, https://doi.org/10.1007/s10750-019-04059-2, 2019.
McDonald, B. A. and Stukenbrock, E. H.: Rapid emergence of pathogens in agro-ecosystems: Global threats to agricultural sustainability and food security, Philos. T. Roy. Soc. B, 371, 20160026, https://doi.org/10.1098/rstb.2016.0026, 2016.
Mony, C., Vannier, N., Brunelliere, P., Biget, M., Coudouel, S., and Vandenkoornhuyse, P.: The influence of host-plant connectivity on fungal assemblages in the root microbiota of Brachypodium pinnatum, Ecology, 101, e02976, https://doi.org/10.1002/ecy.2976, 2020.
Neher, D. A.: Ecology of plant and free-living nematodes in natural and agricultural soil, Annu. Rev. Phytopathol., 48, 371–394, https://doi.org/10.1146/annurev-phyto-073009-114439, 2010.
Paradis, E., Baillie, S. R., Sutherland, W. J., and Gregory, R. D.: Dispersal and spatial scale affect synchrony in spatial population dynamics, Ecol. Lett., 2, 114–120, https://doi.org/10.1046/j.1461-0248.1999.22060.x, 1999.
Park, S. J., Taylor, R. A. J., and Grewal, P. S.: Spatial organization of soil nematode communities in urban landscapes: Taylor's Power Law reveals life strategy characteristics, Appl. Soil Ecol., 64, 214–222, https://doi.org/10.1016/j.apsoil.2012.11.001, 2013.
Peay, K. G., Garbelotto, M., and Bruns, T. D.: Evidence of dispersal limitation in soil microorganisms: Isolation reduces species richness on mycorrhizal tree islands, Ecology, 91, 3631–3640, https://doi.org/10.1890/09-2237.1, 2010.
Peterson, B. G. and Carl, P.: PerformanceAnalytics: Econometric Tools for Performance and Risk Analysis, R package version 2.0.4, https://CRAN.R-project.org/package=PerformanceAnalytics (last access: 12 January 2023), 2020.
Poll, J., Marhan, S., Haase, S., Hallmann, J., Kandeler, E., and Ruess, L.: Low amounts of herbivory by root-knot nematodes affect microbial community dynamics and carbon allocation in the rhizosphere, FEMS Microbiol. Ecol., 62, 268–279, https://doi.org/10.1111/j.1574-6941.2007.00383.x, 2007.
R Core Team: R: A language and environment for statistical computing, R Foundation for Statistical Computing, Vienna, Austria, ISBN 3-900051-07-0, http://www.R-project.org/ (last access: 12 January 2023), 2013.
Quist, C. W., Gort, G., Mulder, C., Wilbers, R. H. P., Termorshuizen, A. J., Bakker, J., and Helder, J. : Feeding preference as a main determinant of microscale patchiness among terrestrial nematodes, Mol. Ecol. Resour., 17, 1257–1270, https://doi.org/10.1111/1755-0998.12672, 2017.
Quist, C. W., Gort, G., Mooijman, P., Brus, D. J., van den Elsen, S., Kostenko, O., Vervoort, M., Bakker, J., van der Putten, W. H., and Helder, J.: Spatial distribution of soil nematodes relates to soil organic matter and life strategy, Soil Biol. Biochem., 136, 107542, https://doi.org/10.1016/j.soilbio.2019.107542, 2019.
Ricci, C.: Anhydrobiotic capabilities of bdelloid rotifers, Hydrobiologia, 387, 321–326, https://doi.org/10.1023/A:1017086425934, 1998.
Ricci, C.: Dormancy patterns in rotifers, Hydrobiologia, 446–447, 1–11, https://doi.org/10.1023/A:1017548418201, 2001.
Shannon, C. E. and Weaver, W.: The Mathematical Theory of Communication, University of Illinois Press, Urbana, https://doi.org/10.1002/j.1538-7305.1948.tb01338.x, 1949.
Singmann, H., Bolker, B., Westfall, J., and Aust, F.: afex: Analysis of Factorial Experiments, R package version 0.16-1, https://CRAN.R-project.org/package=afex (last access: 12 January 2023), 2016.
Steel, H., Verdoodt, F., Čerevková, A., Couvreur, M., Fonderie, P., Moens, T., and Bert, W.: Survival and colonization of nematodes in a composting process, Invertebr. Biol., 132, 108–119, https://doi.org/10.1111/ivb.12020, 2013.
Tilman, D.: The ecological consequences of changes in biodiversity: A search for general principles, Ecology, 80, 1455–1474, https://doi.org/10.2307/176540, 1999.
Vandegehuchte, M. L., de la Peña, E., and Bonte, D.: Interactions between root and shoot herbivores of Ammophila arenaria in the laboratory do not translate into correlated abundances in the field, Oikos, 119, 1011–1019, https://doi.org/10.1111/j.1600-0706.2009.18360.x, 2010.
Van Der Putten, W. H. and Van Der Stoel, C. D.: Plant parasitic nematodes and spatio-temporal variation in natural vegetation, Appl. Soil Ecol., 10, 253–262, https://doi.org/10.1016/S0929-1393(98)00124-3, 1998.
Van der Putten, W. H., Bardgett, R. D., Bever, J. D., Bezemer, T. M., Casper, B. B., Fukami, T., Kardol, P., Klironomos, J. N., Kulmatiski, A., Schweitzer, J. A., Suding, K. N., Van de Voorde, T. F. J., and Wardle, D. A.: Plant-soil feedbacks: The past, the present and future challenges, J. Ecol., 101, 265–276, https://doi.org/10.1111/1365-2745.12054, 2013.
Venables, W. N. and Ripley, B. D.: Modern Applied Statistics with S, 4th edition, Springer, New York, ISBN 0-387-95457-0, https://www.stats.ox.ac.uk/pub/MASS4/ (last access: 12 January 2023), 2002.
Viketoft, M.: Plant induced spatial distribution of nematodes in a semi-natural grassland, Nematology, 9, 131–142, https://doi.org/10.1163/156854107779969727, 2007.
Viketoft, M.: Determinants of small-scale spatial patterns: Importance of space, plants and abiotics for soil nematodes, Soil Biol. Biochem., 62, 92–98, https://doi.org/10.1016/j.soilbio.2013.03.012, 2013.
Viketoft, M., Palmborg, C., Sohlenius, B., Huss-Danell, K., and Bengtsson, J.: Plant species effects on soil nematode communities in experimental grasslands, Appl. Soil Ecol., 30, 90–103, https://doi.org/10.1016/j.apsoil.2005.02.007, 2005.
Viketoft, M., Bengtsson, J., Sohlenius, B., Berg, M. P., Petchey, O., Palmborg, C., and Huss-Danell, K.: Long-term effects of plant diversity and composition on soil nematode communities in model grasslands, Ecology, 90, 90–99, https://doi.org/10.1890/08-0382.1, 2009.
Wardle, D. A., Bardgett, R. D., Klironomos, J. N., Setälä, H., Van Der Putten, W. H., and Wall, D. H.: Ecological linkages between aboveground and belowground biota, Science, 304, 1629–1633, https://doi.org/10.1126/science.1094875, 2004.
Weil, R. and Brady, N.: The Nature and Properties of Soils, Pearson Education Limited, USA, https://doi.org/10.1023/A:1016012810895, 2017.
Wharton, D. A.: A functional biology of nematodes, Croom Helm, London, https://doi.org/10.1007/978-1-4615-8516-9, 1986.
Whitehead, A. G. and Hemming, J. R.: A comparison of some quantitative methods of extracting small vermiform nematodes from soil, Ann. Appl. Biol., 55, 25–38, https://doi.org/10.1111/j.1744-7348.1965.tb07864.x, 1965.
Wilschut, R. A., van der Putten, W. H., Garbeva, P., Harkes, P., Konings, W., Kulkarni, P., Martens, H., and Geisen, S.: Root traits and belowground herbivores relate to plant–soil feedback variation among congeners, Nat. Commun., 10, 1564, https://doi.org/10.1038/s41467-019-09615-x, 2019.
Zhang, P., Bonte, D., De Deyn, G. B., and Vandegehuchte, M. L.: Belowground plant-plant signaling of root infection by nematodes, Pedobiologia, 83, 150688, https://doi.org/10.1016/j.pedobi.2020.150688, 2020.
ZPHSOIL: ZPHSOIL/DATA-CODE-for-WEB-ECOLOGY: The data and code for the publication of data and code used in WEB ECOLOGY (v1.0.0), Zenodo [data set, code], https://doi.org/10.5281/zenodo.7528078, 2023.