the Creative Commons Attribution 4.0 License.
the Creative Commons Attribution 4.0 License.
 | 04 Jul 2024
Towards spatial predictions of disease transmission risk: classical scrapie spill-over from domestic small ruminants to wild cervids
Leonor Orge
Joana Vicente
João Alexandre Cabral
José Aranha
João Carvalho
Rita Tinoco Torres
Jorge Pereira
Renata Carvalho
Maria Anjos Pires
Madalena Vieira-Pinto
Spatial epidemiology tools play a critical role in effectively allocating resources to curb the spread of animal diseases. This study focuses on classical scrapie (CS), an animal prion disease identified in Portugal, which infects small ruminant flocks and has been shown to be experimentally transmissible to wild cervids. Utilising remote sensing technologies and semi-automatic classification models, we aimed to evaluate the risk of interspecies prion transmission from domestic small ruminants to wild cervids (hosts). To achieve this, we gathered data related to hosts and infected small ruminant flocks. Furthermore, we collected and processed freely available, medium-resolution satellite imagery to derive vegetative and biophysical spectral indices capable of representing the primary habitat features. By employing a pixel-based species distribution model, we integrated the compiled geographical distribution data and spectral data with five supervised classification algorithms (random forest, classification tree analysis, artificial neural network, generalised linear model, and generalised additive model). The consensus map allowed accurate predictions of spatialised regions exhibiting spectral characteristics similar to where CS and its hosts were initially identified. By overlapping suitable territories for disease and host occurrence, we created a spatially explicit tool that assesses the risk of prion spill-over from domestic small ruminants to wild cervids. The described methodology is highly replicable and freely accessible, thus emphasising its practical utility. This study underscores the substantial contribution of model-based spatial analysis to disease monitoring and lays the groundwork for defining populations at risk and implementing targeted control and prevention strategies, thus safeguarding both animal and public health.
- Article
(5782 KB) - Full-text XML
-
Supplement
(218 KB) - BibTeX
- EndNote


Classical scrapie (CS) is a transmissible spongiform encephalopathy with the longest documented history among known animal prion diseases (Greenlee, 2014). Known as a fatal infectious neurodegenerative disease that naturally affects sheep and goats worldwide, CS can result in relevant economic losses due to decreased production rates, exports, and carcass disposal costs (Keough et al., 2019). Within the European Union, CS falls under surveillance, control, and eradication programmes based on regulation (EC) no. 999/2001 and subsequent amendments (Commission regulation, 2006). These programmes encompass passive surveillance of animals displaying neurological symptoms and active surveillance involving the collection of samples from slaughtered domestic small ruminants intended for human consumption as well as from fallen stock. Portugal, in alignment with this approach, maintains an ongoing CS surveillance programme which from 2008 to 2020 identified a total of 39 sheep CS cases distributed across 16 flocks (Ricci et al., 2018; Union, T. E., 2022).
Under natural conditions, the transmission of CS occurs prenatally from ewe to lamb and during the periparturient period predominantly via oral consumption of colostrum and milk, but also from the placenta and fetal fluids infected and from contaminated biological material that could also infect other animals occurring in sympatry (Cassmann and Greenlee, 2020). Interspecies prion transmission was demonstrated by several authors (Hamir et al., 2004; Greenlee et al., 2011; Dagleish et al., 2008; Cassmann et al., 2021), where CS and bovine spongiform encephalopathy (BSE) prions were experimentally transmitted to cervids. This is followed by a long asymptomatic incubation period, usually between 2 to 7 years, during which infected animals are a source of further contamination (Beringue and Andreoletti, 2014).
The European Food Safety Authority recommended that prion disease surveys should target wild cervids likely to have been exposed to BSE and/or CS. The probability of wild cervids species in Portugal being exposed to prion disease is non-negligible as Portugal had a high BSE prevalence (Orge et al., 2015), and an emergence of CS in a background of enzootic atypical scrapie was also reported in sheep and goats (Orge et al., 2010; Marín-Moreno et al., 2021).
In Portugal, in recent decades, the distribution range and population size of wild cervids (red deer Cervus elaphus and roe deer Capreolus capreolus) have experienced remarkable expansion and growth (Carvalho et al., 2018; Valente et al., 2020), leading to potential contact with CS prions due to shared extensive grazing areas with domestic small ruminant flocks. Furthermore, wild cervids are subject to hunting, exposing them to direct and indirect human contact. Given their broad distribution and habitat transitions between natural and human-altered areas, wild cervids have emerged as important sentinels for tracking the spread of diverse zoonotic diseases (Figueiredo et al., 2023). In the event of disease outbreaks, the ability to prioritise intervention areas and implement cost-effective control strategies is of paramount significance for risk managers, including veterinary competent authorities and policymakers.
Advancements in remote sensing and data analysis modelling techniques have paved the way for innovative methodologies to appear, aiming to create spatially explicit risk assessments for potential interspecies prion transmission (Li et al., 2023). The application of species distribution models (SDMs) is usual in scenarios of uncertainty (He et al., 2019; Domisch et al., 2019) and provides a useful baseline for risk assessment (Wilson et al., 2013; Kopsco et al., 2022; Simons et al., 2019). To predict the potential distribution of a given species, SDMs rely on how species distribution (occurrence in known locations) is influenced by a set of ecologically relevant environmental variables that may restrict or favour the distribution of the species in space (e.g. temperature, topography, precipitation) (Li et al., 2023; Naimi and Araújo, 2016).
The application of SDM techniques allows the combination of different supervised classification algorithms to obtain a final consensus (an ensemble) of areas suitable for species occurrence (Hao et al., 2019). However, these environmental variables (e.g. climatic) are usually associated with a low spatial resolution (1 km) that creates coarse results that may not compatible with the needs and capacities of authorities to implement spatial defined local actions.
Satellite remote sensing approaches are valuable for monitoring the earth's reflectance across several regions of the electromagnetic spectrum with a medium spatial resolution (30 m in the case of Landsat spectral imagery). These products are increasingly used by the scientific community for multiple purposes due to being freely accessible on web platforms (i.e. Google Earth Engine, Copernicus Browser, EarthExplorer) and offer standardised information across time and space (Wilson et al., 2013).
Satellite-based vegetative indexes are often used to discriminate levels of vegetation covers, green biomass, and plant grow velocity, allowing the study of various ecological processes within a territory (Knott et al., 2023; Lastovicka et al., 2020; Forkuor et al., 2020). Also, the surface temperature can be used as a proxy to understand the landscape composition, since the surface temperature is influenced by the surrounding physical environment and anthropogenic land uses (Janani et al., 2023). Satellite information enables the discrimination of different niches in the landscape, allowing SDMs to deeply explore relations between species' presence and the territory. By incorporating vegetative and biophysical indexes into pixel-based SDMs (Mouta et al., 2021), it is possible to detect (in a semi-automatic way) spaces with similar characteristics at a medium resolution meeting the needs of decision-makers and providing up-to-date information.
Here, we explore a methodological approach capable of being replicated in other disease transmission processes through the application of satellite indices and georeferenced presence points of disease and potential hosts. This information was processed through statistical and artificial intelligence models to define spatial habitats' suitability for each species. The overlap of the territorial suitability between the presence of host and CS occurrence areas allowed the definition of levels of spatial risk of prion transmission, adding a new level of understanding about the potential role of domestic small ruminants' positive flocks influencing the emergent risk patterns of CS transmission to wild cervids.
2.1 Study area
Our study was conducted in the central-north Portugal regions of Guarda and Castelo Branco districts, where most cases of infection in domestic small ruminants were reported (Fig. 1). This region encompasses several protected natural reserves, including the Douro International Natural Park, the Tagus International Natural Park, the Special Protection Area of Côa Valley, the Serra da Estrela Natural Park, and the Serra da Malcata Nature Reserve. The study area is characterised by rough and heterogeneous landscapes, experiencing a Mediterranean climate with dry summers and cold winters, with continental influences (Monteiro et al., 2017).
The land cover and habitat structure are influenced by local conditions and human activities that contribute to a landscape mosaic with profound variations (Meneses et al., 2018; Tonini et al., 2018). In the northern part of the study area (Guarda), the topography promoted a landscape dominated by dense shrubs interspersed with fields of olives, almonds, and cereals. The landscape gradually evolves, going south to industrial forest plantations and scattered woodlands of oaks. In the valleys of the southern areas, farmlands and agro-silvo-pastoral systems dominate the landscape due to a lower terrain roughness.
In the last decades, the socioeconomic dynamics across the region promoted changes in land use and occupation, due to the increasing land abandonment and rural exodus, resulting in a human population scattered across small rural villages, where domestic flocks are held at different densities and management regimes.

Figure 1Geographical description of the study area in terms of the national and cross-border framework and digital elevation model.
2.2 Wild cervids and classical scrapie data
Data collected by the Portuguese CS surveillance programme (from 2008 to 2020) allowed the geo-localisation of the infected flocks. Of the 16 national flocks infected, 12 were in our study area, resulting in 11 different geographical presence points.
The geographical distribution of wild cervids was compiled using different sources for Portuguese free-ranging cervids (red deer and roe deer). The baseline information was gathered from the Atlas of Mammals in Portugal (Mathias et al., 2023), which combines information collected from 2000 to 2018 over a grid cell size of 10×10 km. Several field campaigns based on camera trapping carried out during 2021 to update and detail the distribution of target host species (Grilo et al., 2022) were also considered. Both sets of geographical data (centroid of the grid cells and the camera points) were combined using a GIS environment to merge the presence points relative to red deer and roe deer.
To extract spectral information about the habitat, the species' home range was considered through the creation of a circular buffer aimed at capturing the surrounding environment characteristics that enable the respective species' presence. For each cervid presence point collected, we considered a surrounding area of 1000 ha for red deer and 480 ha for roe deer. In situations where the same area has been multiple times encompassed in several home ranges, only one point was considered, resulting in the reduction of the number of presences considered and information bias. Additionally, for the 11 flocks infected with CS, an average distribution area of 380 ha was considered (Carvalho et al., 2008; Fontana et al., 2022; Jarnemo et al., 2023).
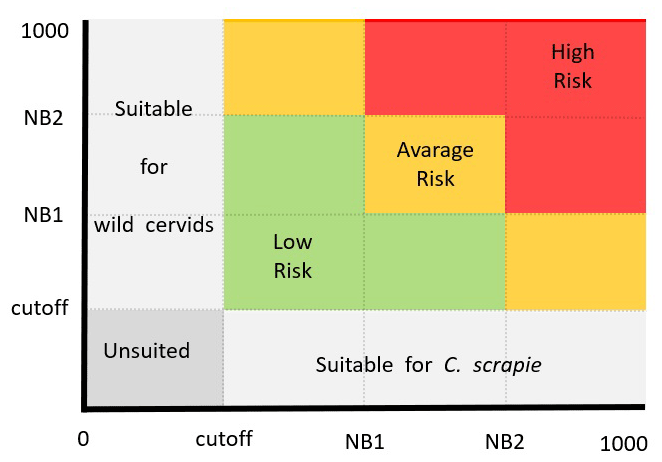
Figure 2Territorial adequacy matrix illustrating the presence of classical scrapie (x axis) and hosts (y axis) to define categories of risk transmission where grey cells denote areas with no suitability for either species or only one, while coloured cells represent areas where both species can coexist.
2.3 Remote sensing data
The Operational Land Imager (OLI) and Thermal Infrared Sensor (TIRS) are instruments on board the Landsat 8 satellite that record multispectral imagery and land surface temperature at a moderate spatial resolution (30 and 100 m respectively) of the earth's surface. This information is available on the Google Earth Engine (GEE), a cloud-based geospatial analysis platform that enables users to visualise and download raw and processed satellite data (Velastegui-Montoya et al., 2023).
Spectral indices were used due to their ability to spatialise the main structural and temporal components of the territory (Wilson et al., 2013; Khamdamov et al., 2021; Long et al., 2019) acting as a proxy to factors affecting host occurrence (Torres et al., 2011). The normalised difference vegetation index (NDVI) indicates types of vegetation cover since it is sensitive to chlorophyll content; the enhanced vegetation index (EVI) distinguishes differences in the canopy structure, architecture, and physiognomy; and the normalised difference moisture index (NDMI) provides insights into vegetation moisture variations and humidity levels through the landscape. Additionally, we used the land surface temperature (LST), which measures the emission of thermal radiance from the land surface serving as a thermal proxy, delineating microclimates that influence species composition, and the soil-adjusted vegetation index (SAVI), which takes into account the influence of soil brightness in areas where vegetative cover is low, unveiling information about vegetation cover types in arid spaces. Together, these indices allowed us to aggregate several layers of information of the landscape composition, aiding in identifying areas that are likely to support target species and, consequently, areas where the risk of CS spill-over may be heightened.
For this study, four Landsat 8 cloud-free images were collected throughout the year 2021, covering the beginning of spring (15 March), the beginning and end of summer (6 August and 21 September), and the middle of autumn (25 October).
For each image, a set of vegetative and biophysical indices was calculated through GEE (Ermida et al., 2020; Aghababaei et al., 2021; Velastegui-Montoya et al., 2023) following the described equations:
where blue represents band 2, red represents band 4, NIR represents band 5, and SWIR represents band 6 of the Landsat 8 satellite, and BT (brightness temperature) and ε (emissivity) are extrapolated from the same platform.
The calculated indices were downloaded and, in a GIS environment, underwent a resampling process to homogenise the resolution of all data at 300 m by applying a resample bilinear interpolation. This resampling process is necessary since SDMs need environmental variables with same spatial extent and number of pixels to predict species distributions across space. This technique also allows a better computational performance by reducing the total number of analysed pixels, which can be helpful for covering large areas. The resampled spectral data were delimited by a buffer zone of 10 km around the districts of Guarda and Castelo Branco, totalling an area of over 1.8×10⁶ ha.
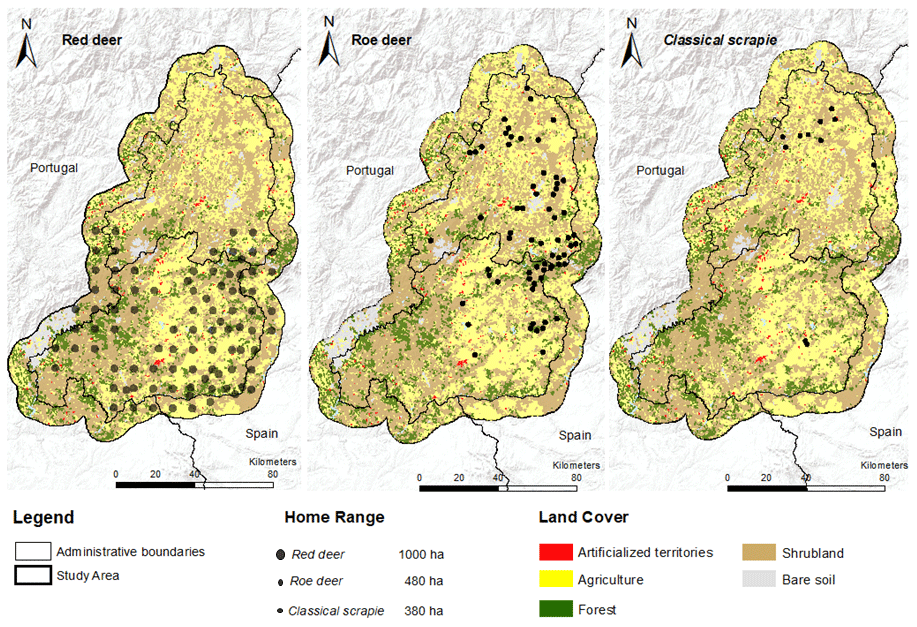
Figure 3Registered presence areas of wild cervids and classical scrapie with associated home range.
2.4 Multi-algorithm supervised classification and transmission risk
Despite the widespread use of distribution models, predictions based on the limited occurrence records for individual species should be considered preliminary and approached with particular caution, especially when derived from small sample sizes (Wisz et al., 2008; van Proosdij et al., 2016). Nevertheless, they are helpful, adding a spatial knowledge that promotes valuable insights into habitat suitability and potential distributions serving as a foundation for guide field actions and further refinement as more data become available.
The SDM biomod2 (version 3.4.6) (Thuiller et al., 2009), available as an R package, can be applied to perform pixel-based supervised classification through an ensemble approach using standard defaults (consult Supplement). The analyses were supported by several supervised classification algorithms: random forest (RF), classification tree analysis (CTA), artificial neural network (ANN), generalised linear model (GLM), and generalised additive models (GAM). For the input dataset, three sets of random pseudo-absences equal to the number of presences and 10 model repetitions were performed (Barbet-Massin et al., 2012). Due to the red deer home range encompassing a much larger area (in comparison to the other case study species), in this case, only 10 % of the pixels (randomly selected) were considered as presence points, reducing processing time and computational needs.
To evaluate the performance of the classifiers, holdout cross-validation was used by setting 80 % of the dataset for training and 20 % for evaluation purposes. Additionally, we ensured a prevalence of 0.5, which means that the presences and the pseudo-absences have the same weight in the model calibration process.
Table 1Results of the accuracy scores by classification algorithm for the distribution of wild cervids and the location of classical scrapie occurrence areas. Values show the average for each performance measure: TSS – true skill statistic; ROC – area under the receiver operating curve; KAPPA – Cohen's kappa.

To assess the models' performance, both partial and ensemble, we calculated the true skill statistic (TSS), Cohen's kappa (KAPPA), and the area under the receiver operating characteristic curve (ROC). The first two measures range from [−1, 1], while the latter varies between [0, 1]. Values closer to 1 indicate better-performing classifiers and a higher discrimination ability. To complement these measures, we also calculated sensitivity and specificity. Sensitivity is the proportion of observed presences accurately predicted, whereas specificity is the proportion of observed absences that are correctly predicted.
Although each statistical model offers a distinct perspective, TSS and Kappa are threshold-dependent measures that consider the number of correctly classified presences and absences relative to a threshold. In contrast, ROC is a threshold-independent measure that evaluates the final result as a continuous value being more susceptible to overestimating the classifier's performance.
Both TSS and Kappa measures can be employed to derive a binary outcome through the application of a numerical threshold. However, Kappa is also sensitive to class imbalance as it assesses both true positives and true negatives separately, rather than measuring an overall agreement between observed and predicted classifications. This renders TSS a more reliable metric in scenarios where high sensitivity (the proportion of observed presences correctly predicted) is more crucial than high specificity (the proportion of observed absences that are correct).
To convert the ensemble classifier model's binary outcome into probability or suitability values, a numerical threshold (cutoff) was applied (TSS > 0.8). Pixels below the TSS threshold value indicate no similarity to presence areas, pixels closely above the threshold indicate a very low spectral similarity to presence areas, and gradually output values near the maximum rescaled probabilistic value of 1000 indicate a very high spectral similarity.
All the ensemble forecasts (for the distributions of the two wild cervids and CS) were stratified in a GIS software using natural breaks (NB). The NB classification (Jenks) was employed to stratify the data within the ensemble into categories, aiming to maximise homogeneity within each group and heterogeneity between categories. Values below the threshold were not mapped and considered unsuited, and values above threshold were reclassified into three classes: low suitability [threshold:NB1], average suitability ]NB1:NB2], and high suitability ]NB2-1000].
The associated risk of spatial superposition between the predicted distribution of each wild cervid species with the CS presence was assessed through a risk matrix. From the combination of the suitability classes from each of the wild cervids and CS, a risk transmission ranking was obtained ranging from low risk (low–low; low–average; average–low), average risk (high–low; low–high; average–average), and high risk (average–high; high–average; high–high) (Fig. 2).
3.1 Georeferenced presence areas
The collection of data points allowed to spatialise the geographical distribution of host and CS home ranges are shown in Fig. 3. The affected flocks presented a semi-extensive production system with different flock sizes: two flocks (20–89 sheep), five flocks (90–335 sheep), and four flocks (more than 335 sheep). In general, the collected data indicate that red deer (n=90) was distributed across the south of the study area, while roe deer (n=68) and CS (n=11) had a higher dispersion on the northern territories. In the CS case, presence points that showed occasional overlapping ranges (less than 10 %) were retained due the small number of presences.
3.2 Models performance and habitat suitability mapping
The partial classification of the individual models' performance, as shown in Table 1, ranged from poor (< 0.5) to moderate (0.6<0.7) average scores. The best results, with high accuracy (> 0.9), were observed under the ROC for CS, particularly with RF and ANN models. The final consensus result, derived from the ensemble model, demonstrated very good performance values in terms of sensitivity and specificity, as shown in Table 2. This evaluation was higher than what was achieved by the individual models, as expected (Hao et al., 2020).
Regarding the importance of the selected indexes for the elaboration of the ensemble model, LST was the variable with higher importance for the prediction followed by the normalised difference water index (NDWI) for all the target species. In contrast, SAVI had the poorest contributions for the target cervids and NDVI in the case of CS. The individual variable with higher importance was the LST at the beginning of spring, closely followed by the LST at the end of summer for all study cases.
Table 2Accuracy scores of the final ensemble classifier combining biomod2 algorithms for the distribution of wild cervids and classical scrapie occurrence areas using TSS – true skill statistic.

The results were able to identify areas spectrally identical to those occupied by the host species and CS, suggesting the suitability of these territories for a possible presence (Fig. 4). Overall, the collected data revealed that the areas with spectral behaviour suitable for the occurrence of species encompassed 18 % of our study area for red deer, 14 % for roe deer, and 11 % for CS.

Figure 4Distribution of the habitat suitability for the presence of the host species and classical scrapie based on respective threshold calculated on biomod2 and natural breaks for each individual ensemble model.
3.3 Risk of classical scrapie spill-over from domestic small ruminants to wild cervids
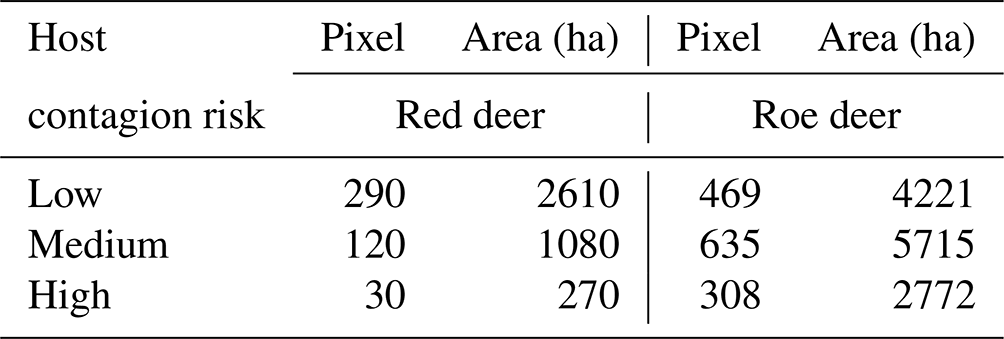
Among the considered hosts, roe deer presented the highest risk of CS transmission. This is not only because they cohabited common territories but also because these territories were considered highly suitable for CS presence. Red deer had a smaller transmission risk area concentrated in the south of the territory (Fig. 5). The results highlight, with special relevance in the north of the territory, areas with a higher probability of promoting CS dissemination or from where CS transmission emergence can occur. Overall, the suitable area for red deer spanned over 3960 ha, although more than half of this area was classified as low risk, 270 ha was identified as high risk. In the north, the roe deer transmission risk area covered 12 708 ha, of which 2772 ha was classified as high risk (Table 3). In total 6 % of the study area was classified with some level of spill-over risk for the roe deer and only 2 % for red deer.
Table 3Habitat adequacy to classical scrapie and wild cervids cohabiting across the study area expressed in number of pixels and hectares (ha) by host contagion risk.
While exploratory spatial analyses of CS infection risk are not novel (Li et al., 2023; Simons et al., 2019) they often fail to yield a spatially explicit final output aligned with the requirements of local policymakers and stakeholders. The approach developed in this article aims to bridge the gap between scientific knowledge and territorial needs by generating a consensus map of the risk of prion spill-over from domestic small ruminants to wild cervids hosts compatible with territorial strategies (at a 300 m resolution) in a straightforward manner.
Previous works primarily focused on CS environmental suitability at a global scale indicated that factors such as the minimum temperature of the coldest month (−10 to 10 °C) (Li et al., 2023) and the precipitation of the driest quarter (0 to 87.8 mm) (Maddison et al., 2012) were positively correlated with the probability of prion infection – conditions that prevail in our study area. Prions, akin to many other pathogens, retain infectivity in the soil for extended periods (Somerville et al., 2019) and easily disseminate within interconnected systems. Also the flock density (associated with road density) and soil drainage capacity (Georgsson et al., 2006) positively influence prion dissemination. These findings align with our results, as northern territories characterised by higher flock density and sloping landscapes with elevated sand content (Atterberg scale) favour drainage and potential prion propagation.
The fact that the production of small ruminants in the region is associated with long periods of grazing in open areas, without natural barriers to other animals, also contributes to a higher risk. In these grazing areas, sick animals can contaminate food and water resources through their excretions, secretions, and tissues resulting from births, which can be shared with cohabiting cervids, facilitating the transmission of this disease to this wild population. Furthermore, rural abandonment is associated with the decline in landscape heterogeneity with the replacement of the traditional agroforestry systems by homogeneous shrublands, which potentially leads to an expansion of the range of wild cervids and increased overlap with the remaining area of pastures for domestic small ruminants.
Advancements in integrating remote sensing technologies with ecological modelling have empowered researchers to utilise an array of remotely sensed variables with substantial potential for elucidating ecological patterns (Alcaraz-Segura et al., 2017). The use of satellite indexes at medium resolution proved to be an integrative tool for exploring causal relationships between habitat structure, landscape biophysical attributes, and comprehensive indicators of transmission risk.
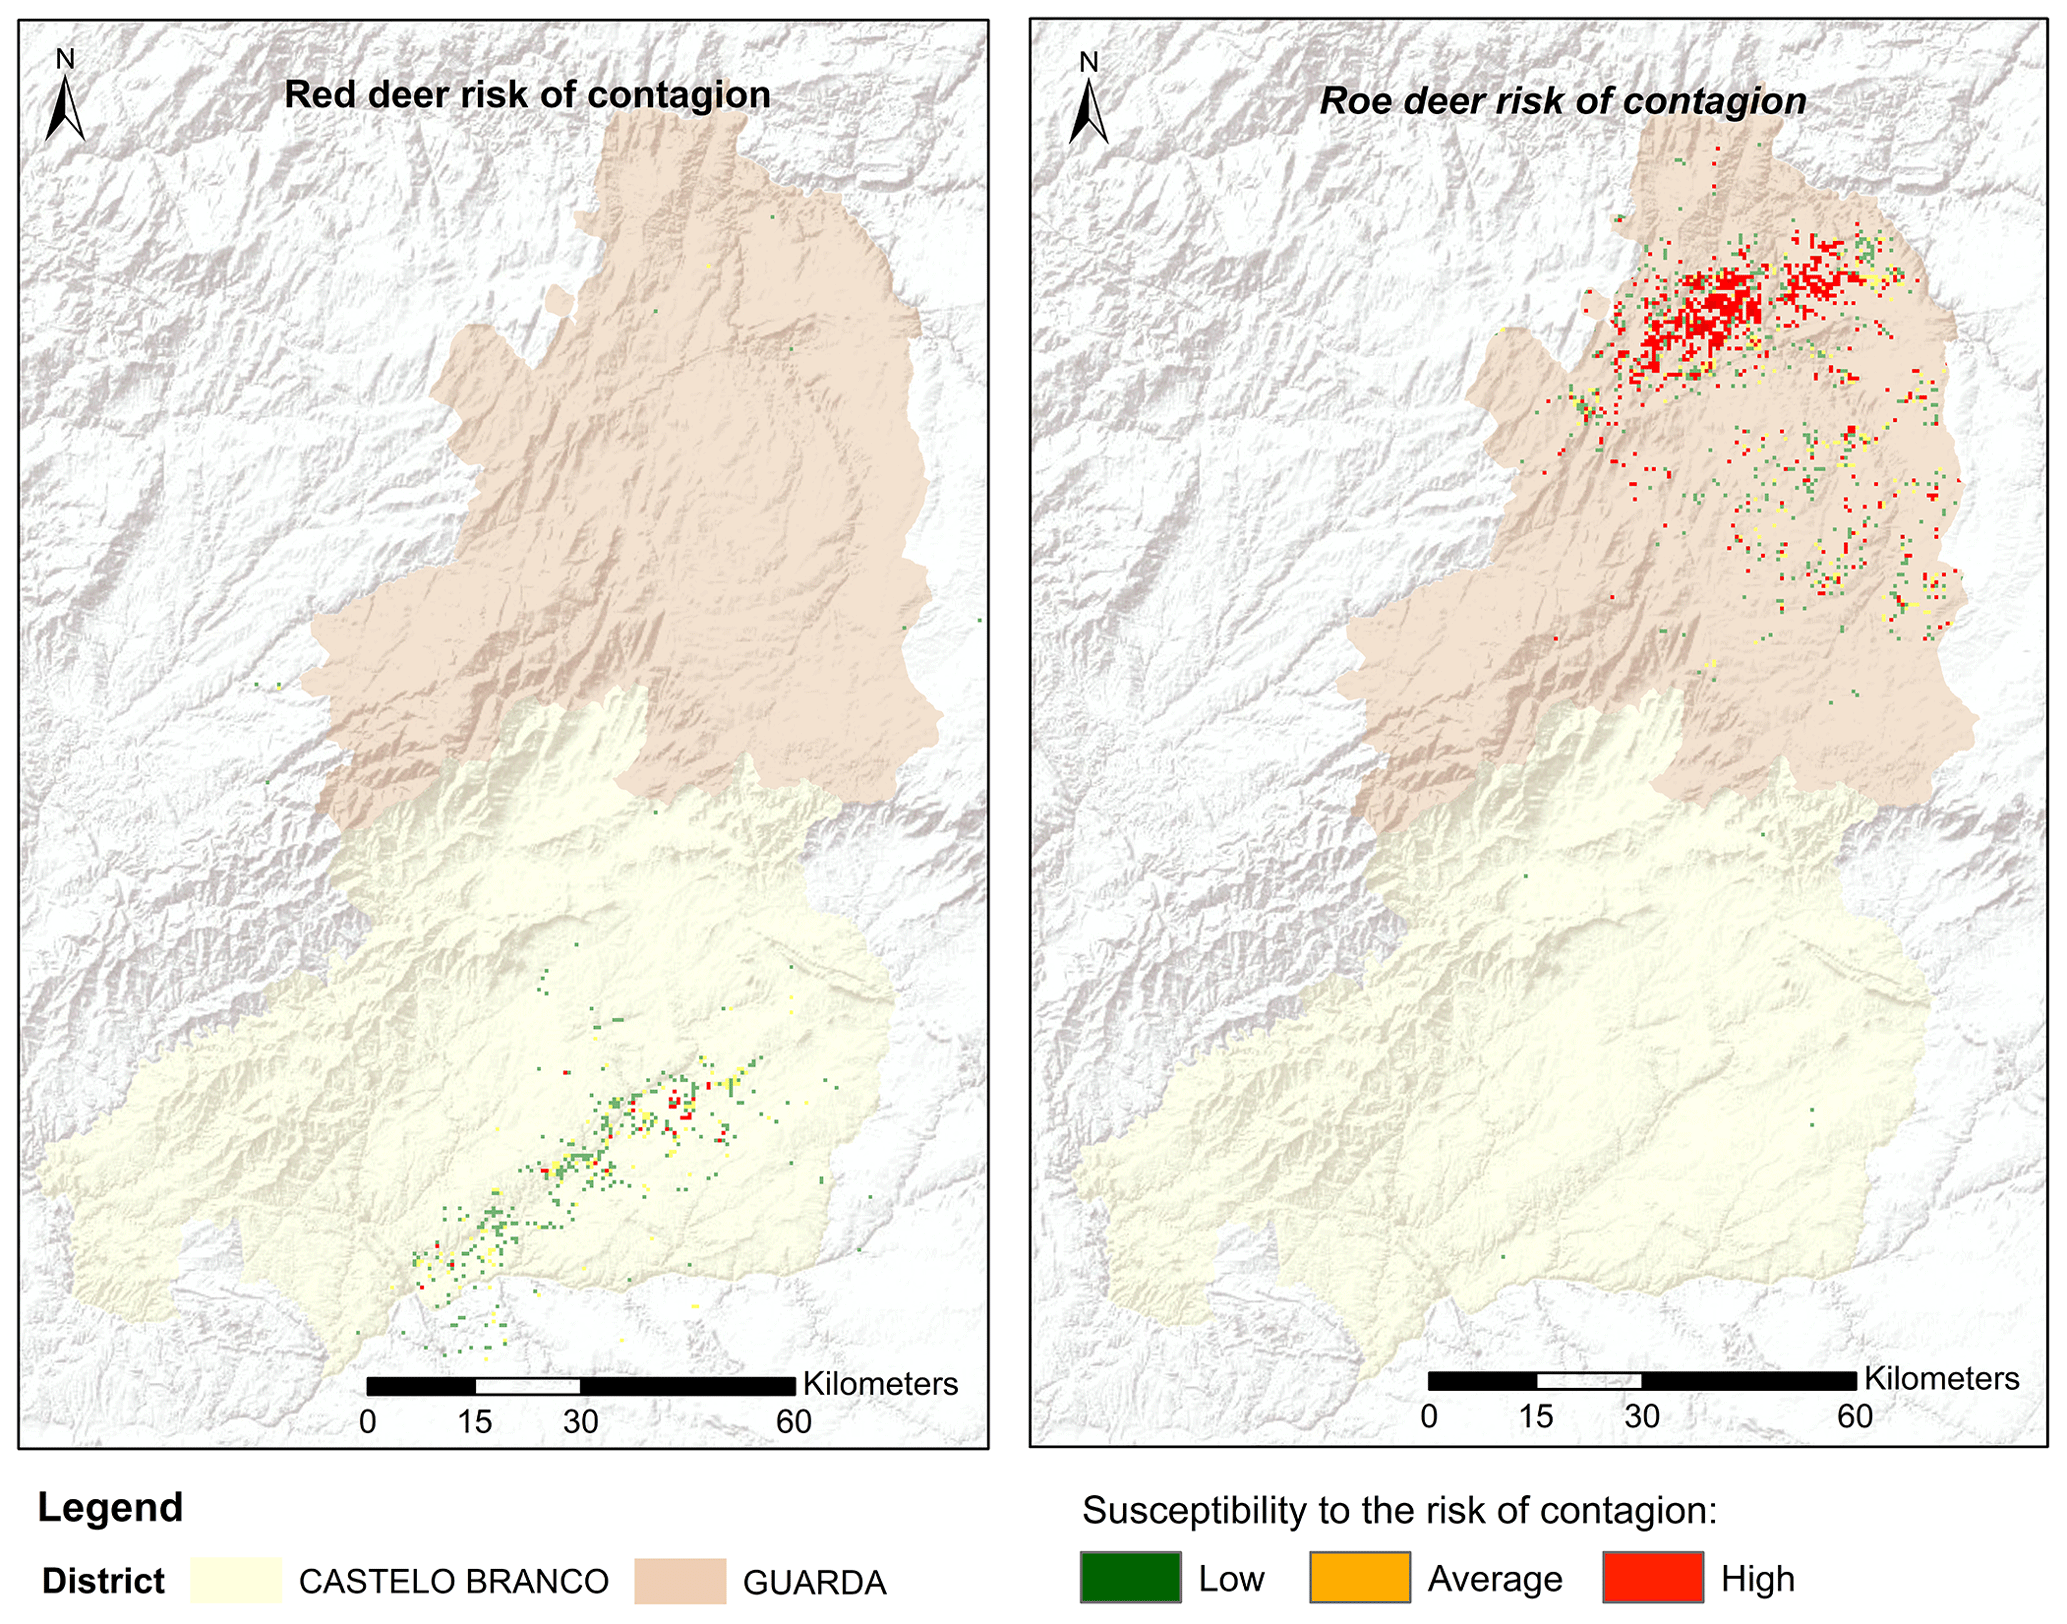
Figure 5Distribution and classification map of CS risk transmission (areas common to the presence of classical scrapie in domestic small ruminants and suitability for wild cervids) according to the territorial adequacy matrix.
The spatial delineation of areas potentially fostering the risk of transmission from domestic small ruminants to wild cervids reveals that roe deer pose the highest risk of facilitating disease transmission, particularly in the northern region. Even though no natural prion diseases have been identified in roe deer, serial protein misfolding cyclic amplification revealed that CS prions were amplified with roe deer brain (Morales et al., 2012), showing that this species putatively represents an important vector for CS prion transmission. Conversely, red deer exhibit a smaller transmission risk area, primarily concentrated in the south. The heightened risk of prion transmission in the northern Guarda District (attributed to greater territory suitability for CS occurrence) implies a significant land cover homogeneity in the region. The spectral resemblance of large swaths of the territory to CS home ranges (comprising mainly farmlands, shrubs, and low vegetation) suggests that this landscape homogeneity expands the potential range of prion occurrence and consequently elevates the risk of infecting wild cervids.
However, the assessment of prion transmission risk is only partially achieved by superimposing potential distribution patterns of these factors; this proposal serves as an invaluable starting point, facilitating the precise development of complementary multi-scale approaches (Rouan et al., 2010). These approaches can be enriched by combining holistic distribution patterns with geographical barriers to wild cervid distribution (e.g. rivers, motorways, topography) or by further exploring individual data on the number, sex, age, and reproductive numbers of small domestic ruminant flocks. Additional enhancements to this study can also be realised through more extensive and detailed time series analyses by incorporating data on the presence of CS (not only from domestic small ruminants but also from wild cervids) and by adopting a resolution matching the species' home range. The implementation of the suggested changes will likely produce more robust predictions, leading to deeper insights.
The future integration of empirical, mechanistic, and correlative modelling techniques within a unified framework (Bastos et al., 2018) holds the potential to enhance our understanding of the principal drivers behind host species distributions at regional scales, while also predicting responses of significance for ecological and disease risk management at local scales.
This study stands as the first investigation conducted in Portugal to evaluate spatial risk levels of spill-over from classical scrapie in domestic small ruminants to wild cervids, particularly in a region where this disease has been recorded within domestic flocks. Our approach is of particular importance since the ongoing rural abandonment observed in this region, with the consequent decline in the landscape heterogeneity historically promoted by the agricultural mosaic, seems to hold an increased risk of CS transmission in the future. In fact, the replacement of the traditional agroforestry systems by homogeneous shrublands, associated with the so-called “renaturalisation” and the effects of the fire regime, will potentially lead to an expansion of the range of wild cervids, increasing the potential overlap with the remaining area of pastures for domestic small ruminants.
Overall, our methodology offers a spatially explicit framework that represents a promising modelling approach, readily applicable to different wild communities and species impacted by zoonoses under the influence of emergent habitat patterns induced by structural and functional landscape changes.
The code used is available at https://www.rdocumentation.org/packages/biomod2/versions/3.4.6 (Georges, 2020).
No data sets were used in this article.
The supplement related to this article is available online at: https://doi.org/10.5194/we-24-47-2024-supplement.
MCP, JV, and JAC designed the study; NM conducted the experiment and wrote the original draft; LO, JA, JC, and RTT analysed the data; JP, RC, and MAP edited the paper. All authors contributed substantially to the final paper.
The contact author has declared that none of the authors has any competing interests.
Publisher's note: Copernicus Publications remains neutral with regard to jurisdictional claims made in the text, published maps, institutional affiliations, or any other geographical representation in this paper. While Copernicus Publications makes every effort to include appropriate place names, the final responsibility lies with the authors.
We thank the reviewers and the editor for all the constructive feedback and time dedicated.
This paper was edited by Roland Brandl and reviewed by Roland Brandl and one anonymous referee.
Project “Chronic wasting disease risk assessment in Portugal” (grant no. POCI-01-0145-FEDER-029947) was supported by the Portuguese Foundation for Science and Technology ((FCT)-FEDER-Balcão2020). This work was also supported by the research unit CECAV and AL 4AnimalS (project nos. UIDB/CVT/00772/2020 and LA/P/0059/2020), as well as the research unit CITAB (project no. UIDB/04033/2020 and PhD grant no. SFRH/BD/146961/2019), all funded by the Portuguese Foundation for Science and Technology (FCT).
Rita Tinoco Torres and João Carvalho were supported by a research contract (grant nos. 2021.00690.CEECIND and CEECIND/01428/2018, respectively) through FCT – Fundacao para a Ciência e a Tecnologia. CESAM (grant no. UIDP/50017/2020+UIDB/50017/2020) was supported by FCT/MCTES through national funds (FCT).
Nuno Mouta was supported by the Portuguese Science Foundation (FCT) through the 2022 PhD studentships (grant no. 2022.12295.BD).
Aghababaei, M., Ebrahimi, A., Naghipour, A. A., Asadi, E., and Verrelst, J.: Vegetation types mapping using multi-temporal landsat images in the google earth engine platform, Remote Sens., 13, 1–15, https://doi.org/10.3390/rs13224683, 2021.
Alcaraz-Segura, D., Lomba, A., Sousa-Silva, R., Nieto-Lugilde, D., Alves, P., Georges, D., Vicente, J. R., and Honrado, J. P.: Potential of satellite-derived ecosystem functional attributes to anticipate species range shifts, Int. J. Appl. Earth Obs. Geoinf., 57, 86–92, https://doi.org/10.1016/j.jag.2016.12.009, 2017.
Barbet-Massin, M., Jiguet, F., Albert, C. H., and Thuiller, W.: Selecting pseudo-absences for species distribution models: How, where and how many?, Methods Ecol. Evol., 3, 327–338, https://doi.org/10.1111/j.2041-210X.2011.00172.x, 2012.
Bastos, R., D'Amen, M., Marcos, B., Santos, M., Braz, L., Vicente, J., Honrado, J. P., Gonçalves, J., Monteiro, A., and Cabral, J. A.: Towards functional biodiversity predictions: a hierarchical modelling framework from primary productivity to biomass of upper trophic levels, Landsc. Ecol., 33, 2221–2237, https://doi.org/10.1007/s10980-018-0735-8, 2018.
Beringue, V. and Andreoletti, O.: Classical and atypical TSE in small ruminants, Anim. Front., 4, 33–43, https://doi.org/10.2527/af.2014-0005, 2014.
Carvalho, J., Torres, R. T., Acevedo, P., Santos, J. P. V., Barros, T., Serrano, E., and Fonseca, C.: Propagule pressure and land cover changes as main drivers of red and roe deer expansion in mainland Portugal, Divers. Distrib., 24, 551–564, https://doi.org/10.1111/ddi.12703, 2018.
Carvalho, P., Nogueira, A. J. A., Soares, A. M. V. M., and Fonseca, C.: Ranging behaviour of translocated roe deer in a Mediterranean habitat: seasonal and altitudinal influences on home range size and patterns of range use, Mammalia, 72, 89–94, https://doi.org/10.1515/mamm.2008.019, 2008.
Cassmann, E. D. and Greenlee, J. J.: Pathogenesis, detection, and control of scrapie in sheep, Am. J. Vet. Res., 81, 600–614, https://doi.org/10.2460/ajvr.81.7.600, 2020.
Cassmann, E. D., Frese, R. D., and Greenlee, J. J.: Second passage of chronic wasting disease of mule deer to sheep by intracranial inoculation compared to classical scrapie, J. Vet. Diagnostic Investig., 33, 711–720, https://doi.org/10.1177/10406387211017615, 2021.
Commission regulation: This document is meant purely as a documentation tool and the institutions do not assume any liability for its contents setting maximum levels for certain contaminants in foodstuffs (Text with EEA relevance), 1881, 1–5, 2006.
Dagleish, M. P., Martin, S., Steele, P., Finlayson, J., Sisó, S., Hamilton, S., Chianini, F., Reid, H. W., González, L., and Jeffrey, M.: Experimental transmission of bovine spongiform encephalopathy to European red deer (Cervus elaphus elaphus), BMC Vet. Res., 4, 1–8, https://doi.org/10.1186/1746-6148-4-17, 2008.
Domisch, S., Friedrichs, M., Hein, T., Borgwardt, F., Wetzig, A., Jähnig, S. C., and Langhans, S. D.: Spatially explicit species distribution models: A missed opportunity in conservation planning?, Divers. Distrib., 25, 758–769, https://doi.org/10.1111/ddi.12891, 2019.
Ermida, S. L., Soares, P., Mantas, V., Göttsche, F. M., and Trigo, I. F.: Google earth engine open-source code for land surface temperature estimation from the landsat series, Remote Sens., 12, 1–21, https://doi.org/10.3390/RS12091471, 2020.
Figueiredo, A. M., Dashti, A., Santín, M., Köster, P. C., Torres, R. T., Fonseca, C., Mysterud, A., Carvalho, J., Sarmento, P., Neves, N., Hipólito, D., Palmeira, J. D., Teixeira, D., Lima, C., Calero-Bernal, R., and Carmena, D.: Occurrence and molecular characterization of Enterocytozoon bieneusi in wild and domestic animal species in Portugal, Med. Mycol., 61, myad018, https://doi.org/10.1093/mmy/myad018, 2023.
Fontana, R., Calabrese, L., Lanzi, A., Armaroli, E., and Raganella Pelliccioni, E.: Spatial behavior of red deer (Cervus elaphus) in Northern Apennines: are we managing them correctly?, Anim. Biotelemetry, 10, 1–12, https://doi.org/10.1186/s40317-022-00300-3, 2022.
Forkuor, G., Benewinde Zoungrana, J. B., Dimobe, K., Ouattara, B., Vadrevu, K. P., and Tondoh, J. E.: LST, Remote Sens. Environ., 236, 111496, https://doi.org/10.1016/j.rse.2019.111496, 2020.
Georges, D.: Ensemble Platform for Species Distribution Modeling, The State of Data & AI Literacy 2024, Version 3.4.6, DataCamp [code], https://www.rdocumentation.org/packages/biomod2/versions/3.4.6 (last access: 26 February 2020), 2020.
Georgsson, G., Sigurdarson, S., and Brown, P.: Infectious agent of sheep scrapie may persist in the environment for at least 16 years, J. Gen. Virol., 87, 3737–3740, https://doi.org/10.1099/vir.0.82011-0, 2006.
Greenlee, J. J.: The Prion Diseases of Animals, in: Pathobiology of Human Disease, edited by: McManus, L. M. and Mitchell, R. N., Academic Press, San Diego, 1124–1133, https://doi.org/10.1016/B978-0-12-386456-7.03418-3, 2014.
Greenlee, J. J., Smith, J. D., and Kunkle, R. A.: White-tailed deer are susceptible to the agent of sheep scrapie by intracerebral inoculation, Vet. Res., 42, 107, https://doi.org/10.1186/1297-9716-42-107, 2011.
Grilo, C., Afonso, B. C., Afonso, F., et al.: MAMMALS IN PORTUGAL: A data set of terrestrial, volant, and marine mammal occurrences in Portugal, Ecology, 103, ecy.3654, https://doi.org/10.1002/ecy.3654, 2022.
Hamir, A. N., Miller, J. M., Cutlip, R. C., Kunkle, R. A., Jenny, A. L., Stack, M. J., Chaplin, M. J., and Richt, J. A.: Transmission of sheep scrapie to elk (Cervus elaphus nelsoni) by intracerebral inoculation: final outcome of the experiment., J. Vet. diagnostic Investig. Off. Publ. Am. Assoc. Vet. Lab. Diagnosticians, Inc, 16, 316–321, https://doi.org/10.1177/104063870401600410, 2004.
Hao, T., Elith, J., Guillera-Arroita, G., and Lahoz-Monfort, J. J.: A review of evidence about use and performance of species distribution modelling ensembles like BIOMOD, Divers Distrib., 25, 839–852, https://doi.org/10.1111/ddi.12892, 1 May 2019.
Hao, T., Elith, J., Lahoz-Monfort, J. J., and Guillera-Arroita, G.: Testing whether ensemble modelling is advantageous for maximising predictive performance of species distribution models, Ecography (Cop.)., 43, 549–558, https://doi.org/10.1111/ecog.04890, 2020.
He, Y., Chen, G., Potter, C., and Meentemeyer, R. K.: Integrating multi-sensor remote sensing and species distribution modeling to map the spread of emerging forest disease and tree mortality, Remote Sens. Environ., 231, 111238, https://doi.org/10.1016/j.rse.2019.111238, 2019.
Janani, N., Kannan, B., Nagarajan, K., Thiyagarajan, G., and Duraisamy, M. R.: Soil moisture mapping for different land-use patterns of lower Bhavani river basin using vegetative index and land surface temperature, Environ. Dev. Sustain., 26, 4533–4549 (2024), https://doi.org/10.1007/s10668-022-02896-1, 2023.
Jarnemo, A., Nilsson, L., and Wikenros, C.: Home range sizes of red deer in relation to habitat composition: a review and implications for management in Sweden, Eur. J. Wildl. Res., 69, 1–16, https://doi.org/10.1007/s10344-023-01719-6, 2023.
Keough, K., Greenlee, J., and Caughey, B.: PRION 2019 emerging concepts, Prion, 13, 1–141, https://doi.org/10.1080/19336896.2019.1615197, 2019.
Khamdamov, R., Rakhmanov, K., and Fattaeva, D.: Algorithm for Calculating Vegetation Indices NDVI for Time Series of Landsat 8 Multisspectral Satellite Images on Google Earth Engine Platform, Int. Conf. Inf. Sci. Commun. Technol. Appl. Trends Oppor. ICISCT 2021, 1–3, https://doi.org/10.1109/ICISCT52966.2021.9670365, 2021.
Knott, J. A., Liknes, G. C., Giebink, C. L., Oh, S., Domke, G. M., McRoberts, R. E., Quirino, V. F., and Walters, B. F.: Effects of outliers on remote sensing-assisted forest biomass estimation: A case study from the United States national forest inventory, Methods Ecol. Evol., 14, 1587–1602, https://doi.org/10.1111/2041-210X.14084, 2023.
Kopsco, H. L., Smith, R. L., and Halsey, S. J.: A Scoping Review of Species Distribution Modeling Methods for Tick Vectors, Front. Ecol. Evol., 10, 893016, https://doi.org/10.3389/fevo.2022.893016, 2022.
Lastovicka, J., Svec, P., Paluba, D., Kobliuk, N., Svoboda, J., Hladky, R., and Stych, P.: Sentinel-2 data in an evaluation of the impact of the disturbances on forest vegetation, Remote Sens., 12, 1914, https://doi.org/10.3390/rs12121914, 2020.
Li, H., Pan, H., Xu, L., Li, S., Li, S., Chen, S., Man, C., Du, L., Chen, Q., Xiao, J., Wang, H., Wang, F., and Gao, H.: Predicting Risk Areas of Classical Scrapie in China Based on Environmental Suitability, Transbound. Emerg. Dis., 2023, 1–10, https://doi.org/10.1155/2023/2826256, 2023.
Long, T., Zhang, Z., He, G., Jiao, W., Tang, C., Wu, B., Zhang, X., Wang, G., and Yin, R.: 30 m resolution global annual burned area mapping based on landsat images and Google Earth Engine, Remote Sens., 11, 1–30, https://doi.org/10.3390/rs11050489, 2019.
Maddison, B. C., Owen, J. P., Taema, M. M., Shaw, G., and Gough, K. C.: Temperature influences the interaction of ruminant PrPTSEwith soil, Prion, 6, 302–308, https://doi.org/10.4161/pri.20025, 2012.
Marín-Moreno, A., Aguilar-Calvo, P., Espinosa, J. C., Zamora-Ceballos, M., Pitarch, J. L., González, L., Fernández-Borges, N., Orge, L., Andréoletti, O., Nonno, R., and Torres, J. M.: Classical scrapie in small ruminants is caused by at least four different prion strains, Vet. Res., 52, 1–15, https://doi.org/10.1186/s13567-021-00929-7, 2021.
Mathias, M. da L., Fonseca, C., Rodrigues, L., Grilo, C., Lopes-Fernandes, M., Palmeirim, J. M., Santos-Reis, M., Alves, P. C., Cabral, J. A., Ferreira, M., Mira, A., Eira, C., Negrões, N., Paupério, J., Pita, R., Rainho, A., Rosalino, L. M., Tapisso, J. T., and Vingada, J.: Livro Vermelho dos Mamíferos de Portugal Continental, Icnf, FCiências., 90–139, 2023.
Meneses, B. M., Reis, E., Vale, M. J., and Reis, R.: Modelling land use and land cover changes in Portugal: A multi-scale and multi-temporal approach, Finisterra, 53, 3–26, https://doi.org/10.18055/finis12258, 2018.
Monteiro, A. T., Gonçalves, J., Fernandes, R. F., Alves, S., Marcos, B., Lucas, R., Teodoro, A. C., and Honrado, J. P.: Estimating invasion success by non-native trees in a national park combining worldview-2 very high resolution satellite data and species distribution models, Diversity, 9, 6, https://doi.org/10.3390/d9010006, 2017.
Morales, R., Duran-Aniotz, C., Diaz-Espinoza, R., Camacho, M. V, and Soto, C.: Protein misfolding cyclic amplification of infectious prions, Nat. Protoc., 7, 1397–1409, https://doi.org/10.1038/nprot.2012.067, 2012.
Mouta, N., Silva, R., Pais, S., Alonso, J. M., Gonçalves, J. F., Honrado, J., and Vicente, J. R.: `The Best of Two Worlds' – Combining Classifier Fusion and Ecological Models to Map and Explain Landscape Invasion by an Alien Shrub, Remote Sens., 13, 1–25, https://doi.org/10.3390/rs13163287, 2021.
Naimi, B. and Araújo, M. B.: Sdm: A reproducible and extensible R platform for species distribution modelling, Ecography (Cop.)., 39, 368–375, https://doi.org/10.1111/ecog.01881, 2016.
Orge, L., Oliveira, A., Machado, C., Lima, C., Ochoa, C., Silva, J., Carvalho, R., Tavares, P., Almeida, P., Ramos, M., Pinto, M. J., and Simas, J. P.: Putative emergence of classical scrapie in a background of enzootic atypical scrapie, J. Gen. Virol., 91, 1646–1650, https://doi.org/10.1099/vir.0.018879-0, 2010.
Orge, L., Machado, C. G., Ramalho, L., Carvalho, R., Silva, J., Almeida, P., Tavares, P., Ochoa, C., Lima, C., Pinto, M. J. M., and Simas, J. P.: Identification of H-type BSE in Portugal, Prion, 9, 22–28, https://doi.org/10.1080/19336896.2014.997615, 2015.
Ricci, A., Allende, A., Bolton, D., Chemaly, M., Davies, R., Fernández Escámez, P. S., Gironés, R., Herman, L., Koutsoumanis, K., Lindqvist, R., Nørrung, B., Robertson, L., Ru, G., Sanaa, M., Skandamis, P., Snary, E., Speybroeck, N., Kuile, B. Ter, Threlfall, J., Wahlström, H., Benestad, S., Gavier-Widen, D., Miller, M. W., Telling, G. C., Tryland, M., Latronico, F., Ortiz-Pelaez, A., Stella, P., and Simmons, M.: Scientific opinion on chronic wasting disease (II), EFSA J., 16, 5132, https://doi.org/10.2903/j.efsa.2018.5132, 2018.
Rouan, M., Kerbiriou, C., Levrel, H., and Etienne, M.: A co-modelling process of social and natural dynamics on the isle of Ouessant: Sheep, turf and bikes, Environ. Model. Softw., 25, 1399–1412, https://doi.org/10.1016/j.envsoft.2009.10.010, 2010.
Simons, R. R. L., Croft, S., Rees, E., Tearne, O., Arnold, M. E., and Johnson, N.: Using species distribution models to predict potential hot-spots for Rift Valley Fever establishment in the United Kingdom, PLoS One, 14, e0225250, https://doi.org/10.1371/journal.pone.0225250, 2019.
Somerville, R. A., Fernie, K., Smith, A., Bishop, K., Maddison, B. C., Gough, K. C., and Hunter, N.: BSE infectivity survives burial for five years with only limited spread, Arch. Virol., 164, 1135–1145, https://doi.org/10.1007/s00705-019-04154-8, 2019.
Thuiller, W., Lafourcade, B., Engler, R., and Araújo, M. B.: BIOMOD – A platform for ensemble forecasting of species distributions, Ecography (Cop.)., 32, 369–373, https://doi.org/10.1111/j.1600-0587.2008.05742.x, 2009.
Tonini, M., Parente, J., and Pereira, M. G.: Global assessment of rural–urban interface in Portugal related to land cover changes, Nat. Hazards Earth Syst. Sci., 18, 1647–1664, https://doi.org/10.5194/nhess-18-1647-2018, 2018.
Torres, R. T., Santos, J., Linnell, J. D. C., Virgós, E., and Fonseca, C.: Factors affecting roe deer occurrence in a Mediterranean landscape, Northeastern Portugal, Mamm. Biol., 76, 491–497, https://doi.org/10.1016/j.mambio.2010.10.013, 2011.
Union, T. E.: The European Union summary report on surveillance for the presence of transmissible spongiform encephalopathies (TSE) in 2021, EFSA J., 20, 7655, https://doi.org/10.2903/j.efsa.2022.7655, 2022.
Valente, A. M., Acevedo, P., Figueiredo, A. M., Martins, R., Fonseca, C., Torres, R. T., and Delibes-Mateos, M.: Dear deer? Maybe for now. People's perception on red deer (Cervus elaphus) populations in Portugal, Sci. Total Environ., 748, 141400, https://doi.org/10.1016/j.scitotenv.2020.141400, 2020.
van Proosdij, A. S. J., Sosef, M. S. M., Wieringa, J. J., and Raes, N.: Minimum required number of specimen records to develop accurate species distribution models, Ecography (Cop.)., 39, 542–552, https://doi.org/10.1111/ecog.01509, 2016.
Velastegui-Montoya, A., Montalván-Burbano, N., Carrión-Mero, P., Rivera-Torres, H., Sadeck, L., and Adami, M.: Google Earth Engine: A Global Analysis and Future Trends, Remote Sens., 15, 3675, https://doi.org/10.3390/rs15143675, 2023.
Wilson, J. W., Sexton, J. O., Todd Jobe, R., and Haddad, N. M.: The relative contribution of terrain, land cover, and vegetation structure indices to species distribution models, Biol. Conserv., 164, 170–176, https://doi.org/10.1016/j.biocon.2013.04.021, 2013.
Wisz, M. S., Hijmans, R. J., Li, J., Peterson, A. T., Graham, C. H., Guisan, A., Elith, J., Dudík, M., Ferrier, S., Huettmann, F., Leathwick, J. R., Lehmann, A., Lohmann, L., Loiselle, B. A., Manion, G., Moritz, C., Nakamura, M., Nakazawa, Y., Overton, J. M. C., Phillips, S. J., Richardson, K. S., Scachetti-Pereira, R., Schapire, R. E., Soberón, J., Williams, S. E., and Zimmermann, N. E.: Effects of sample size on the performance of species distribution models, Divers. Distrib., 14, 763–773, https://doi.org/10.1111/j.1472-4642.2008.00482.x, 2008.