the Creative Commons Attribution 4.0 License.
the Creative Commons Attribution 4.0 License.
 | 24 Nov 2022
The BIODESERT survey: assessing the impacts of grazing on the structure and functioning of global drylands
Fernando T. Maestre
David J. Eldridge
Nicolas Gross
Yoann Le Bagousse-Pinguet
Hugo Saiz
Beatriz Gozalo
Victoria Ochoa
Juan J. Gaitán
Grazing by domestic livestock is both the main land use across drylands worldwide and a major desertification and global change driver. The ecological consequences of this key human activity have been studied for decades, and there is a wealth of information on its impacts on biodiversity and ecosystem processes. However, most field assessments of the ecological impacts of grazing on drylands conducted to date have been carried out at local or regional scales and have focused on single ecosystem attributes (e.g., plant productivity) or particular taxa (mainly aboveground, e.g., plants). Here we introduce the BIODESERT survey, the first systematic field survey devoted to evaluating the joint impacts of grazing by domestic livestock and climate on the structure and functioning of dryland ecosystems worldwide. This collaborative global survey was carried out between 2016 and 2019 and has involved the collection of field data and plant, biocrust, and soil samples from a total of 326 45 m × 45 m plots from 98 sites located in 25 countries from 6 continents. Here we describe the major characteristics and the field protocols used in this survey. We also introduce the organizational aspects followed, as these can be helpful to everyone wishing to establish a global collaborative network of researchers. The BIODESERT survey provides baseline data to assess the current status of dryland rangelands worldwide and the impacts of grazing on these key ecosystems, and it constitutes a good example of the power of collaborative research networks to study the ecology of our planet using much-needed field data.
- Article
(16311 KB) - Full-text XML
- BibTeX
- EndNote


Drylands, regions with an aridity index (precipitation/potential evapotranspiration) below 0.65 (Cherlet et al., 2018), constitute the world's largest rangeland area (Asner et al., 2004). Grazing by domestic livestock, and extensive grazing in particular, is an essential human activity in drylands (Manzano et al., 2021). It supports the livelihoods of over a billion people (Neely et al., 2009), is associated with multiple cultural and religious practices (Jenet et al., 2016; Mehrabi et al., 2020), and has major environmental effects in these areas (Steinfeld et al., 2006). Grazing is also a major driver of land degradation and desertification in drylands (Xu et al., 2011; Cherlet et al., 2018), particularly when it follows the introduction of artificial watering points in areas where water has been historically unavailable (D'Odorico et al., 2013). Livestock grazing has also major impacts on dryland biodiversity (Hanke et al., 2014; Chillo et al., 2015; Eldridge et al., 2016) and is linked to major land use changes in these areas, such as shrub encroachment (Van Auken, 2000; Eldridge et al., 2011).
Assessing the impacts of grazing pressure and changes in atmospheric aridity, rainfall and precipitation, which are major imprints of climate change across terrestrial ecosystems worldwide (Feng and Fu, 2013; Huang et al., 2016; Lian et al., 2021), is necessary to advance towards more sustainable grazing practices (Briske et al., 2020) and to accurately forecast how drylands will respond to ongoing global environmental change (Maestre et al., 2016). However, we yet lack a clear consensus because most of the field assessments of grazing impacts on ecosystems conducted to date have been carried out at local or regional scales (e.g., Milchunas and Lauenroth, 1993; Hanke et al., 2014; Eldridge et al., 2016; Gaitán et al., 2018), have focused on particular structural or functional ecosystem attributes (e.g., aboveground primary productivity or soil carbon content), or have targeted particular taxa, mainly those aboveground (e.g., vascular plants, birds, mammals or insects; García-Vega and Newbold, 2020). This limits our capacity to assess how the ecological impacts of livestock vary across grazing systems, environmental conditions and grazing pressure gradients.
The use of collaborative networks, in which multiple research teams share efforts and resources to address a common problem/research goal using standardized experiments or field observations, can overcome major limitations of local/regional studies and meta-analyses (Fraser et al., 2013; Borer et al., 2014), and it has proven to be particularly useful to explore major ecological questions in recent years. These include the relationships between productivity and plant species richness (Fraser et al., 2015) and between above- and belowground biodiversity and ecosystem multifunctionality (Maestre et al., 2012; Delgado-Baquerizo et al., 2016), the impacts of aridity on ecosystem structure and functioning (Delgado-Baquerizo et al., 2013; Maestre et al., 2015), and the environmental drivers of litter decomposition (Djukic et al., 2018, 2021), to name a few relevant and successful examples. Global collaborative networks thus offer a way forward to explore complex questions across a wide range of environmental and geographical conditions, which often exceed the logistic and economic capacity of individual research groups or consortia. They also offer unparalleled opportunities to include a diverse representation of scientists from multiple geographical, cultural and socioeconomic backgrounds, to contribute to scientific capacity building where it is needed the most, and to foster networking and training opportunities, particularly for early career researchers from underrepresented regions and backgrounds (Maestre and Eisenhauer, 2019).
Here we introduce the main characteristics and field protocols of the BIODESERT survey, a collaborative study that has established a network of monitoring field plots to study the impacts of grazing pressure on the structure (multiple attributes of above- and belowground communities) and functioning (multiple variables acting as proxies of essential ecosystem functions and services) of dryland ecosystems worldwide. The BIODESERT survey provides a truly global set of 326 field plots surveyed in situ with the same standardized protocols across 98 sites from 25 countries and 6 continents. This survey aimed at encompassing most of aridity/grazing pressure conditions that can be found in dryland rangelands worldwide. BIODESERT was established to address (i) the impacts of grazing pressure on the structure and functioning of global dryland rangelands, (ii) how these impacts are modulated by climate and other environmental conditions, and (iii) the geographical variation in the sensitivity of drylands to increases in grazing pressure. By studying multiple grazing levels at each site, estimating grazing pressure at each surveyed field plot, and conducting a global study encompassing most environmental conditions and a wide variety of the grazing systems found in drylands, the BIODESERT survey is well suited to achieve these main objectives. In addition to the description of the field protocols used, in this article we also introduce the main organizational aspects of the BIODESERT survey. The latter can be also helpful to everyone wishing to establish a global collaborative network of researchers.
BIODESERT is a flexible and scalable survey of multiple vegetation attributes, soil properties, ecosystem processes and livestock grazing-related variables that has been conducted in drylands worldwide between 2016 and 2019. This survey is coordinated by the Dryland Ecology and Global Change Laboratory at the University of Alicante (Spain, https://maestrelab.com/en/, last access: 17 December 2021) and is mainly supported by the BIODESERT project, funded by the Consolidator Grant Program of the European Research Council for the period 2016–2022 (http://biodesert.maestrelab.com/, last access: 17 December 2021) and by funds provided by each research group participating in this survey.
The power and relevance of the data to be obtained by a survey like BIODESERT rely on being able to conduct it at a large number of sites globally, which also encourages the widest participation. The survey is divided into a series of measurements that must be conducted by all the members of the network at all sites (denoted as mandatory in Fig. 1). A series of optional measurements are also outlined for those groups that have the time, resources and interest to carry them out.
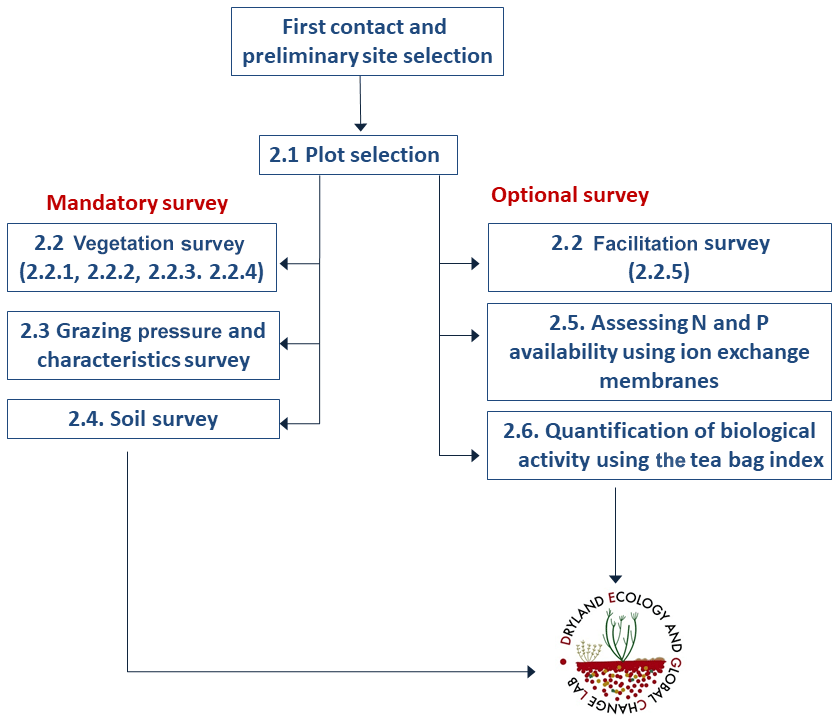
Figure 1Flowchart of the actions and measurements involved in the BIODESERT survey. The numbers indicate the sections of the article where each part of the survey is described. N = nitrogen and P = phosphorus.
The flowchart of the BIODESERT survey is shown in Fig. 1. Fieldwork has been carried out with basic field equipment (tape, quadrats of different size, a compass, a clinometer, soil corer, hammer, plastic bags and a ruler), and no sophisticated field equipment or sensors were required to successfully execute it. We have done so deliberately, as this field survey needed to be conducted easily by researchers from across the world, who in many cases work in areas that are remote and difficult to access and where there are no nearby research facilities. It was also our intention to minimize the cost of doing the field survey as much as possible to ensure the widest participation possible, particularly for colleagues from the Global South and other dryland areas underrepresented in previous studies. However, these researchers needed to have local botanical knowledge and a good understanding of livestock characteristics at their sites as the identification of the plant species and of the grazing pressure present at each field site is an essential part of the survey.
The BIODESERT global survey was conducted at 98 sites located in 25 countries from 6 continents (Algeria, Argentina, Australia, Botswana, Brazil, Canada, Chile, China, Ecuador, Hungary, Iran, Israel, Kazakhstan, Kenya, Mexico, Mongolia, Namibia, Niger, Palestine, Peru, Portugal, South Africa, Spain, Tunisia and the United States of America; Fig. 2). This survey, and the processing of all the data and samples it has provided, has involved over 300 researchers, field assistants, students, laboratory technicians and site/laboratory managers working in over 100 institutions from 30 countries.
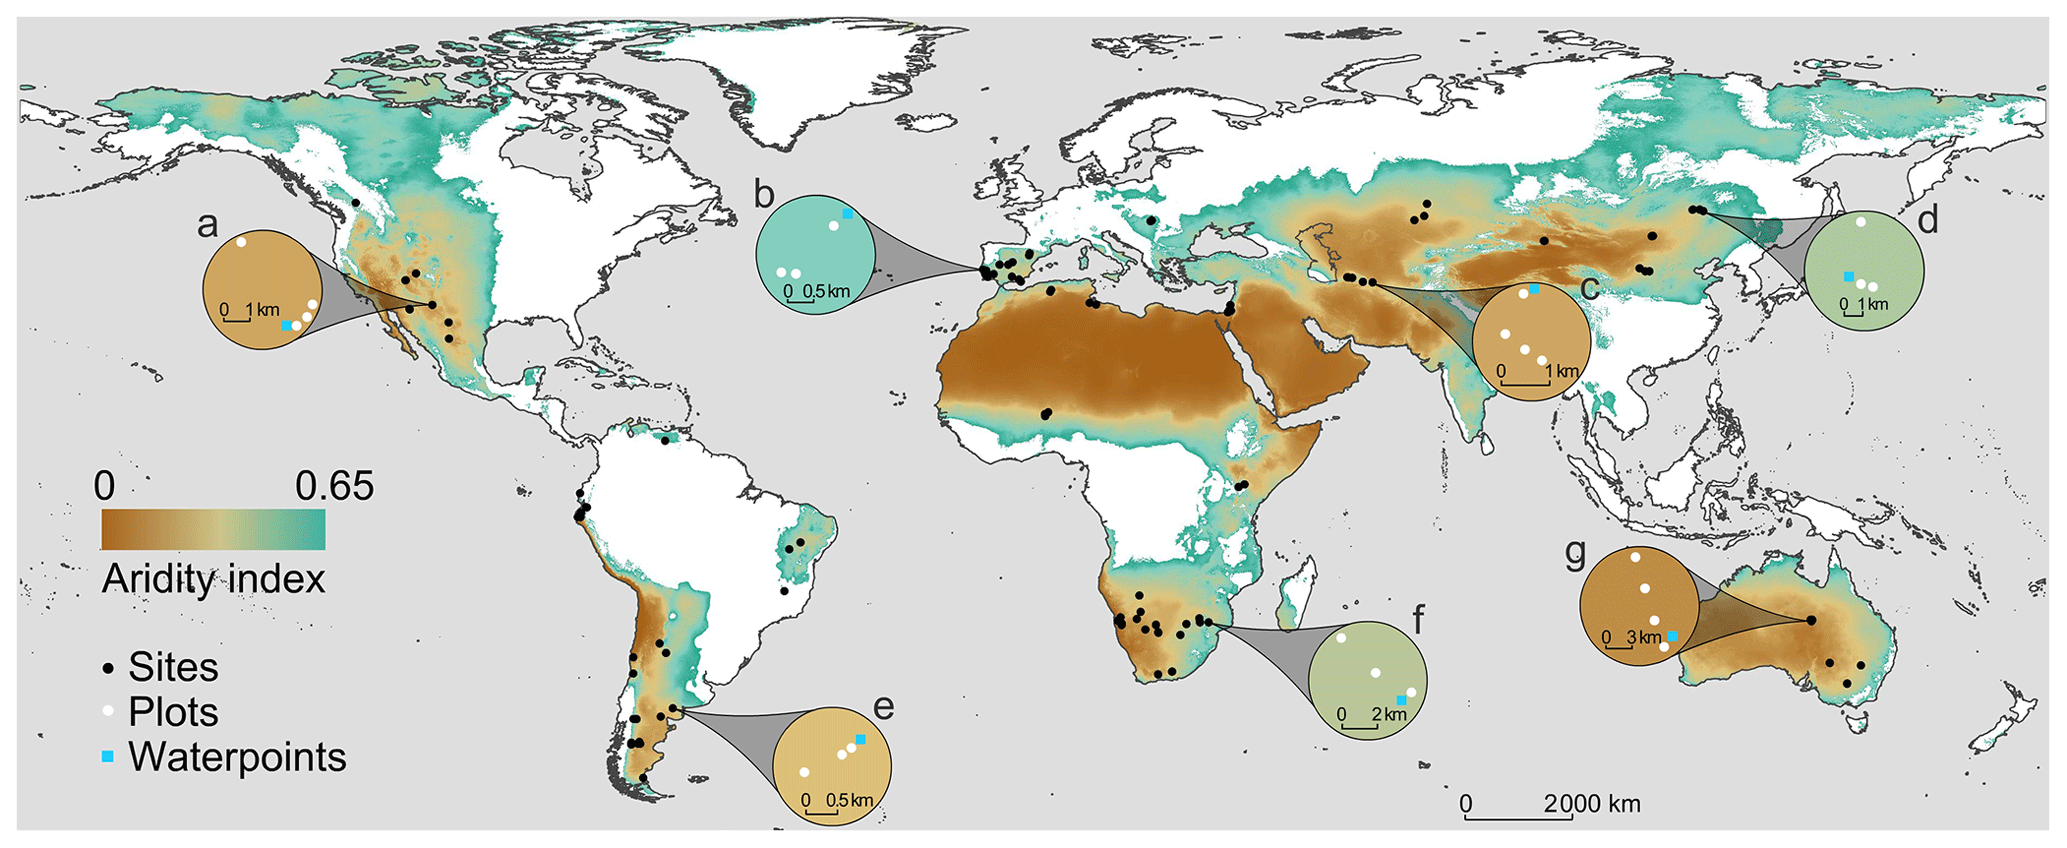
Figure 2Location of the 98 sites surveyed with examples (insets a–g) of local grazing gradients. Each white dot represents a 45 m × 45 m plot surveyed in situ; a total of 326 plots were surveyed across the 98 study sites. The background of the map indicates the extent of global drylands (areas with an aridity index (precipitation/potential evapotranspiration) lower than 0.65).
2.1 Site and plot selection
We surveyed multiple (from two to four, see below) 45 m × 45 m plots located across a local grazing pressure gradient (ungrazed and low, medium and high grazing pressure) at each of the 98 sites forming part of the BIODESERT network. To determine this gradient, plots were mostly located at varying distances from artificial watering points (Fig. 3), which provide permanent sources of water for livestock in drylands (Fensham and Fairfax, 2008). The distance from water points has been shown to be a good proxy of grazing pressure (i.e., the closer to a watering point, the higher the grazing pressure) in drylands worldwide (Lange, 1969; Pringle and Landsberg, 2004; Fensham and Fairfax, 2008; Fensham et al., 2010; Frank et al., 2012; Adler and Hall, 2005; Tuna et al., 2011). The range of distances from water points used was dependent on the characteristics of each site (i.e., was not fixed). This approach was combined with an expert assessment using the best available knowledge of the site, historic records and prior information. Once selected, and before doing any fieldwork, plots were first identified using Google Earth (https://www.google.com/intl/es/earth/, last access: 17 December 2021) and pre-inspected to ensure that they were adequate for sampling (i.e., not bisected by a road or track, away from human disturbances such as mining, villages or field crops). The plots were established in areas representative of the vegetation that can be found at each site and with soils derived from the same parent material and sharing the same soil type (whenever possible). This was done to avoid undesirable confounding factors, such as having different soil types between plots under different grazing intensities. In sites that were not flat, plots were established in zones with similar orientation (SE–SW in the Northern Hemisphere and NE–NW in the Southern Hemisphere).
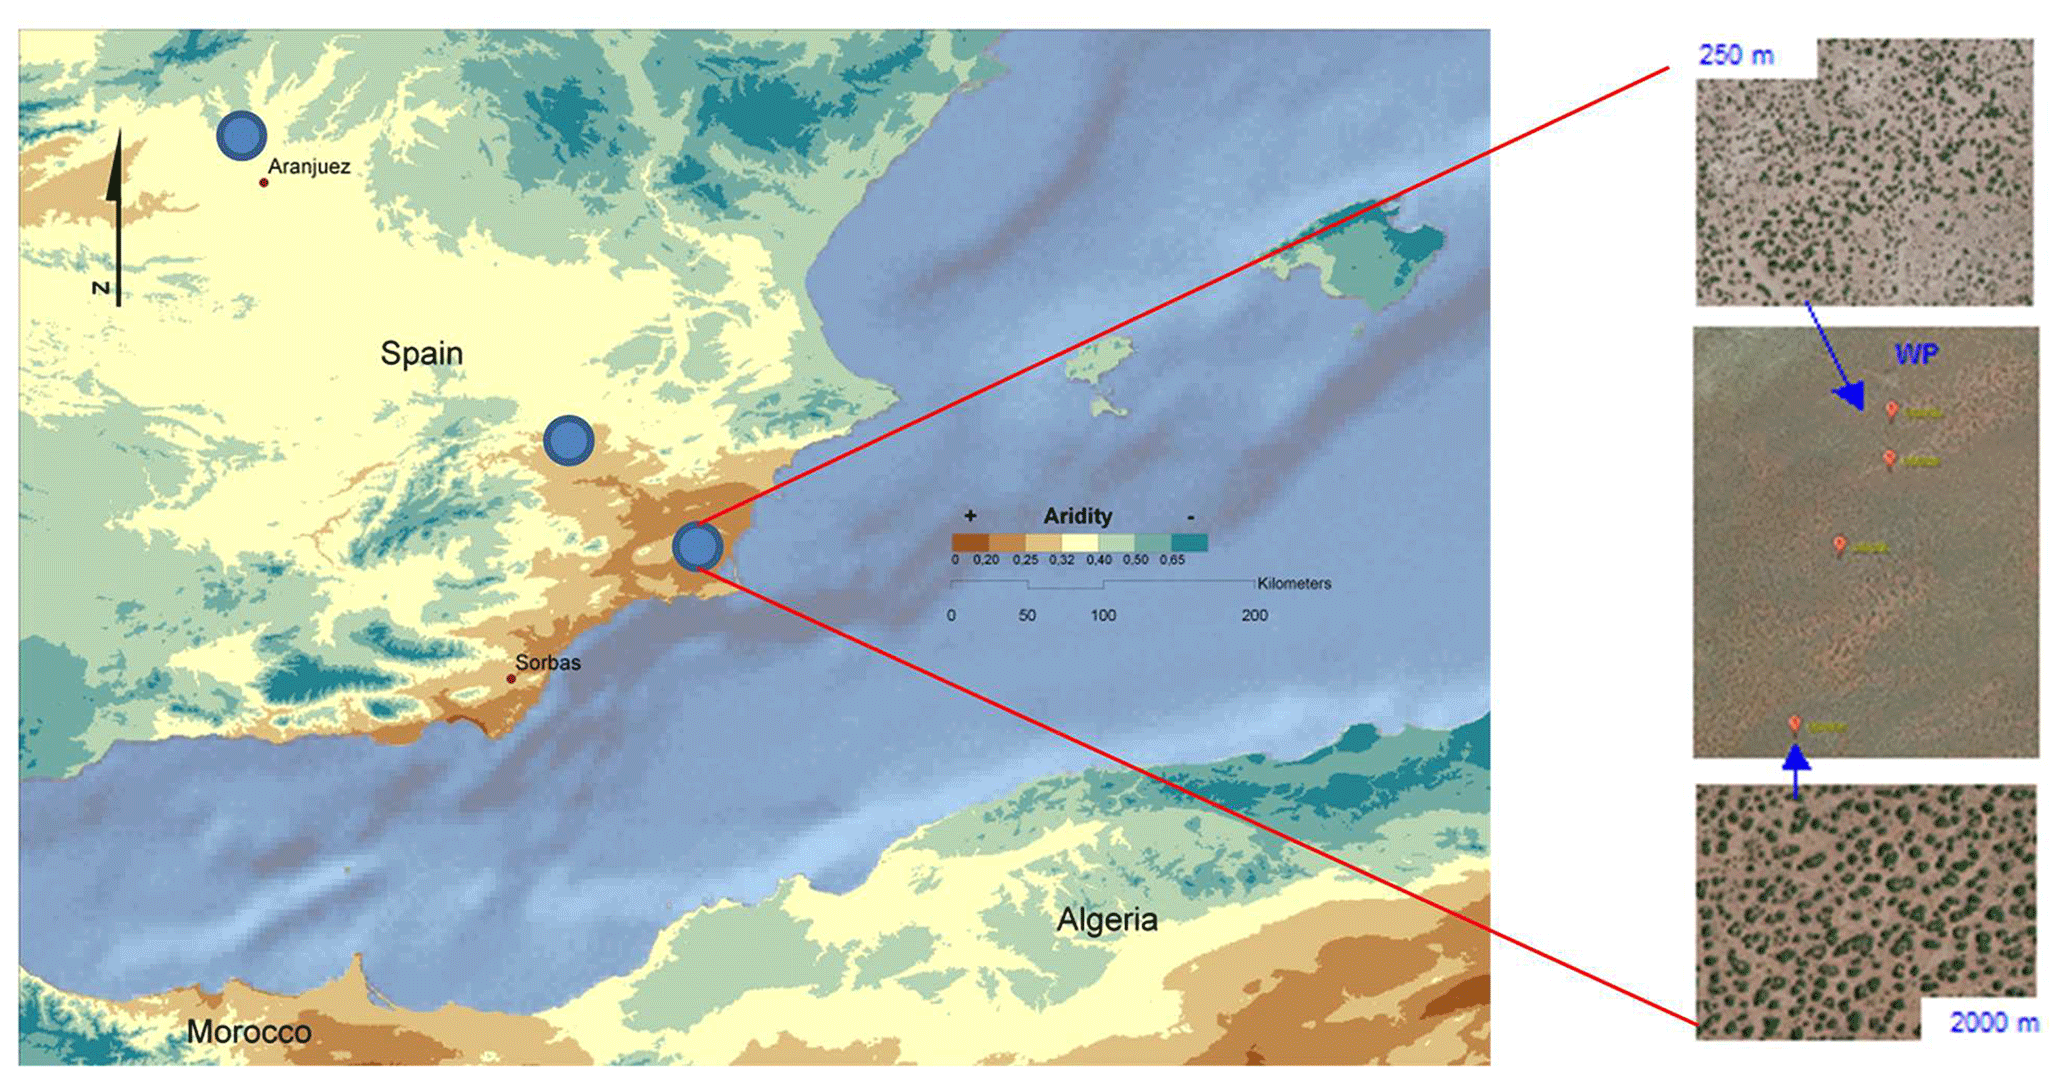
Figure 3Hypothetical example of the survey scheme, showing the location of three survey sites (blue dots in the left panel) and the location of plots along watering points (WPs) within one of these sites. In the right panels, the image in the center shows the location of three plots, and the upper and lower images show the plots located at 250 and 2000 m from the watering point, respectively.
While the evaluation of grazing pressure at each site based on a combination of the distance to a water point and expert knowledge may seem subjective, each team doing fieldwork was very familiar with the main features of the grazing system present in the plots they surveyed. In eight of the sites surveyed, local grazing gradients were not established using water points but rather using fences separating paddocks with different grazing intensities. In any case, plots at each site were established in areas representative of the vegetation and soil types that can be found there, so the impacts of grazing pressure could be assessed without confounding factors associated with variation in soil, climate or vegetation type. Selected water points were separated from other watering points or elements that could interrupt the movement of livestock (e.g., fences) by at least 1 km to avoid confounding effects that could alter the effects of the distance from the water point on the ecosystem structural and functional attributes to be measured.
We conducted multiple validation tests of the heuristic value of grazing pressure obtained at each plot by (i) measuring recent grazing pressure in situ in all plots by counting, identifying and weighting the dung or pellets of all herbivores within quadrats (see Sect. 2.3.1 below), (ii) using livestock density data from local statistics, observations or interviews with local farmers (whenever available), and (iii) measuring the width and depth of all livestock tracks crossing each 45 m transect to derive a total cross-sectional area of livestock tracks for each site (see Sect. 2.3.2 below). All validation tests conducted, described in detail in Maestre et al. (2022), demonstrate that our approach quantified the full spectrum of grazing intensities found at each site.
The large variability in the characteristics of extensive grazing systems present across the drylands surveyed did not allow us to find all grazing intensities (ungrazed and low, medium and high grazing pressure) at all sites. A total of 52 of the 98 sites surveyed had three plots corresponding to low, medium and high grazing intensities. An additional fourth plot in an ungrazed area was also surveyed at 35 of the sites. An ungrazed control plus two additional grazing levels (medium and high or low and high) were surveyed at eight sites. In three sites, only two plots could be surveyed because they did not have either low or medium grazing areas. In total, 326 45 m × 45 m plots were surveyed in situ as described in the next sections.
2.2 Vegetation survey
All measurements were taken within 45 m × 45 m plots. At each plot, we located four 45 m long transects downslope for vegetation and soil surveys (Figs. 4a and 5). The slope and aspect of each transect were measured with a clinometer and a compass, respectively, upon the placement of the transects in the field.

Figure 4(a) Scheme of a 45 m × 45 m plot surveyed in the field and of the placement of the transects for the survey of vegetation. (b) Placement of the quadrats in the transects within the plot (25 consecutive quadrats per transect, 100 per plot). The blue-colored quadrats are those used for sampling plant functional traits within the transects. (c) Layout of the quadrats for counting pellets/dungs when large (blue quadrats, 5 m × 5 m size) or small (green quadrats, 1 m × 1 m size) grazers are present. The numbers 1, 2, 3 and 4 denote the points where measurements of slope and aspect are taken.
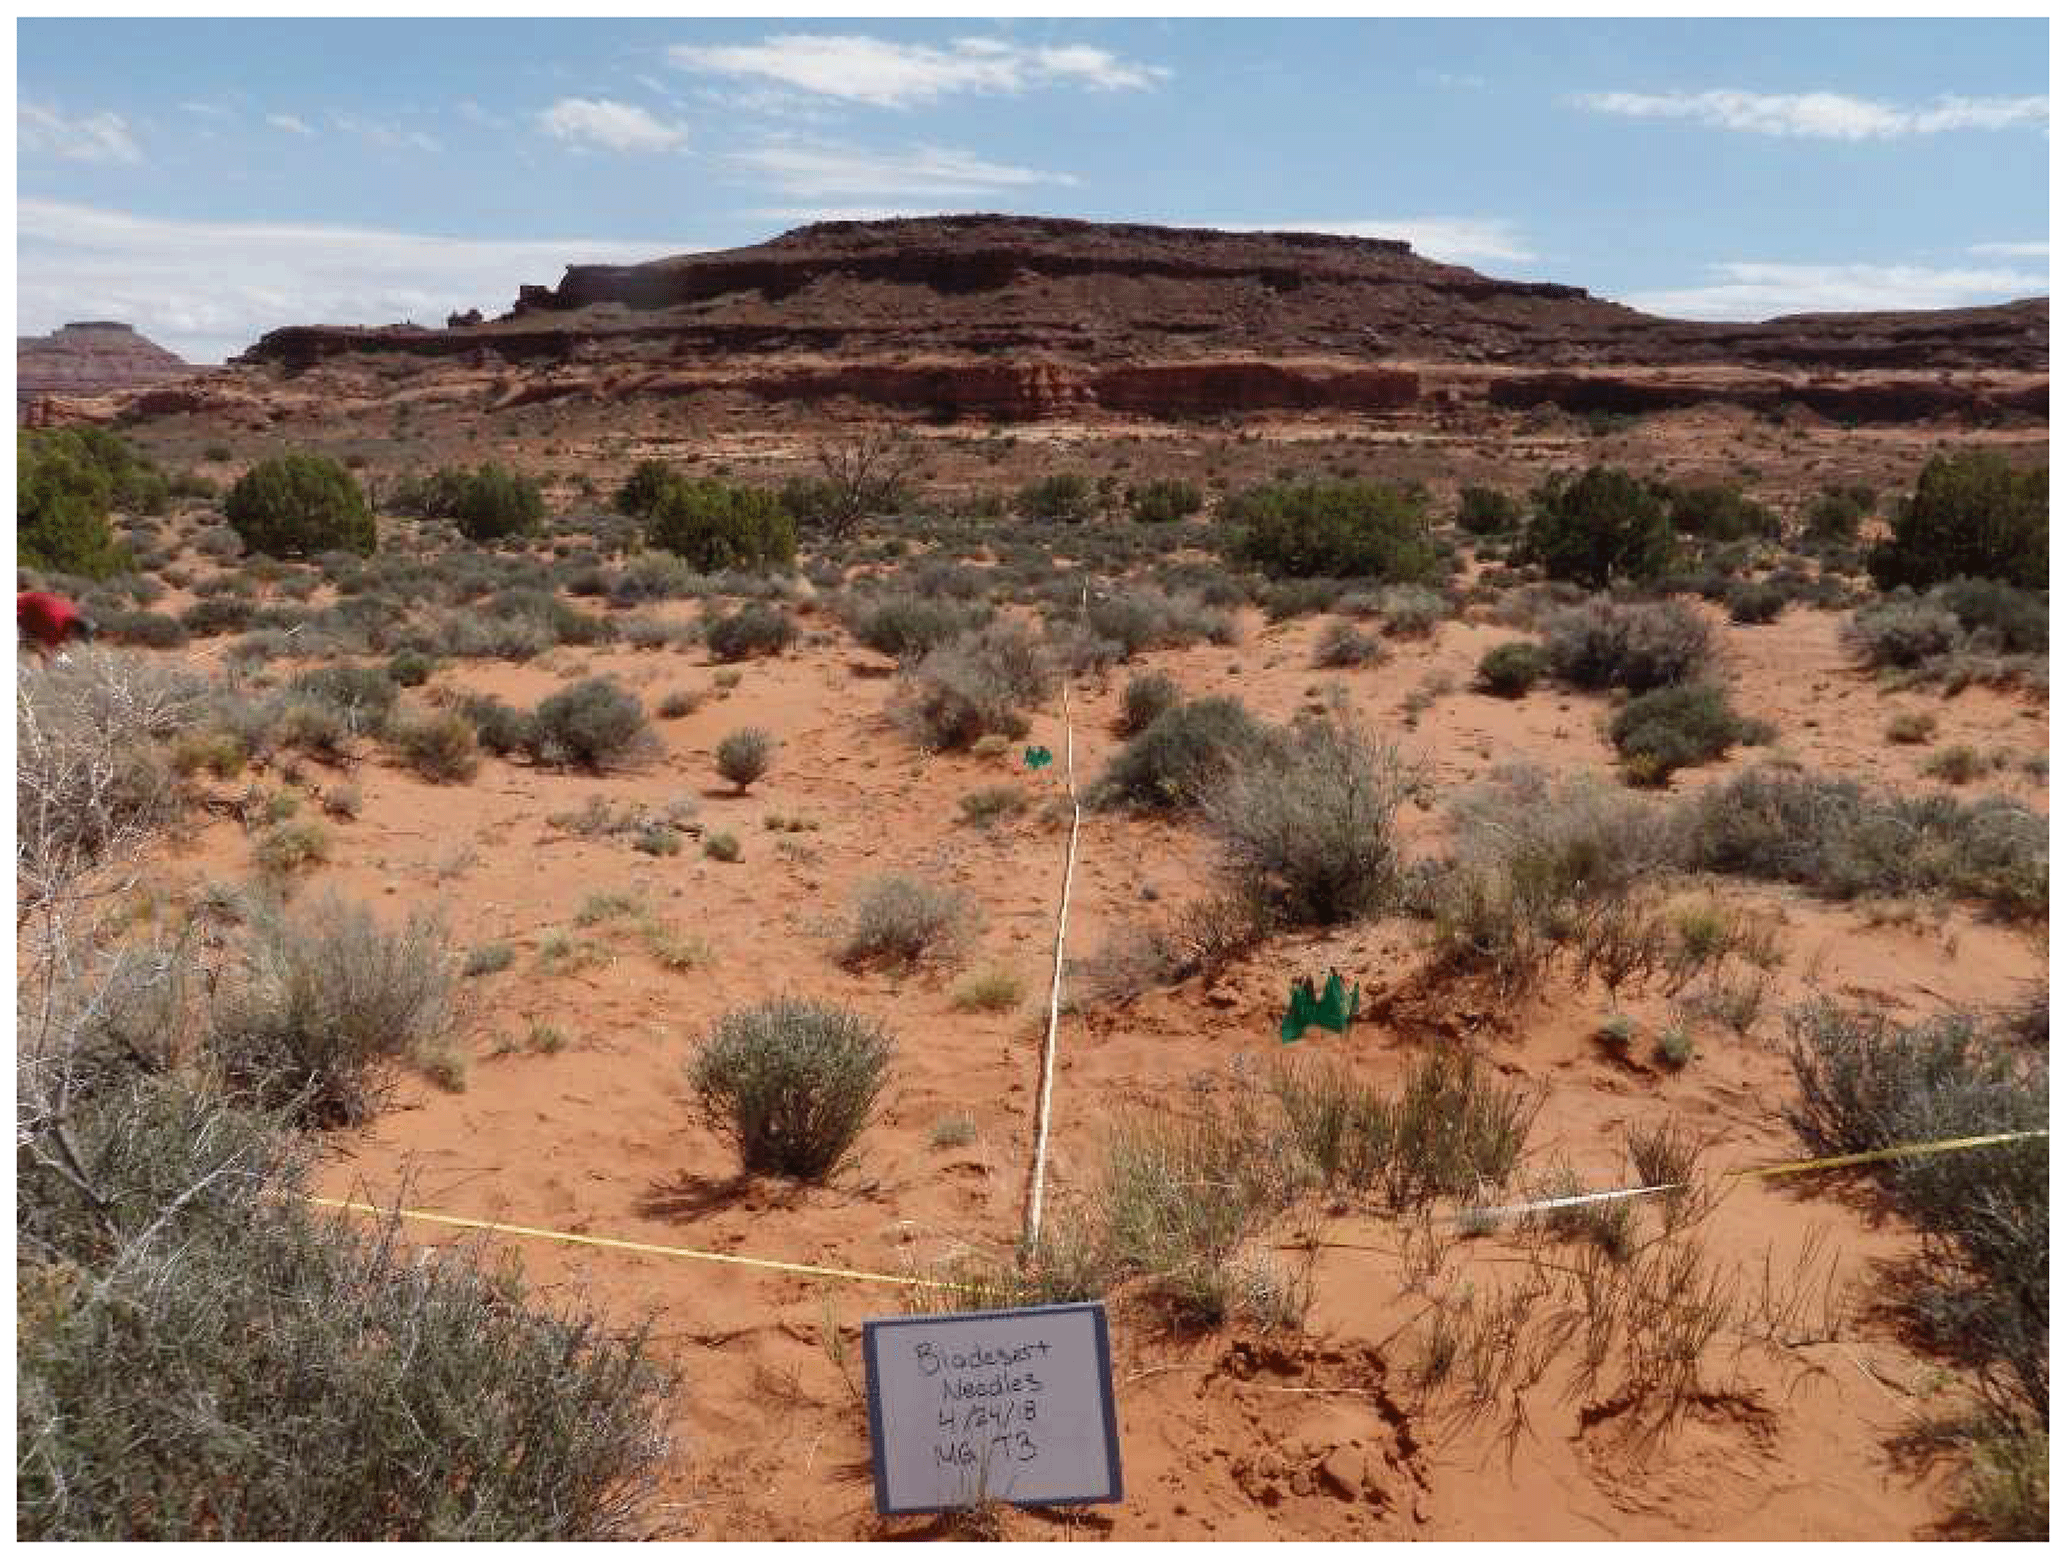
Figure 5Example of a transect line placed in the field. Photograph by Matthew Bowker.
Six different vegetation surveys took place at each plot as described in the next subsections: (i) “patch”–“inter-patch” survey with the line-intercept method (mandatory), (ii) cover and diversity survey with quadrats (mandatory), (iii) cover and diversity survey using the line-point intercept method (mandatory), (iv) plant functional trait survey (mandatory), and (v) facilitation survey (optional). All the vegetation surveys took place at each site during the peak of the growing season or immediately just after.
2.2.1 “Patch”–“inter-patch” survey with the line-intercept method
A patch is defined as a long-lived feature such as perennial plants and shrub branches making contact with the soil that is able to collect runoff water, as well as entrained sediment and nutrients (Tongway and Hindley, 1995). Patches are structures that accumulate resources by restricting the downslope flow of water, topsoil and organic matter and are separated from each other by areas of bare soil or annual vegetation (inter-patch zone). Inter-patches are characterized as zones where resources such as water, soil materials and litter are freely transported either downslope, when water is the active motive agent, or down wind, when eolian processes are active (Tongway and Hindley, 1995, 2004). Patches can comprise physical features such as furrows or bays created by active land-forming processes or biological features such as plants or fallen logs. The deposition of alluvium or litter is a common identifying factor in helping to recognize patches in the field (see Tongway and Hindley, 2004, for additional guidelines to assist the identification of patch and inter-patch zones in situ). While multiple types of inter-patch zones can be established, for the sake of simplicity, and to obtain data as standardized as possible among sites, we only differentiated two types of inter-patches: bare soil and rock outcrops. We considered inter-patches dominated by annual plants or biocrusts as bare soil (but with a cover of annuals or biocrusts) because our study focused on perennial plants.
The use of the line-intercept method allowed us to collect a continuous record of patch (perennial plants, accumulations of permanent litter, stems and logs placed on the soil surface) and inter-patch zones along each transect (Fig. 6). Once we identified a patch, we established its boundaries and measured its length along the transect and its width at right angles to the transect line (Fig. 7). Clumps of grasses, or of grasses and small shrubs growing closely together or connected with litter bridges, were considered to constitute a single patch. See Fig. 8 for an illustrated example of the patch–inter-patch survey.
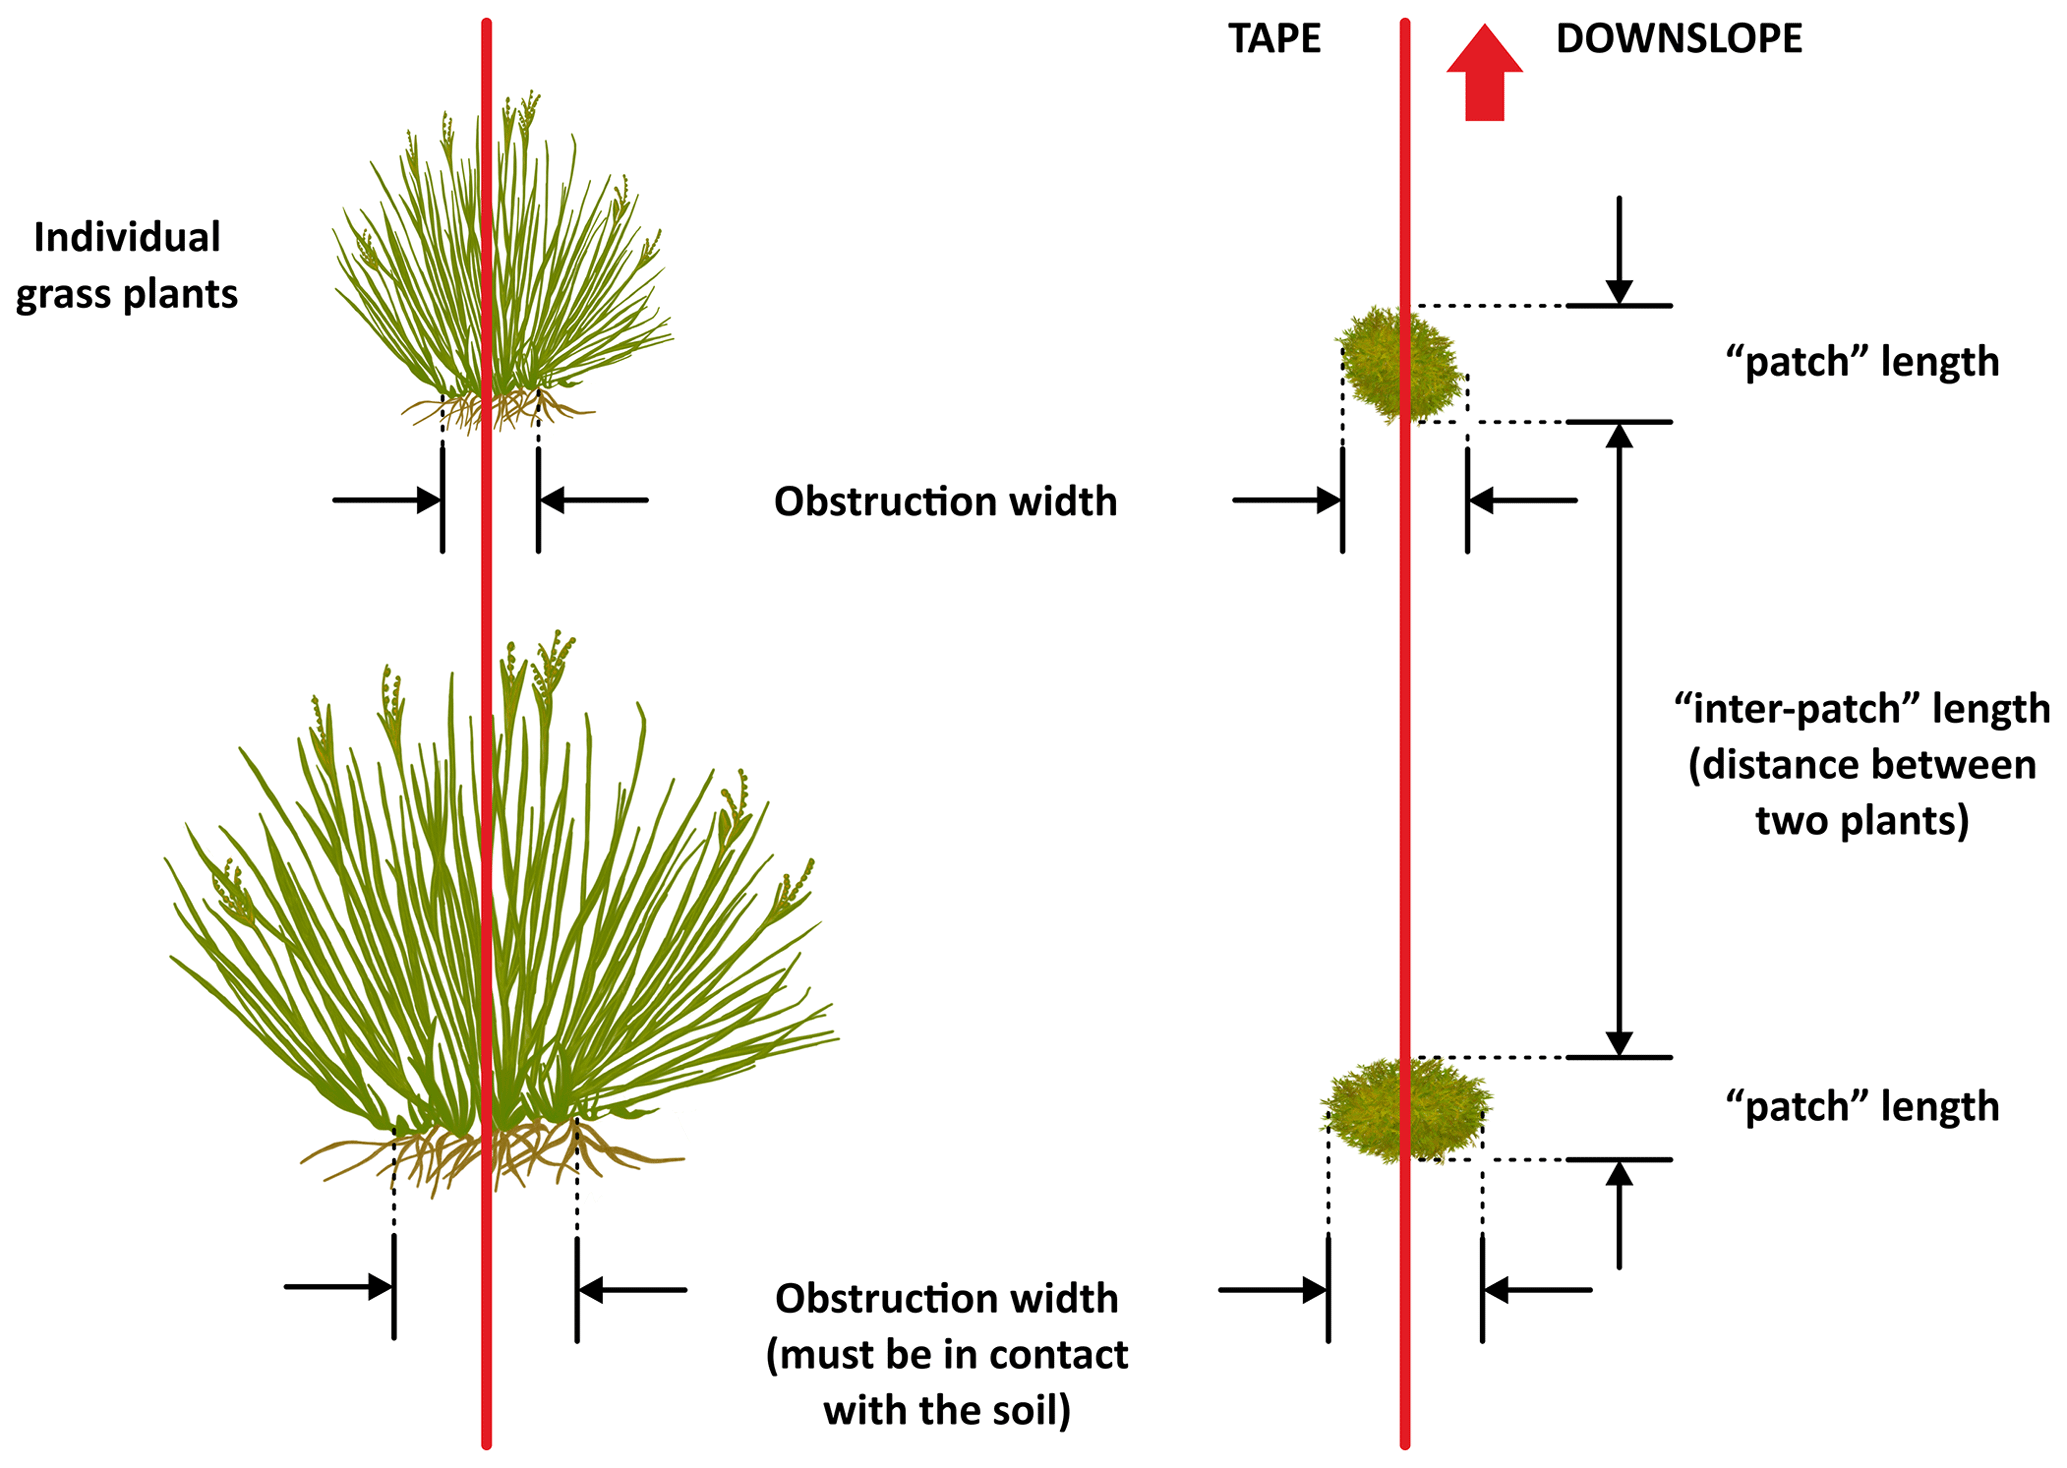
Figure 6Illustration of how to measure individual grasses when they form the patches on a monitoring transect. Redrawn from Tongway and Hindley (2004).
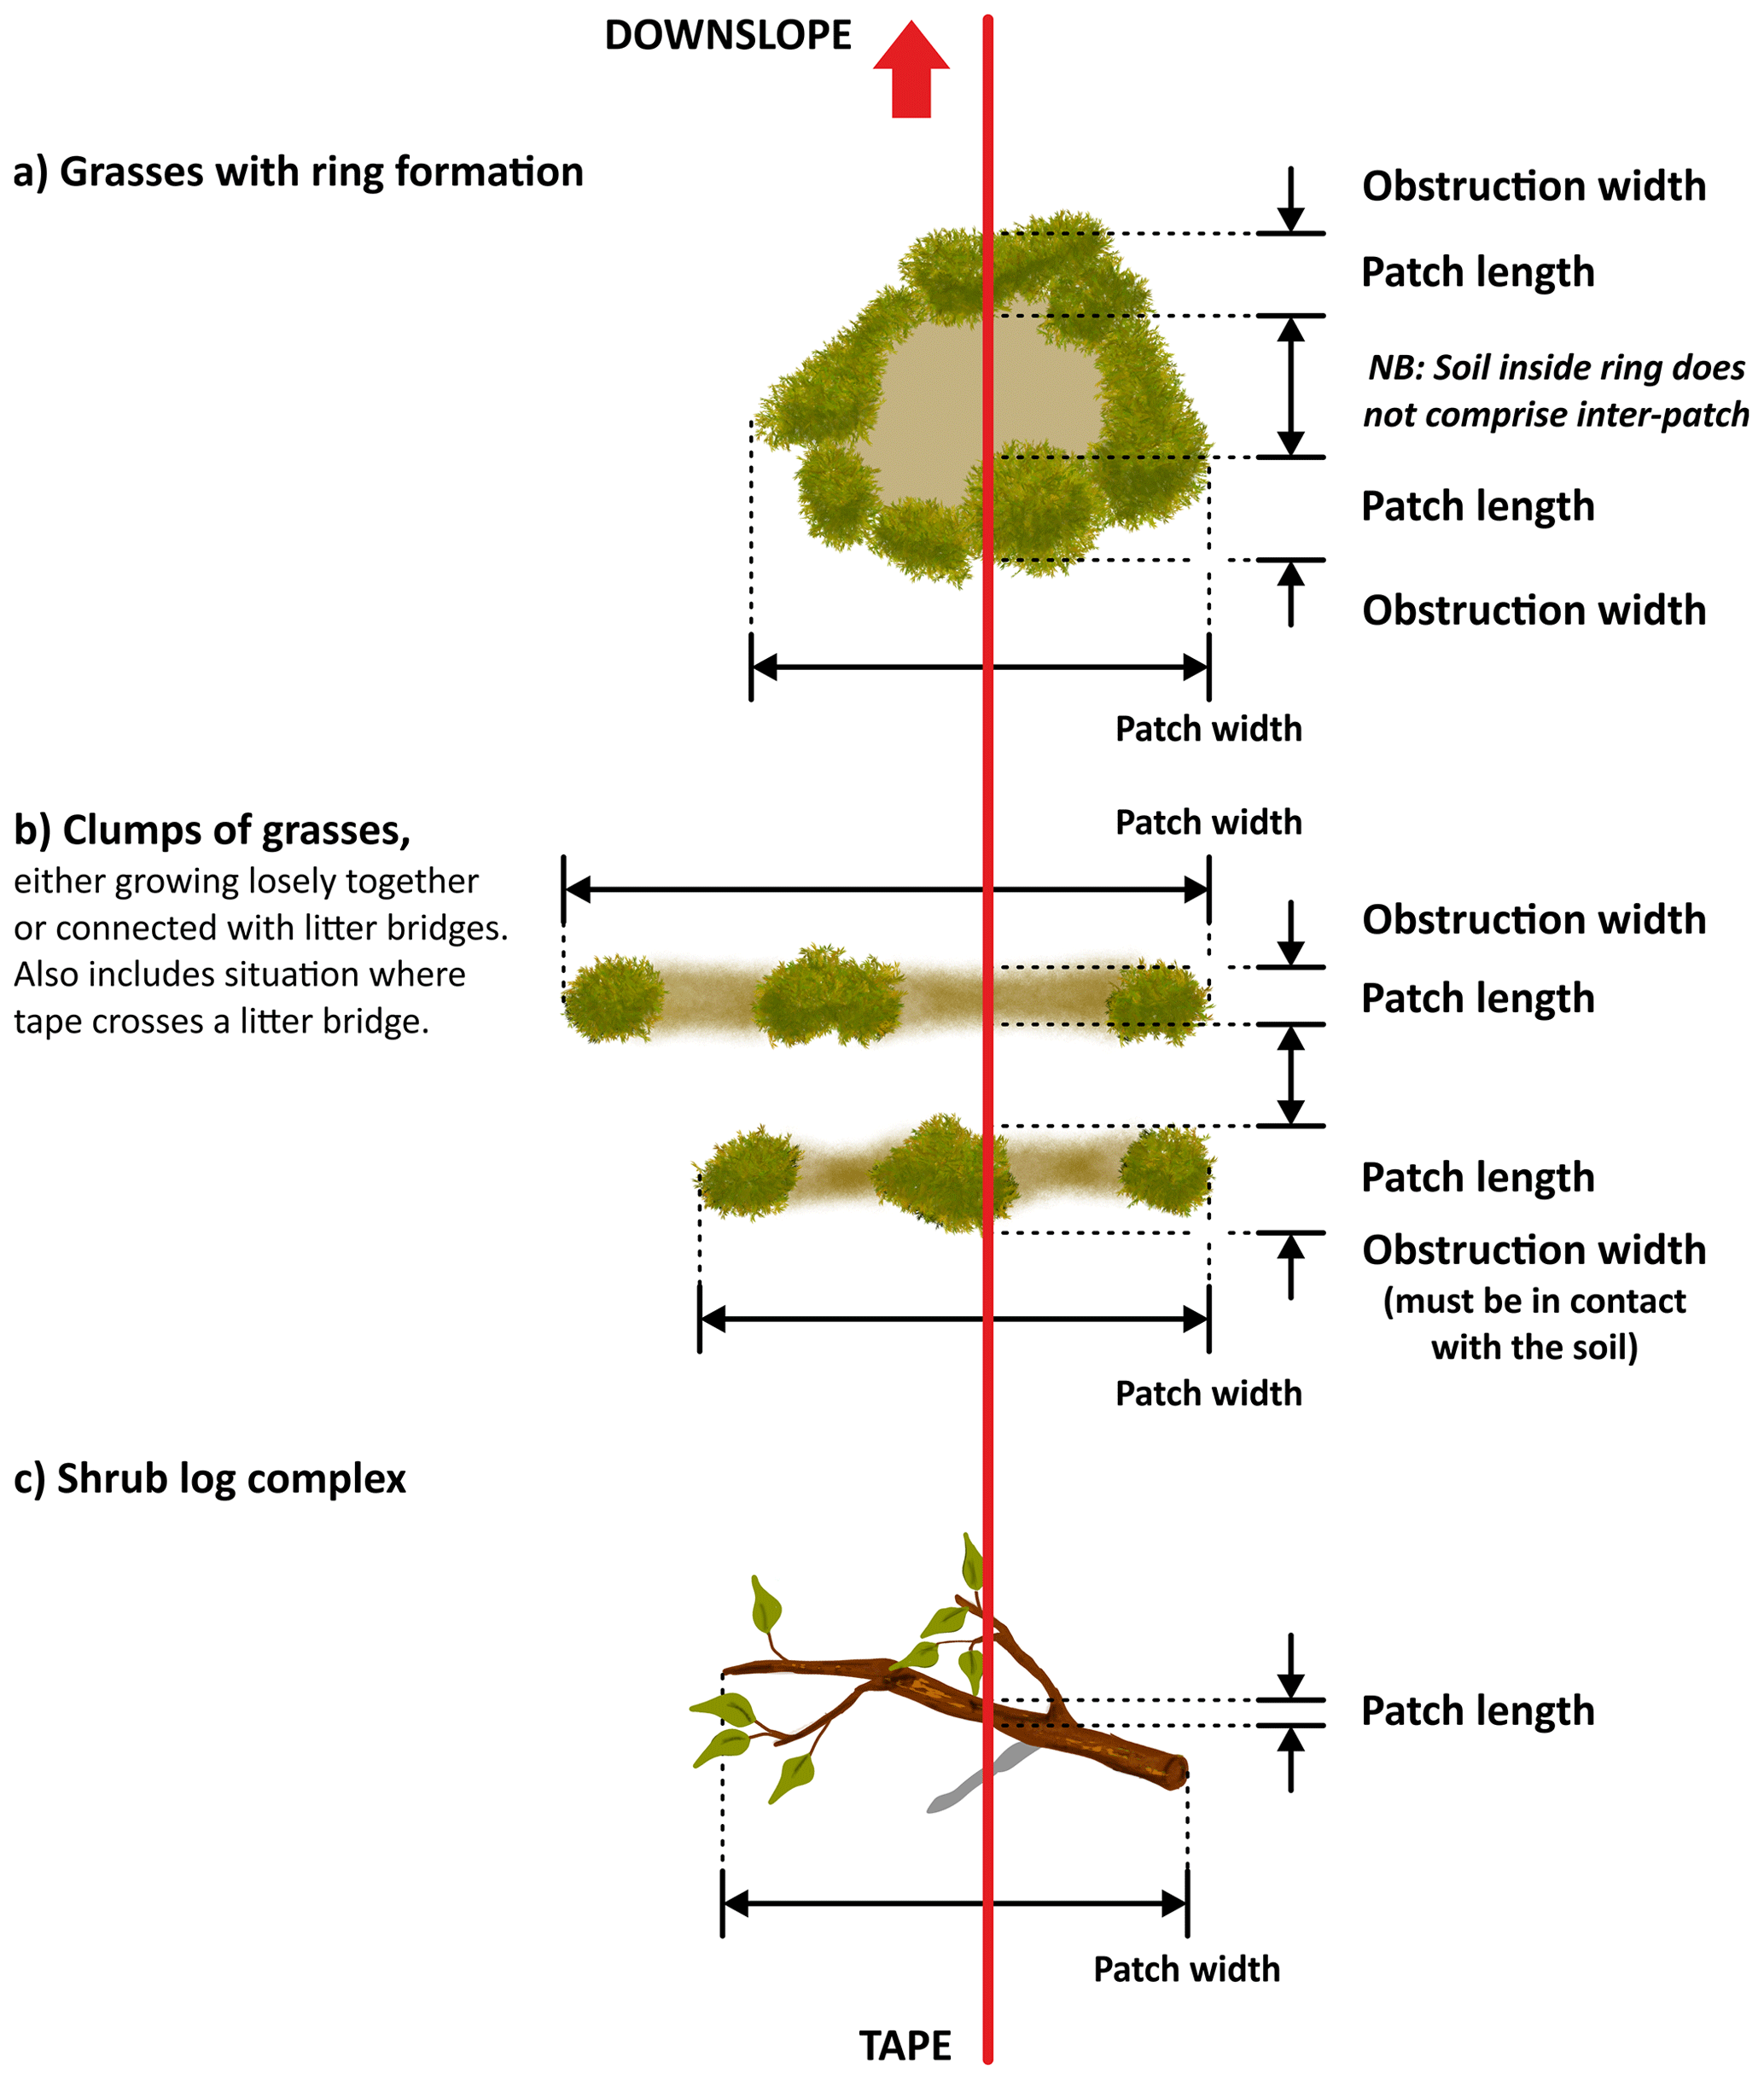
Figure 7A diagrammatic illustration showing how to measure the length (along the transect) and the width of patches (right angles to the transect). Redrawn from Tongway and Hindley (2004).
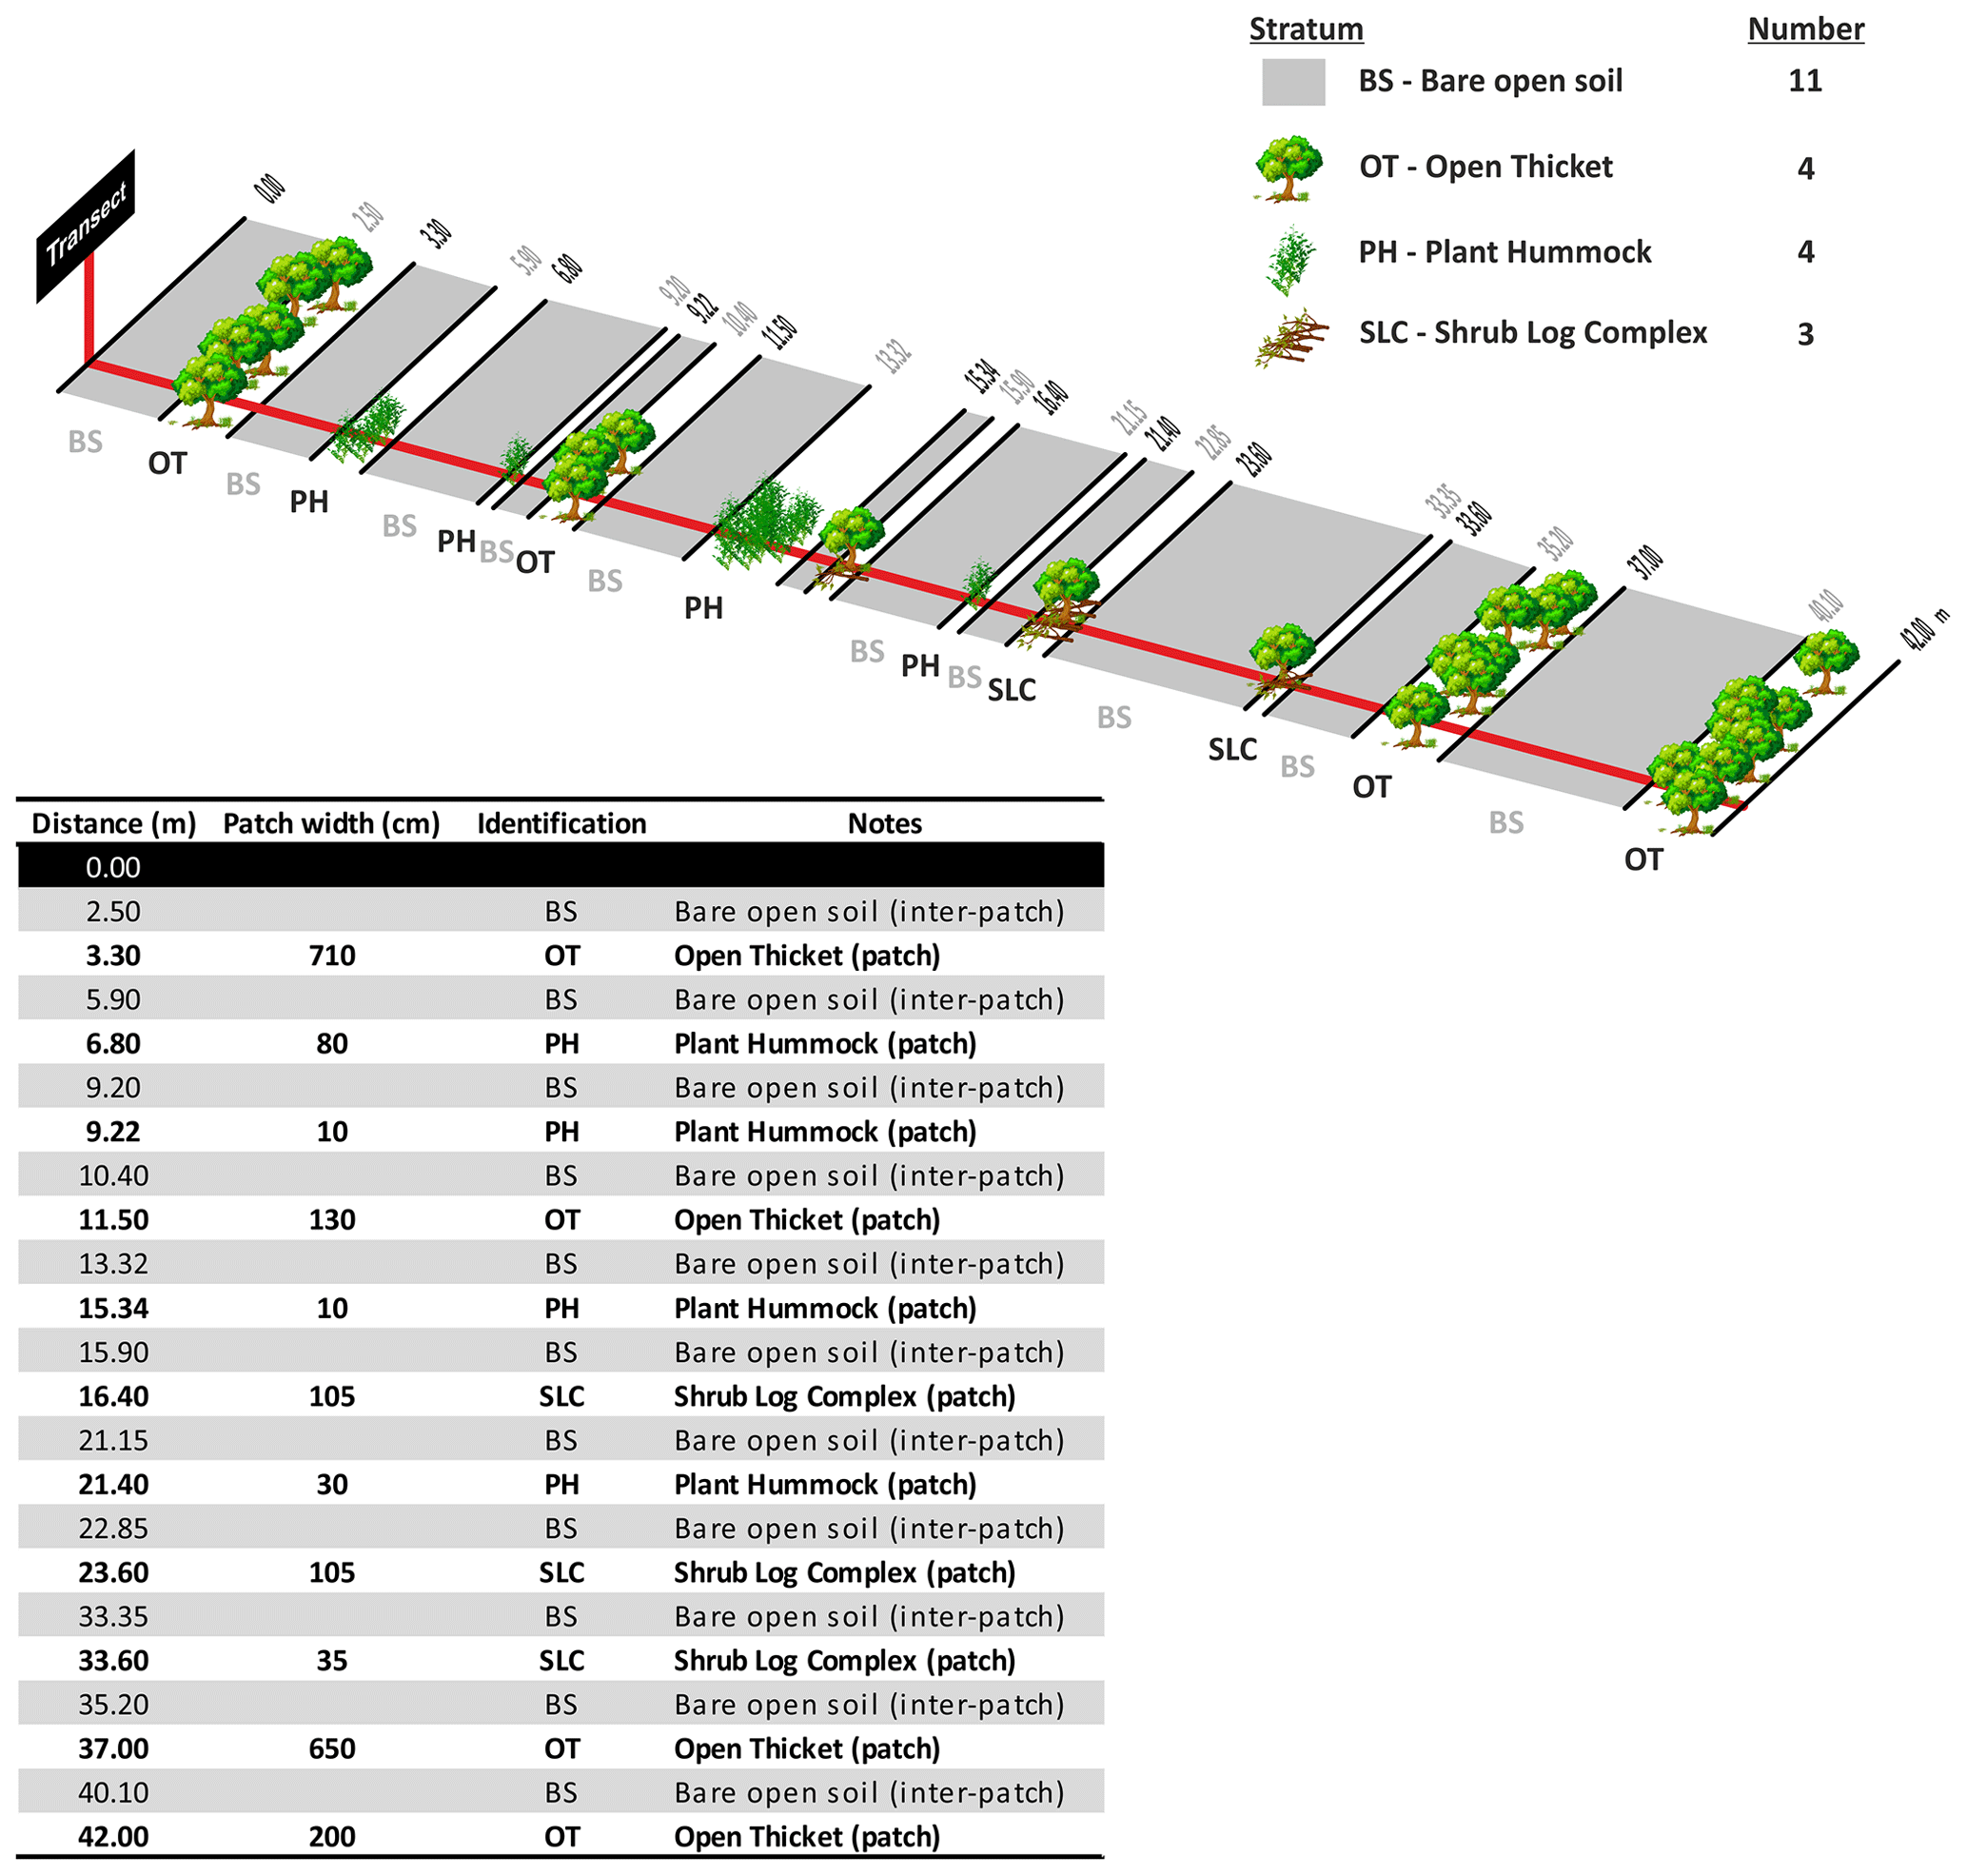
Figure 8Illustrated example of a transect and its information once recorded in the field data sheet. Redrawn from Tongway and Hindley (2004).
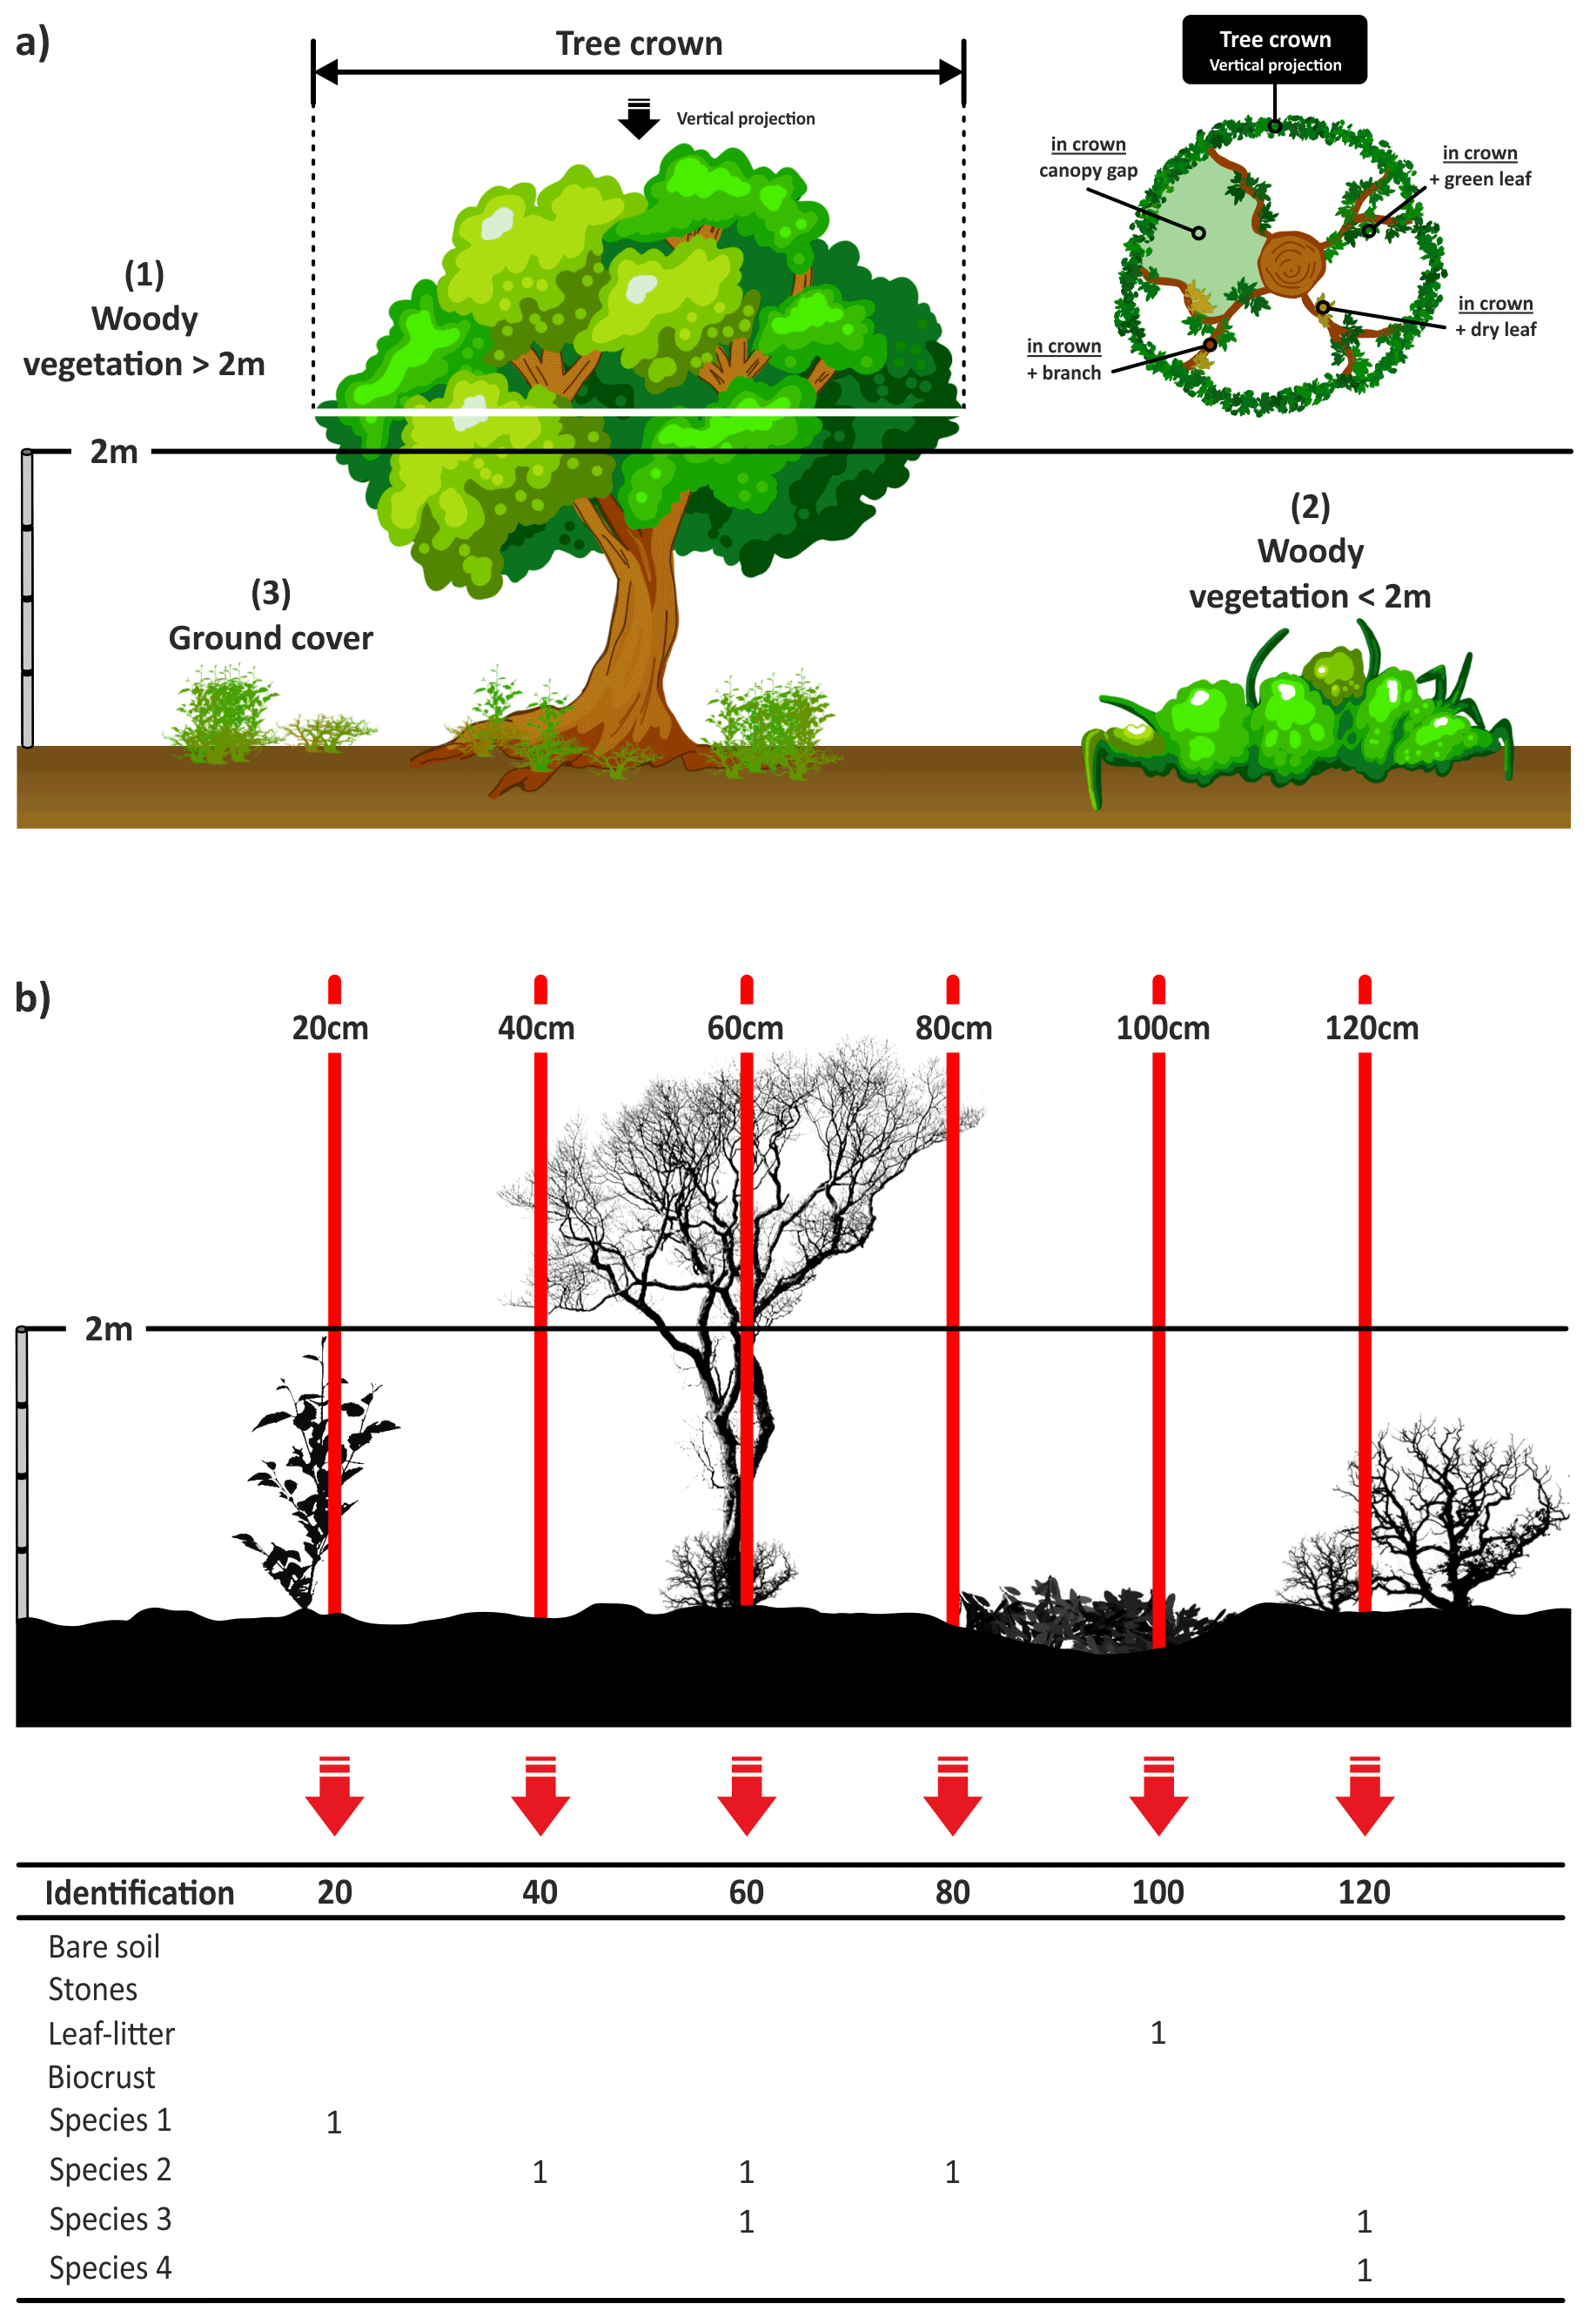
Figure 9(a) Examples of the three categories of vegetation measured (redrawn from Muir et al., 2011). (b) Example of an annotated transect. Each intercept is recorded with “1”.
2.2.2 Cover and diversity survey with quadrats
Along each of the four transects located in the field, we also placed 25 consecutive quadrats (1.5 m × 1.5 m size; Fig. 4b) within which we visually assessed the cover of every perennial species relative to quadrat size (to 1 %). These data can be used to assess, among other things, the composition and diversity of perennial plant communities, their spatial association networks, and intransitive interactions (e.g., Maestre et al., 2012; Soliveres et al., 2015; Saiz et al., 2018). A total of 100 quadrats were sampled within each plot. Whenever possible, the presence of perennial species located within the 45 m ×45 m plot, but not recorded in the quadrats, was also recorded.
2.2.3 Cover and diversity survey using the line-point intercept method
The line-point intercept method (Levy and Madden, 1933) is a quick, easy and accurate method for quantifying vegetation cover. This survey complemented the information provided by the line-intercept and quadrat surveys described in the preceding sections and allowed us to compare our results with those obtained using other widely used dryland monitoring methods (Herrick et al., 2005; Oliva et al., 2020). In this survey we gathered information on three vegetation categories (Fig. 9a) according to the guidelines provided by Muir et al. (2011).
Ground cover includes non-woody vegetation (such as grasses, forbs and herbs), litter and biocrusts (biological soil crust composed of non-vascular plants; Weber et al., 2016), bare soil, and rocks. There is no height restriction for non-woody vegetation.
Midstory includes all woody vegetation with a height lower than 2 m (i.e., shrubs and small trees).
Overstory includes all woody vegetation with a height of 2 m or more (i.e., tall shrubs and trees).
Along each of the four 45 m transects established in each plot, a measuring tape was fixed as tense and as close to the ground surface as possible (Fig. 5, thread under shrubs using a steel pin as a needle). A measurement was always recorded for the ground cover category. Measurements were made for midstory/overstory categories only in those cases when these elements were observed. Every 20 cm along the tape, a metal needle (2 m height) was dropped vertically, and the relevant cover type was recorded in the appropriate category (Fig. 9b):
-
Bare soil.
-
Rock. This includes all stones and rock material greater than 20 mm.
-
Biocrusts. We recorded whether the biocrust component was lichen, moss or cyanobacteria. If the species could be identified in the field, it was also recorded (Fig. 10).
-
Litter. This includes dead detached plant material including branches, leaves or fallen tree trunks.
-
Vegetation. The species name was recorded, as well as whether it was alive (“green”) or dried (“dry”) according to the following guidelines:
-
“Green leaf” is a leaf with green pigmentation (one that is actively photosynthesizing) that is attached to the plant.
-
“Dry leaf” is a leaf with non-green pigmentation (one that is not actively photosynthesizing). This can include senescent (alive) vegetation as well as dead vegetation. It must be attached to the ground or plant.
-
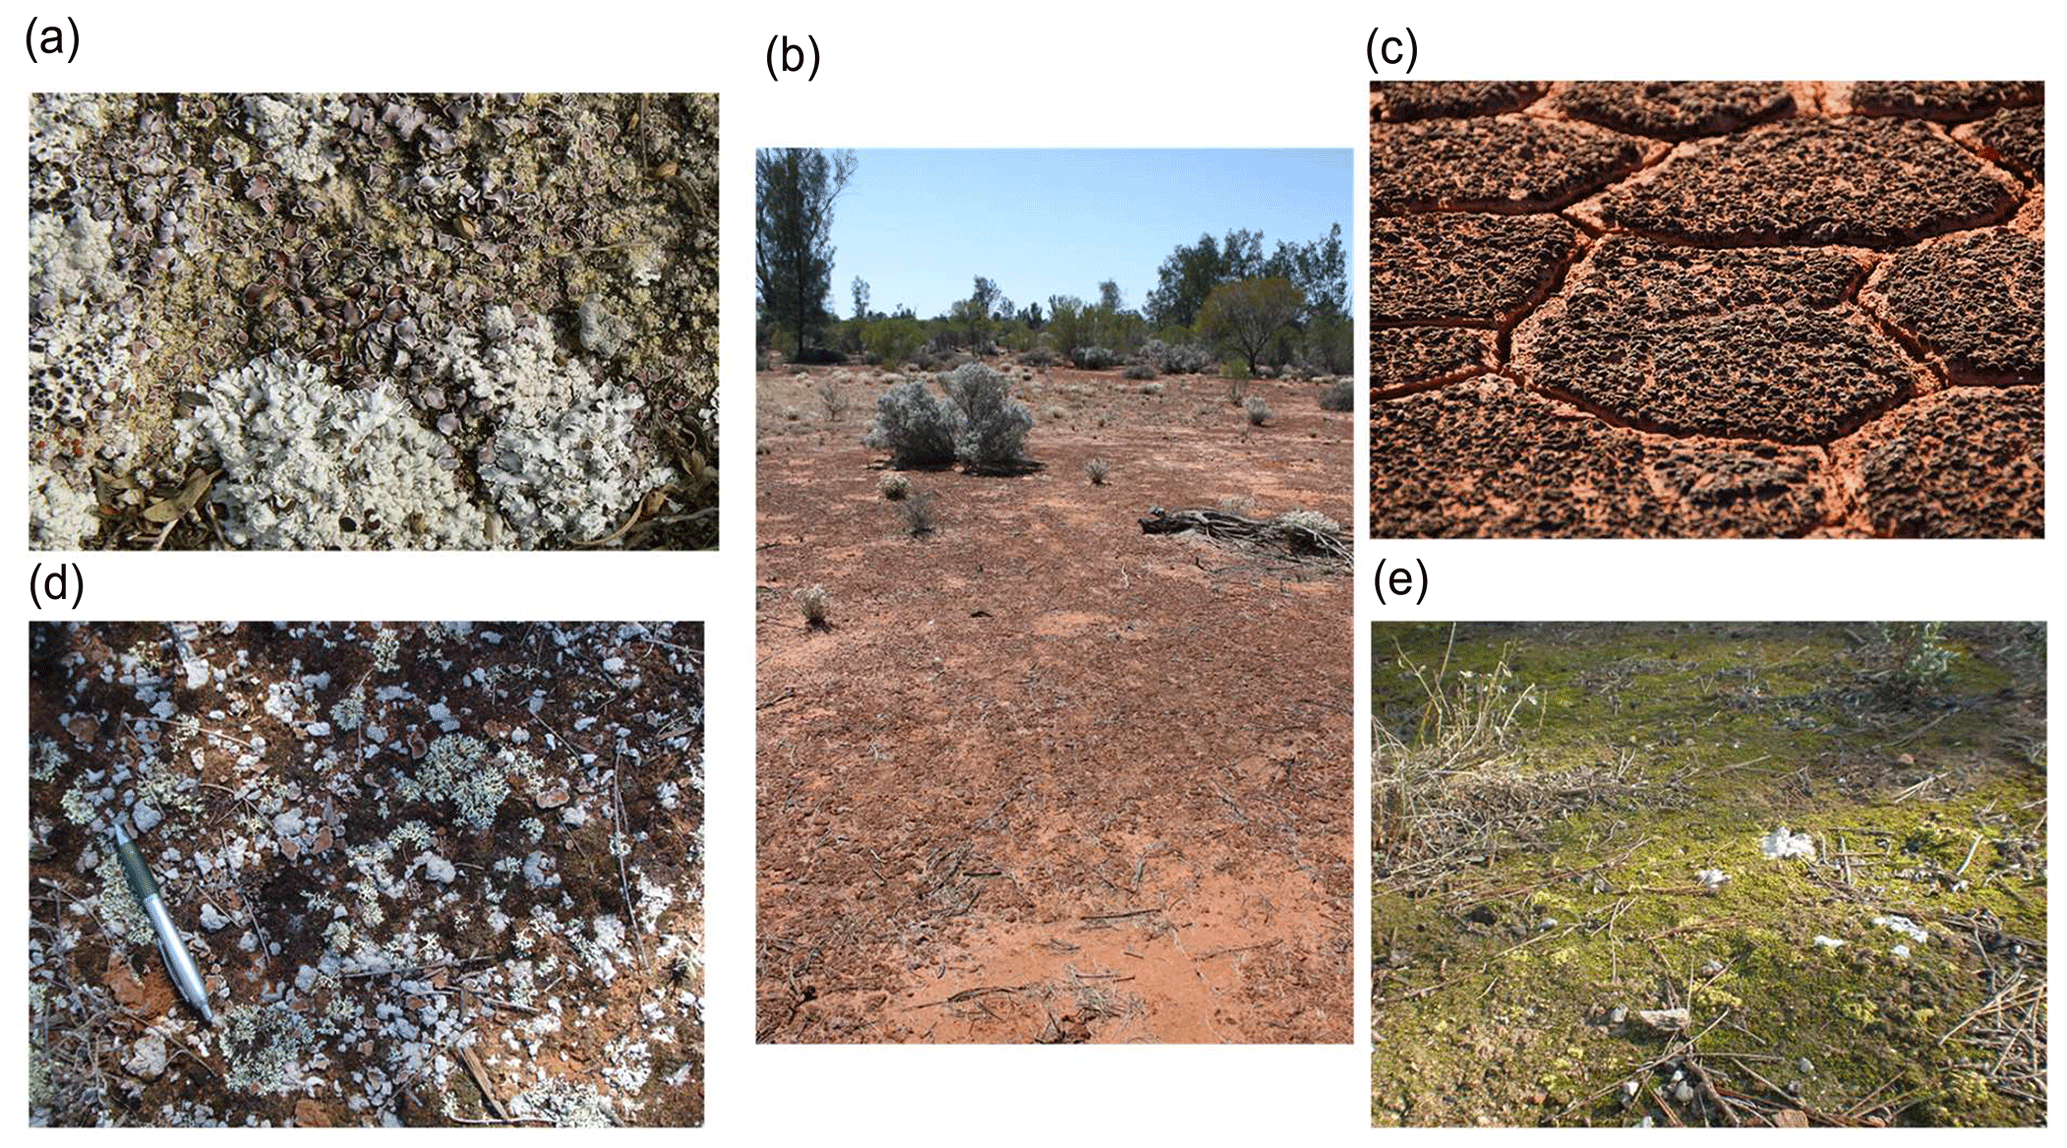
Figure 10Examples of bare ground areas with lichen-dominated cyanobacterial biocrusts (a), cyanobacteria-dominated biocrusts (b, c), cyanobacteria/lichen/moss-dominated biocrusts (d) and moss-dominated biocrusts (e). Photographs by Matthew Bowker (a, c, d), David Eldridge (b) and Fernando T. Maestre (e).
When midstory plants were present on the transect, we recorded them using the same needle directly above the position used with ground story cover. The species name and its status (green leaf, dry leaf or branch) were recorded. When Overstory vegetation was present, we recorded the species name and its status (dead or alive; if alive we recorded if the pin projected over a green leaf, dry leaf, branch or canopy gap; Fig. 9a).
2.2.4 Plant functional trait survey
We aimed to estimate the trait distributions that characterize the functional diversity exhibited by the dryland plant communities surveyed while considering the intraspecific trait variability and the spatial distribution of species traits within each plot. These measurements can provide important insights on the drivers and consequences of both aridity and grazing pressure on ecosystem structure and functioning (see Gross et al., 2013, 2017; Valencia et al., 2015; García-Palacios et al., 2018; Le Bagousse-Pinguet et al., 2017, 2019, 2021 for examples). All the protocols described followed the standardized protocols commonly used in trait-based research (Pérez-Harguindeguy et al., 2013). The plant trait survey involved the following steps:
-
Five 1.5 m × 1.5 m quadrats regularly spaced per transect were selected (20 quadrats per plot; Fig. 4b). If by chance there were no perennial plants within a given quadrat (i.e., 100 % bare soil), this was noted in the data sheet, and another quadrat was randomly chosen from within the same transect.
-
In each quadrat, the cover of all perennial species was noted (these measurements were obtained from Sect. 2.2.2 described above).
-
In each quadrat, the tallest and most well-developed individual of each species was selected.
-
Functional traits were measured on the selected individuals.
Measuring plant size and leaf traits
Traits related to plant size (maximum vegetative height, plant lateral spread and maximum leaf length) were measured as follows:
-
Maximum vegetative height. We measured plant height (cm), i.e., the vertical distance from the ground to the highest green leaf. We excluded from this measurement inflorescences where reproductive stems overtop vegetative organs (e.g., grasses; see examples in Fig. 11a).
-
Lateral spread. Lateral spread, a proxy of plant area, was measured by assessing plant diameter (cm). Plant diameter was measured in two orthogonal directions through the center of the plant (Fig. 11b).
-
Leaf Length. For each selected individual, we measured the longest leaf (cm), excluding the petiole when present (Fig. 11c). Leaf length could be measured directly in the field (e.g., for those species with long leaves) or in the lab using the pictures obtained for leaf area measurements (e.g., for those species with small leaves difficult to measure under field conditions).
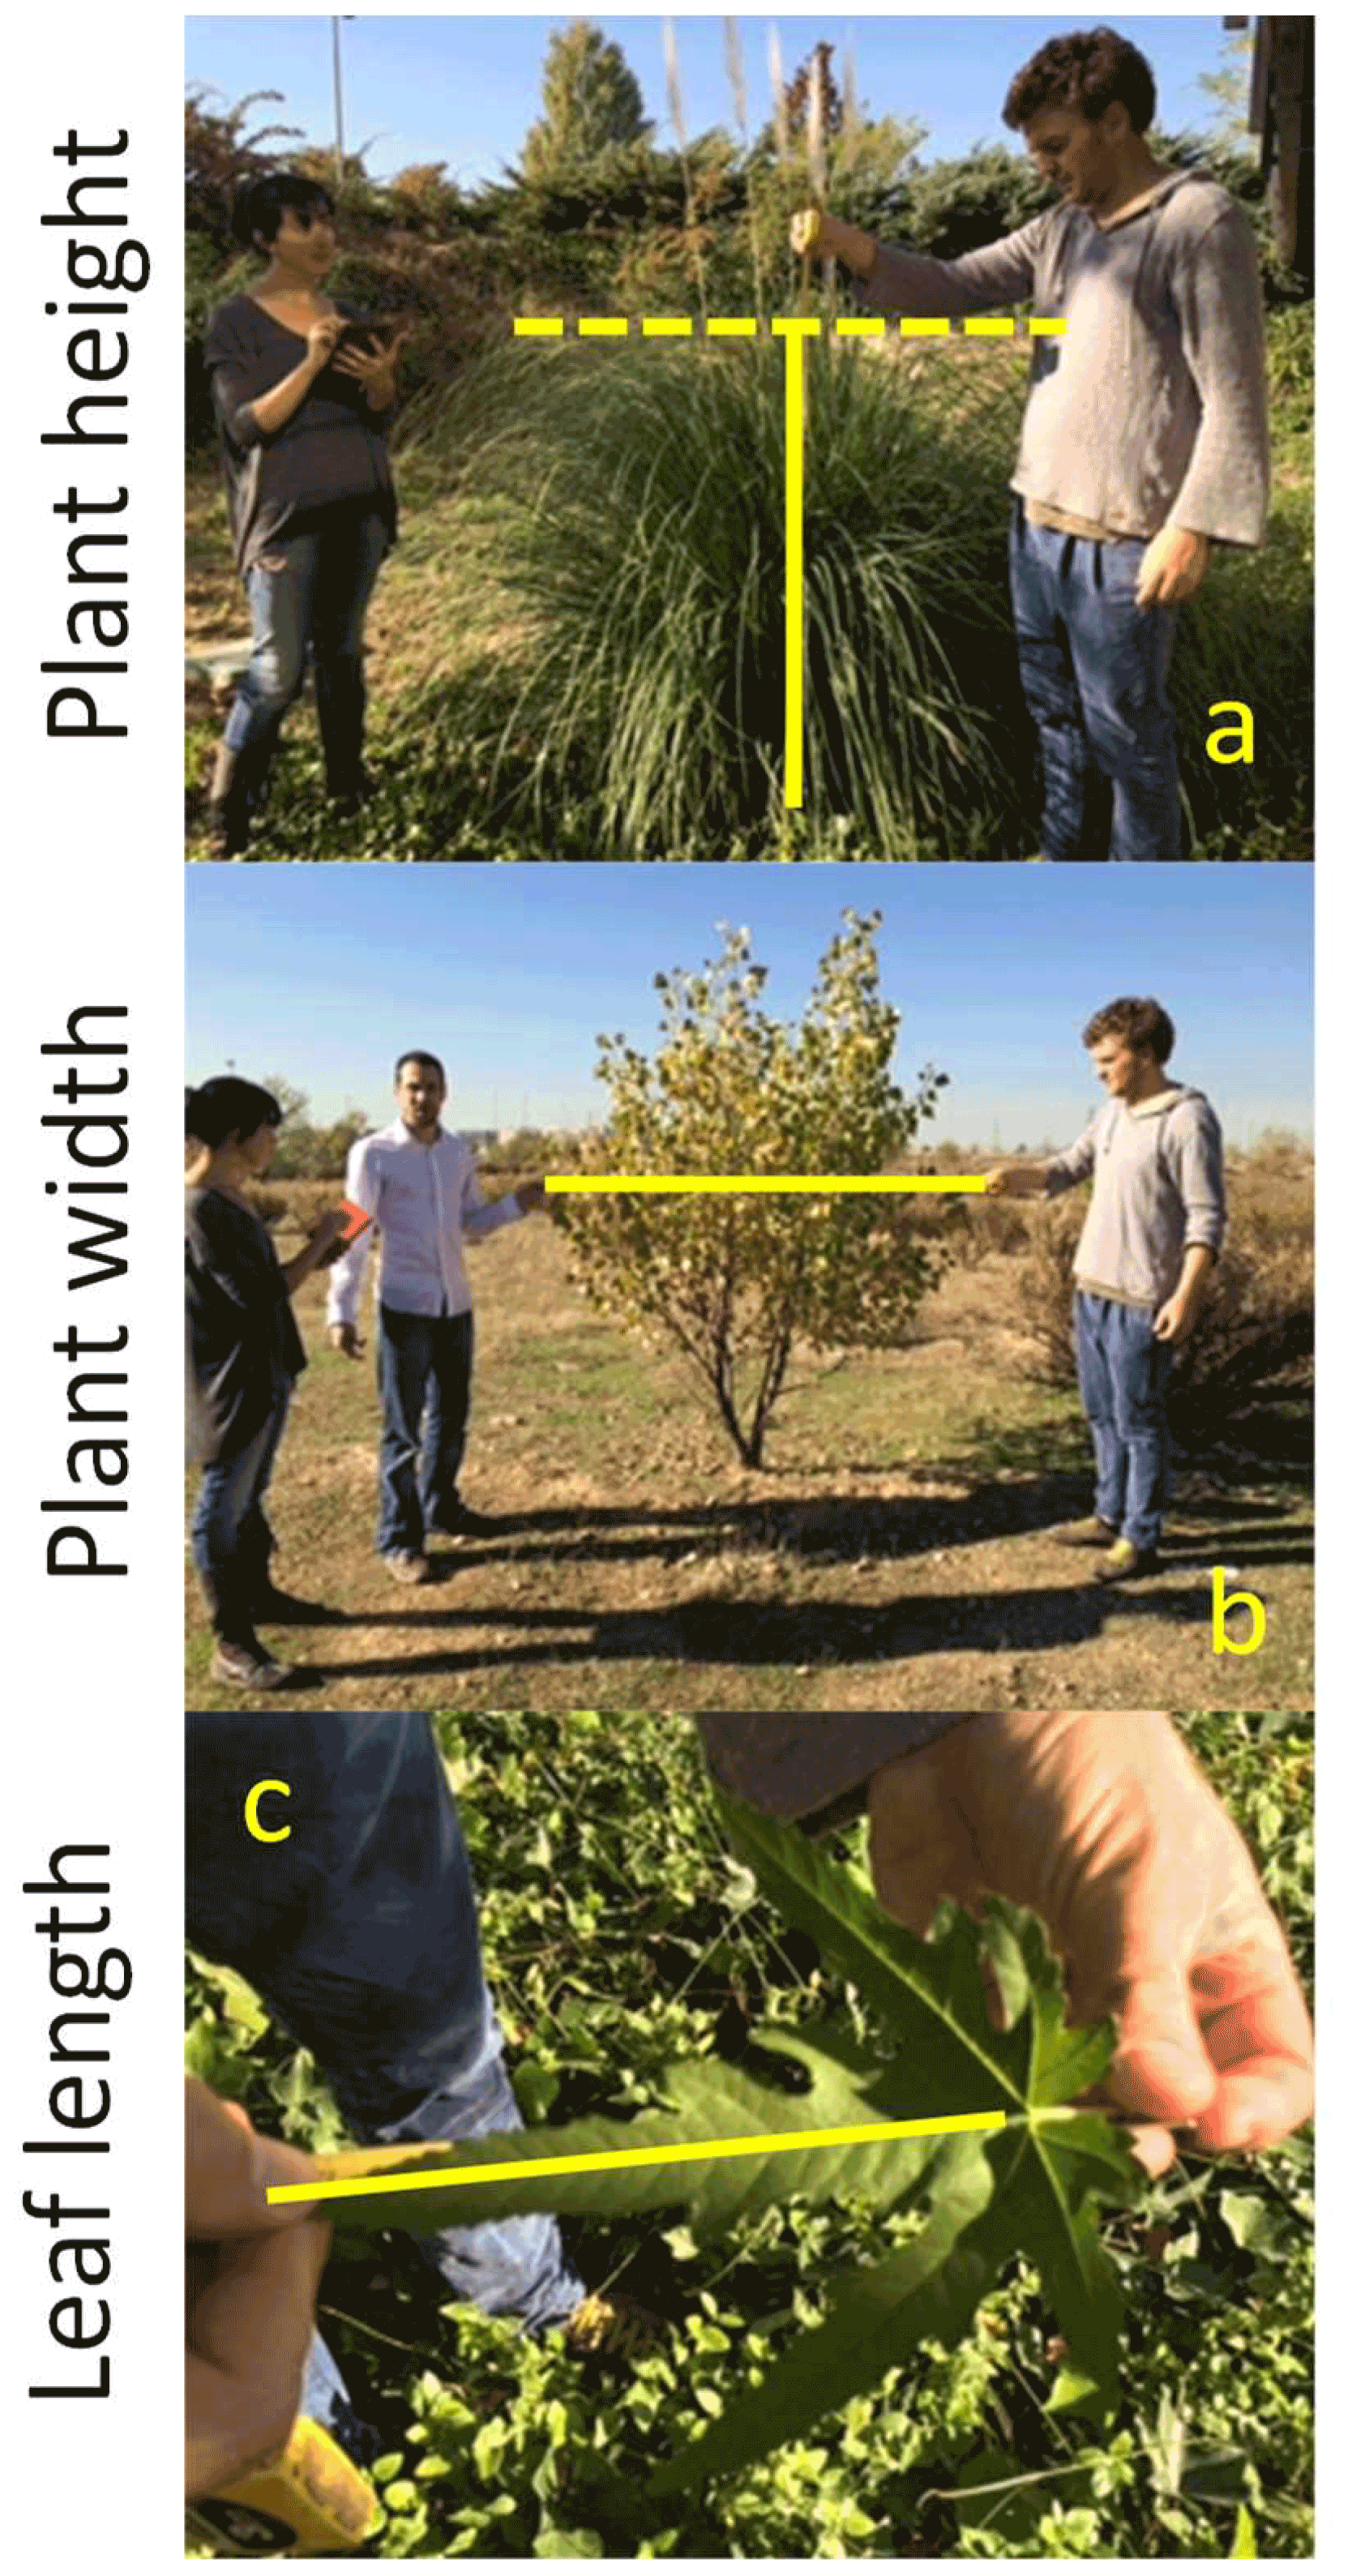
Figure 11Measuring plant height (a), plant width (b) and leaf length (c) in the field. Photographs by Miguel Berdugo.
Once plant and leaf size measurements were completed, leaves of the selected individuals were harvested and taken to the lab for subsequent leaf trait measurements. We sampled and stored leaves for trait measurements following these guidelines:
-
We only measured the last mature (i.e., well-developed) leaves at the top of each individual to avoid shaded leaves. For perennial plants with evergreen leaves, we avoided measuring old leaves from past growing seasons. We also avoided damaged leaves, such as those that showed signs of herbivory, senescent leaves, or leaves with the presence of fungi or other pathogens/parasites.
-
For plants with large leaves, we harvested at least two leaves per individual. For small leaves, we sampled enough leaves to obtain > 4 cm2 of leaf area (when possible). Leaves were cut at the base of the limb (removing petiole when present).
-
Once harvested, leaves were placed in a wet paper towel and stored in a tagged plastic Ziploc bag with a little water to prevent dehydration. These plastic bags were stored in a cooling box for transportation to the lab. We used only one zip bag per sampled individual and tagged the bag with the name of the site, transect and quadrat number, as well as with the genus and species name. Once in the lab, the plastic bags and leaves were stored in a refrigerator in the dark before analyses and, ideally, processed within 48 h of sampling.
Measuring leaf area, leaf dry matter content and specific leaf area
Leaf traits measured in the laboratory included leaf area (cm2), leaf dry matter content (dry mass: fresh mass g g−1) and specific leaf area (cm2 g−1). Measurements were performed on all sampled individuals separately.
We first measured leaf fresh mass (mg). To do this we carefully removed excess of water from the leaves with a dry paper towel and weighed all the leaves of a given sampled individual using a precision balance. This gave us a measure of fresh leaf mass. It is critical that any excess water is removed before measuring fresh weight.
After measuring fresh mass, all the leaves of the sampled individuals were placed onto a sheet of white paper, avoiding any leaf overlap, and both a 5 cm × 5 cm scale piece of graph paper (international unit scale, cm) and a species tag were added. A sheet of glass was then placed over the leaves to flatten them out, and a photograph was taken (see example in Fig. 12). Leaf area was then quantified using the freeware ImageJ (Schneider et al., 2012). Once the picture was taken, we put all the measured leaves of the sample individual into a paper bag for leaf dry mass measurement and oven-dried them for 48 h at 60 ∘C. Dried leaves were weighed and returned to their paper bags. All leaf samples were then shipped (following current national and international regulations and with the proper import/export permits) to the Dryland Ecology and Global Change Laboratory in Spain, where they were stored in a dry place and kept for further laboratory analyses.
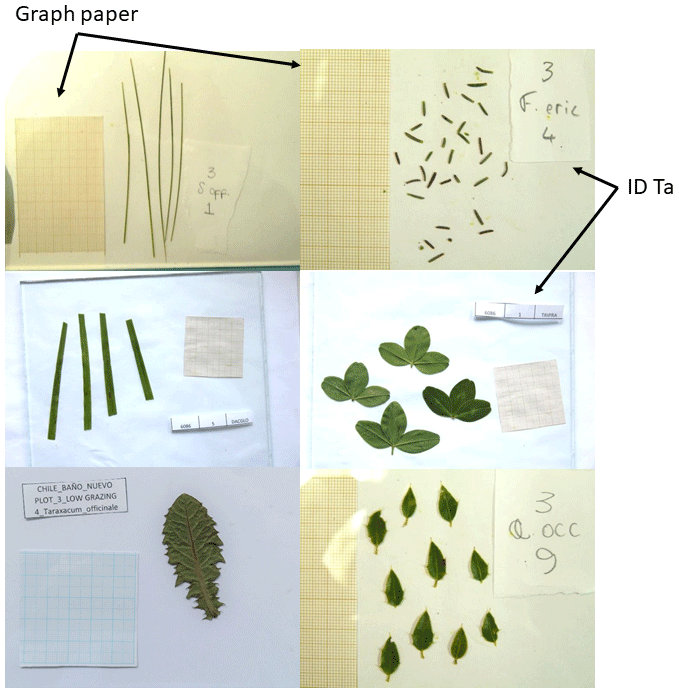
Figure 12Examples of pictures taken for leaf area measurements. Photographs by Nicolas Gross.
2.2.5 Facilitation survey
This survey was set up to obtain a proxy of the magnitude and direction of biotic interactions among vascular plants using an observational and comparable approach (for examples on the use of this type of data, see Soliveres et al., 2014; Xu et al., 2015; Berdugo et al., 2017, 2019). We first randomly selected 25 discrete perennial plant patches (“nurse plants” sensu Soliveres et al., 2014) for each of the dominant species within each plot. This resulted in 75, 50 or 25 plants per plot if there were three, two or one dominant species, respectively (Fig. 13a). If a given plot did not contain 25 patches of each dominant species, all available patches from the dominant species were surveyed until at least 25 patches in total were selected. We evaluated the cover (and number of individuals, whenever possible) of all perennial species growing beneath each nurse plant. To obtain comparable samples of species richness and abundance in surrounding open areas, the shape and area of each sampled nurse plant were delineated using wire rings. The rings were randomly placed in open areas away from each sampled nurse, and the cover of every perennial species identified within each ring was assessed (and the number of individuals counted when possible). The rings in open areas were located at least one patch radius away from the edge of the nurse plant (Fig. 13a).
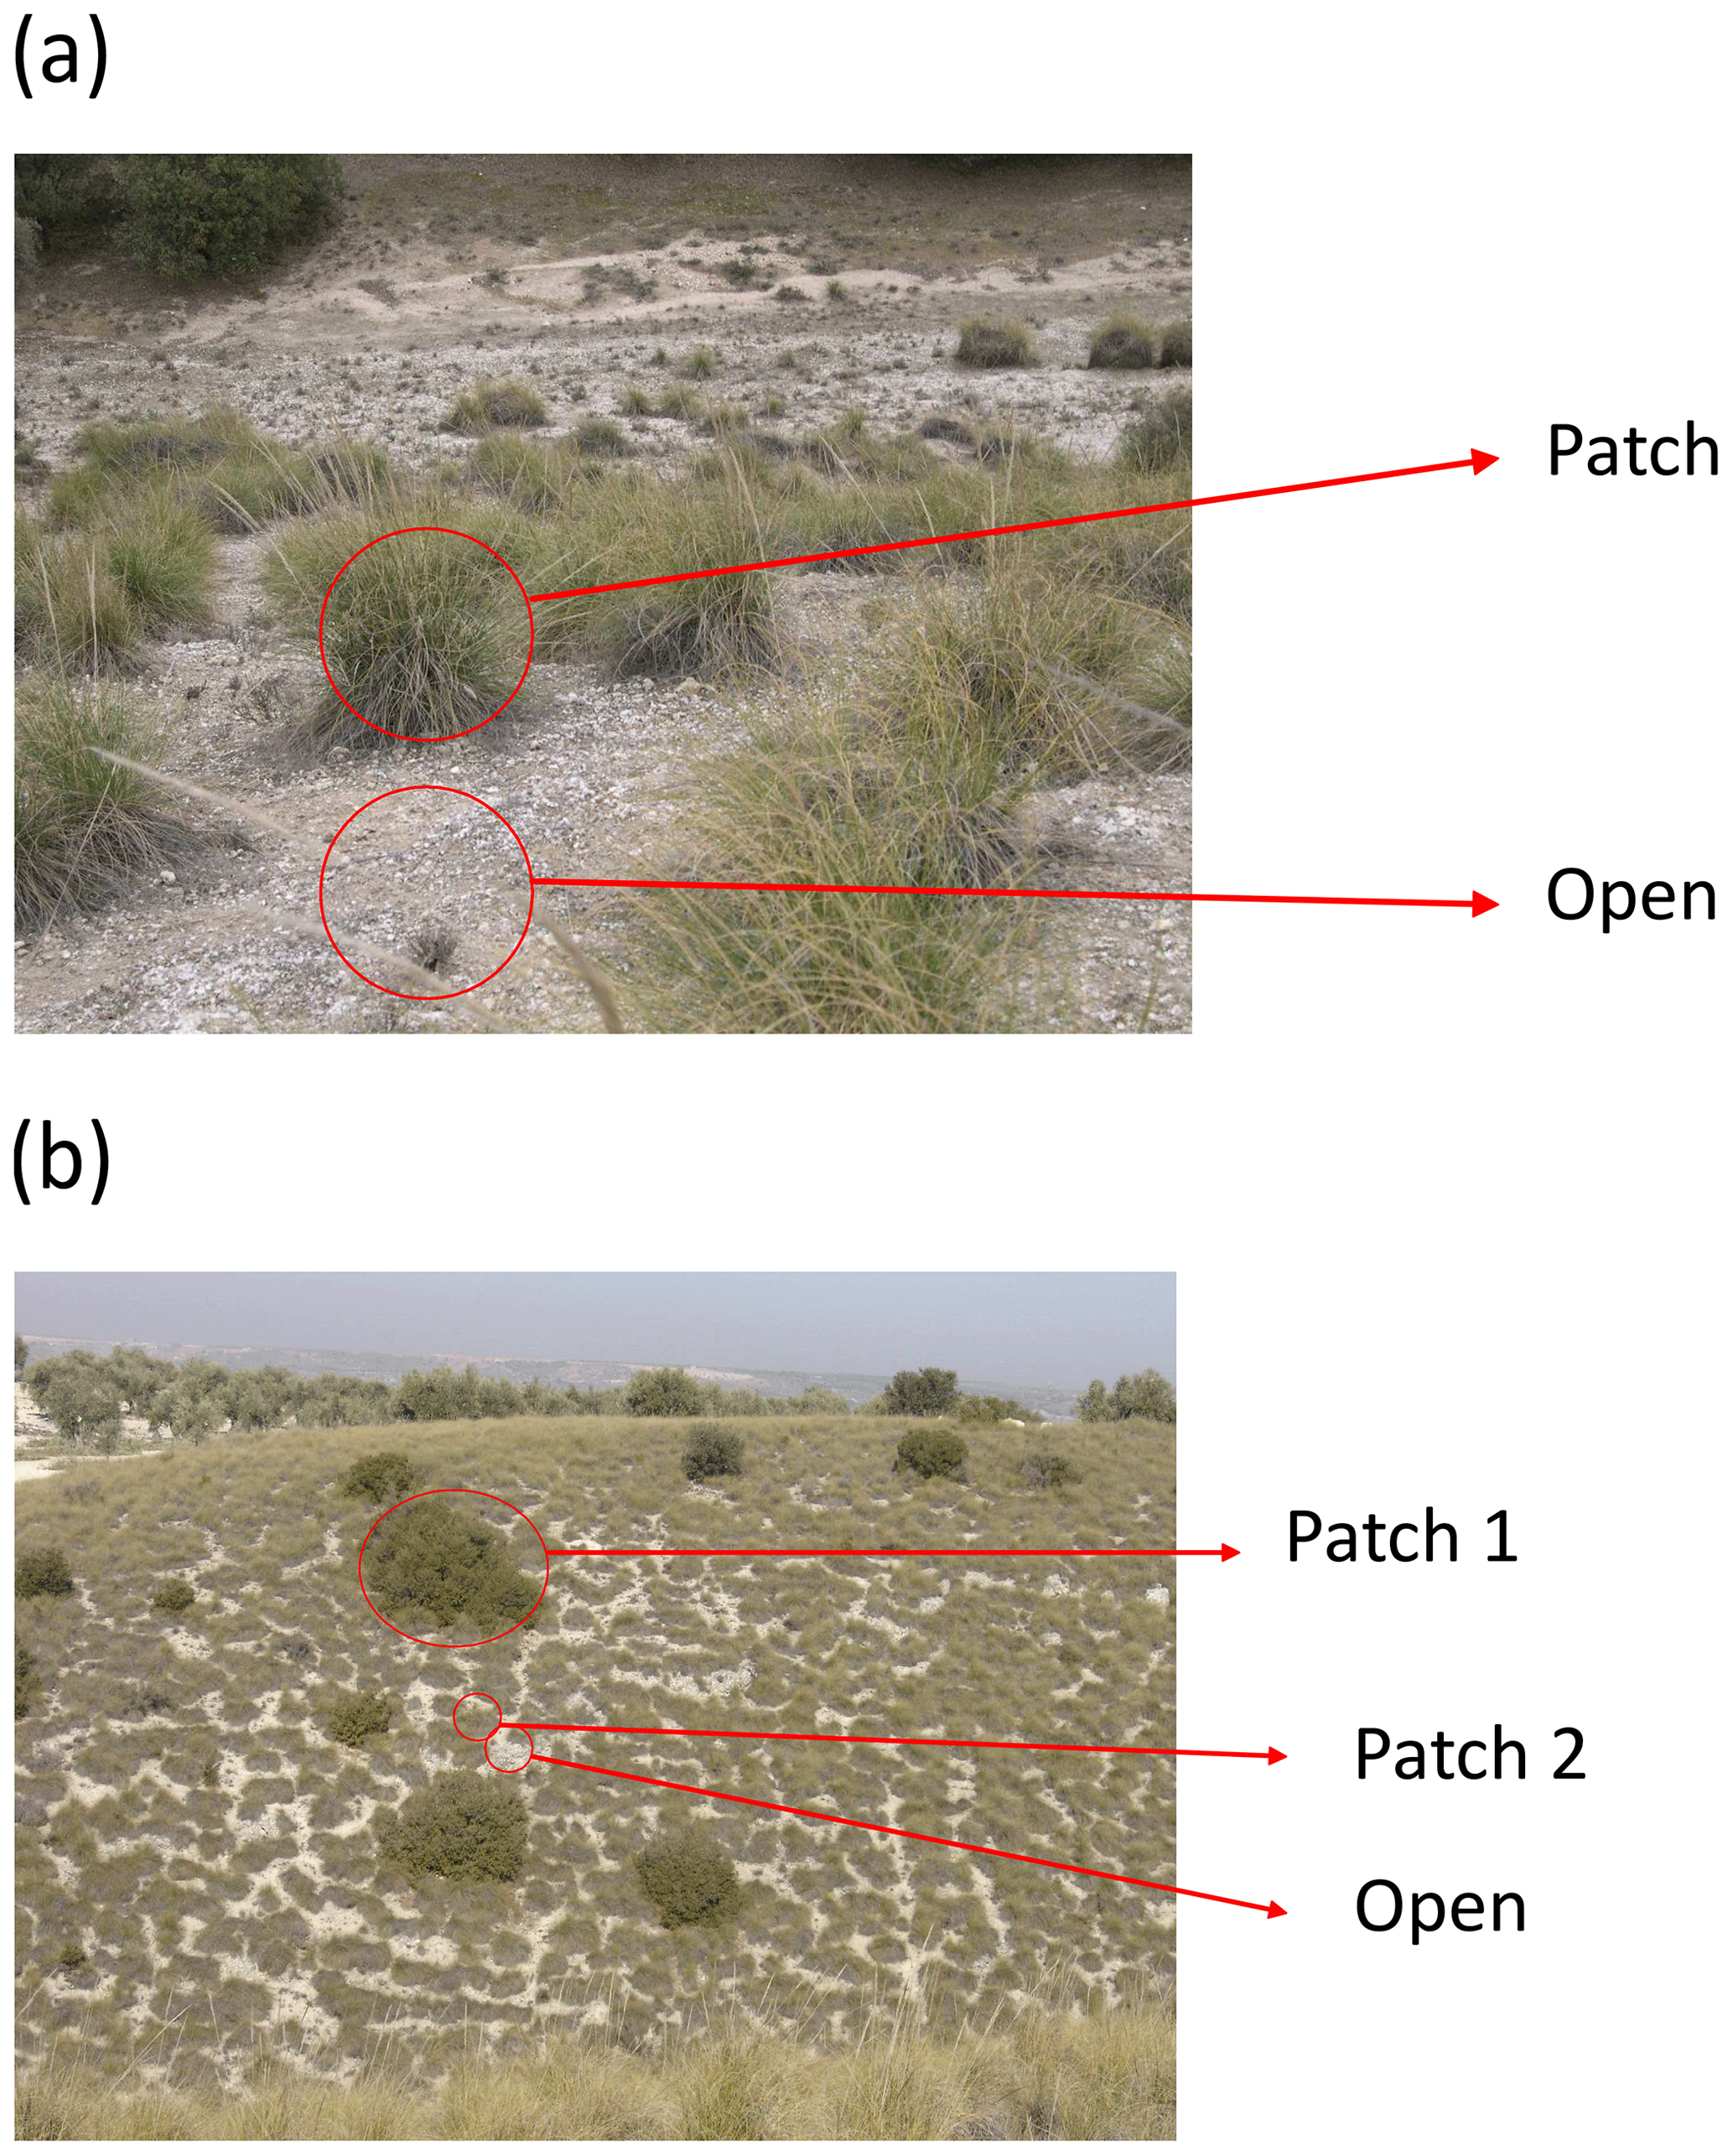
Figure 13Example of layout of sampling areas in a plant patch and in an adjacent bare ground area (“Open”) (a) and in areas with different types of plant patches and in an adjacent bare ground area (b). Photographs by Fernando T. Maestre.
Sometimes we found a situation like that presented in Fig. 13b, in which one of the nurse species formed large patches, and it was not possible to find an adjacent and continuous open area of the same size. In this case, we surveyed quadrats/rings located in adjacent open areas until an area of the same size of the nurse plant was surveyed. For instance, if the nurse plant of Fig. 13b labeled as “Patch 1” had an area of 10 m2, we would sample forty 50 cm × 50 cm quadrats placed in adjacent open areas. When less than 25 individuals of the (co-)dominant nurse species were found, we surveyed all of them and the equivalent area in open areas as described above.
2.3 Grazing pressure and characteristics survey
While we used the distance from water points as a surrogate of grazing pressure, we also conducted in situ assessments of recent and historical grazing pressure to verify the presence of a grazing gradient at each site and to obtain alternative estimates of grazing pressure, which were used to test the suitability of the BIODESERT sampling design (see Maestre et al., 2022, for a validation of grazing pressure estimates).
2.3.1 Measuring recent grazing pressure using dung/pellet counts and mass
To assess recent grazing pressure, we identified and counted the dung or pellets of all herbivores, an approach widely used to estimate the abundance of wild herbivores and livestock, including cattle, sheep, deer, kangaroos and other large mammalian herbivores such as giraffes, across terrestrial ecosystems (Plumptre and Harris, 1995; Piana and Marsden, 2014; Bisigato and Bertiller, 1997; Marques et al., 2001; Miyashita et al., 2008; Johnson and Jarman, 1987). Within each 45 m transect surveyed, we placed two 25 m2 (5 m × 5 m; if the plot was grazed by large herbivores such as cattle, buffalo or horses) or 1 m2 (1 m × 1 m; if the plot was grazed by small herbivores such as goats and sheep) quadrats at 10 m and 30 m along the transect length (eight quadrats per site, Fig. 4c). We counted the dung or pellets of all herbivores (cattle, sheep, goat, kangaroo, rabbit, antelope, zebra, elephant, etc.) within these quadrats and identified the animal responsible for the dung or pellets. To identify the source of dung/pellets, we used available field guides to identify dung in different regions (e.g., antelope spp. in Africa, Hesse, 1954, or different herbivores in Australia, Triggs, 2004). It was not possible, however, to separate in all cases the identity of the dung of sheep and goats (except where they occurred separately) largely because of the high degree of overlap in their morphological features (Landsberg et al., 1994).
At each plot, we calculated dung/pellet mass using either direct measurements or estimates using dung/pellet counts. In some plots we collected, dried and weighed all dung (or pellets) found in the quadrats and expressed it as a mass per square meter for each plot and herbivore type. This was typically done where dung mass was low or where the main herbivores did not produce clearly defined pellets (such as horses, cattle, donkeys, giraffe, elephants, buffalo, camels, hartebeest, wildebeest and zebra). Alternatively, we counted dung and pellets of each herbivore in all quadrats but collected it from four large (25 m2) or small (1 m2) quadrats (depending on herbivore type) to derive relationships between dung counts and dung mass for separate herbivore types. This estimation technique is highly effective for those herbivores that produce pellets (e.g., goats, sheep, deer, rabbits, hares or various antelope species). Typical relationships between dung/pellet counts and mass varied between herbivore types and site but were typically strong (see examples in Maestre et al., 2022). Thus, using either direct assessment of dung mass or estimated measures, we were able to calculate the total oven-dried mass of dung per hectare for each herbivore as one measure of recent grazing pressure.
2.3.2 Measuring historic grazing pressure
We quantified the size and density of livestock tracks (semipermanent landscape features that are formed when livestock traverse the same path to and from water; Lange, 1969) as a measure of historic grazing by livestock. These tracks are clearly visible over many decades and become wider and deeper as the intensity of livestock grazing increases. The intensity and size of livestock tracks are therefore a useful indicator of the history of livestock grazing (Pringle and Landsberg, 2004; Val et al., 2018). To assess the level of historic grazing pressure, we measured in all plots the width and depth of all livestock tracks crossing each of the 45 m transects to derive a total cross-sectional area of tracks for each site. As a note of caution, this technique is not very useful in sandy soils where tracks tend not to form or are not sustained over time. Thus, at those plots with sandy soils we validated grazing intensity with the previous methods.
2.4 Soil survey
Soil sampling was conducted in all the plots surveyed for vegetation during the dry season (summer). The soils were dry at the time of sampling, and no rain occurred in the surveyed plots at least 15 d prior to the soil survey. This survey was conducted following a stratified random sampling according to the following protocol and guidelines.
When only a dominant perennial plant species was present in a plot, five sampling points were randomly placed in open areas devoid of perennial vascular plants (cover < 5 % of the total surface; open microsite hereafter), and another five were placed under the canopy of five randomly selected individuals of the dominant plant (one sampling point per individual, plant microsite hereafter; Fig. 14). In shrub/tree-dominated areas, sampling in plant microsites was conducted under the canopy of the shrub/tree species at distances < 15 cm from the main stem/trunk of the shrub/tree.

Figure 14Examples of placement of sampling points in open (blue) and vegetated (green) microsites in different dryland vegetation types (in the examples shown there are no biocrusts). Please note that the location of the sampling points in the pictures is made for illustration purposes only and are not located at a proper scale. A minimum separation distance between samples and between open and vegetated microsites should be established (see the main text for details). Photograph credits: Juan Gaitán, Eduardo Pucheta, David Eldridge and Mohamad Mjanku.
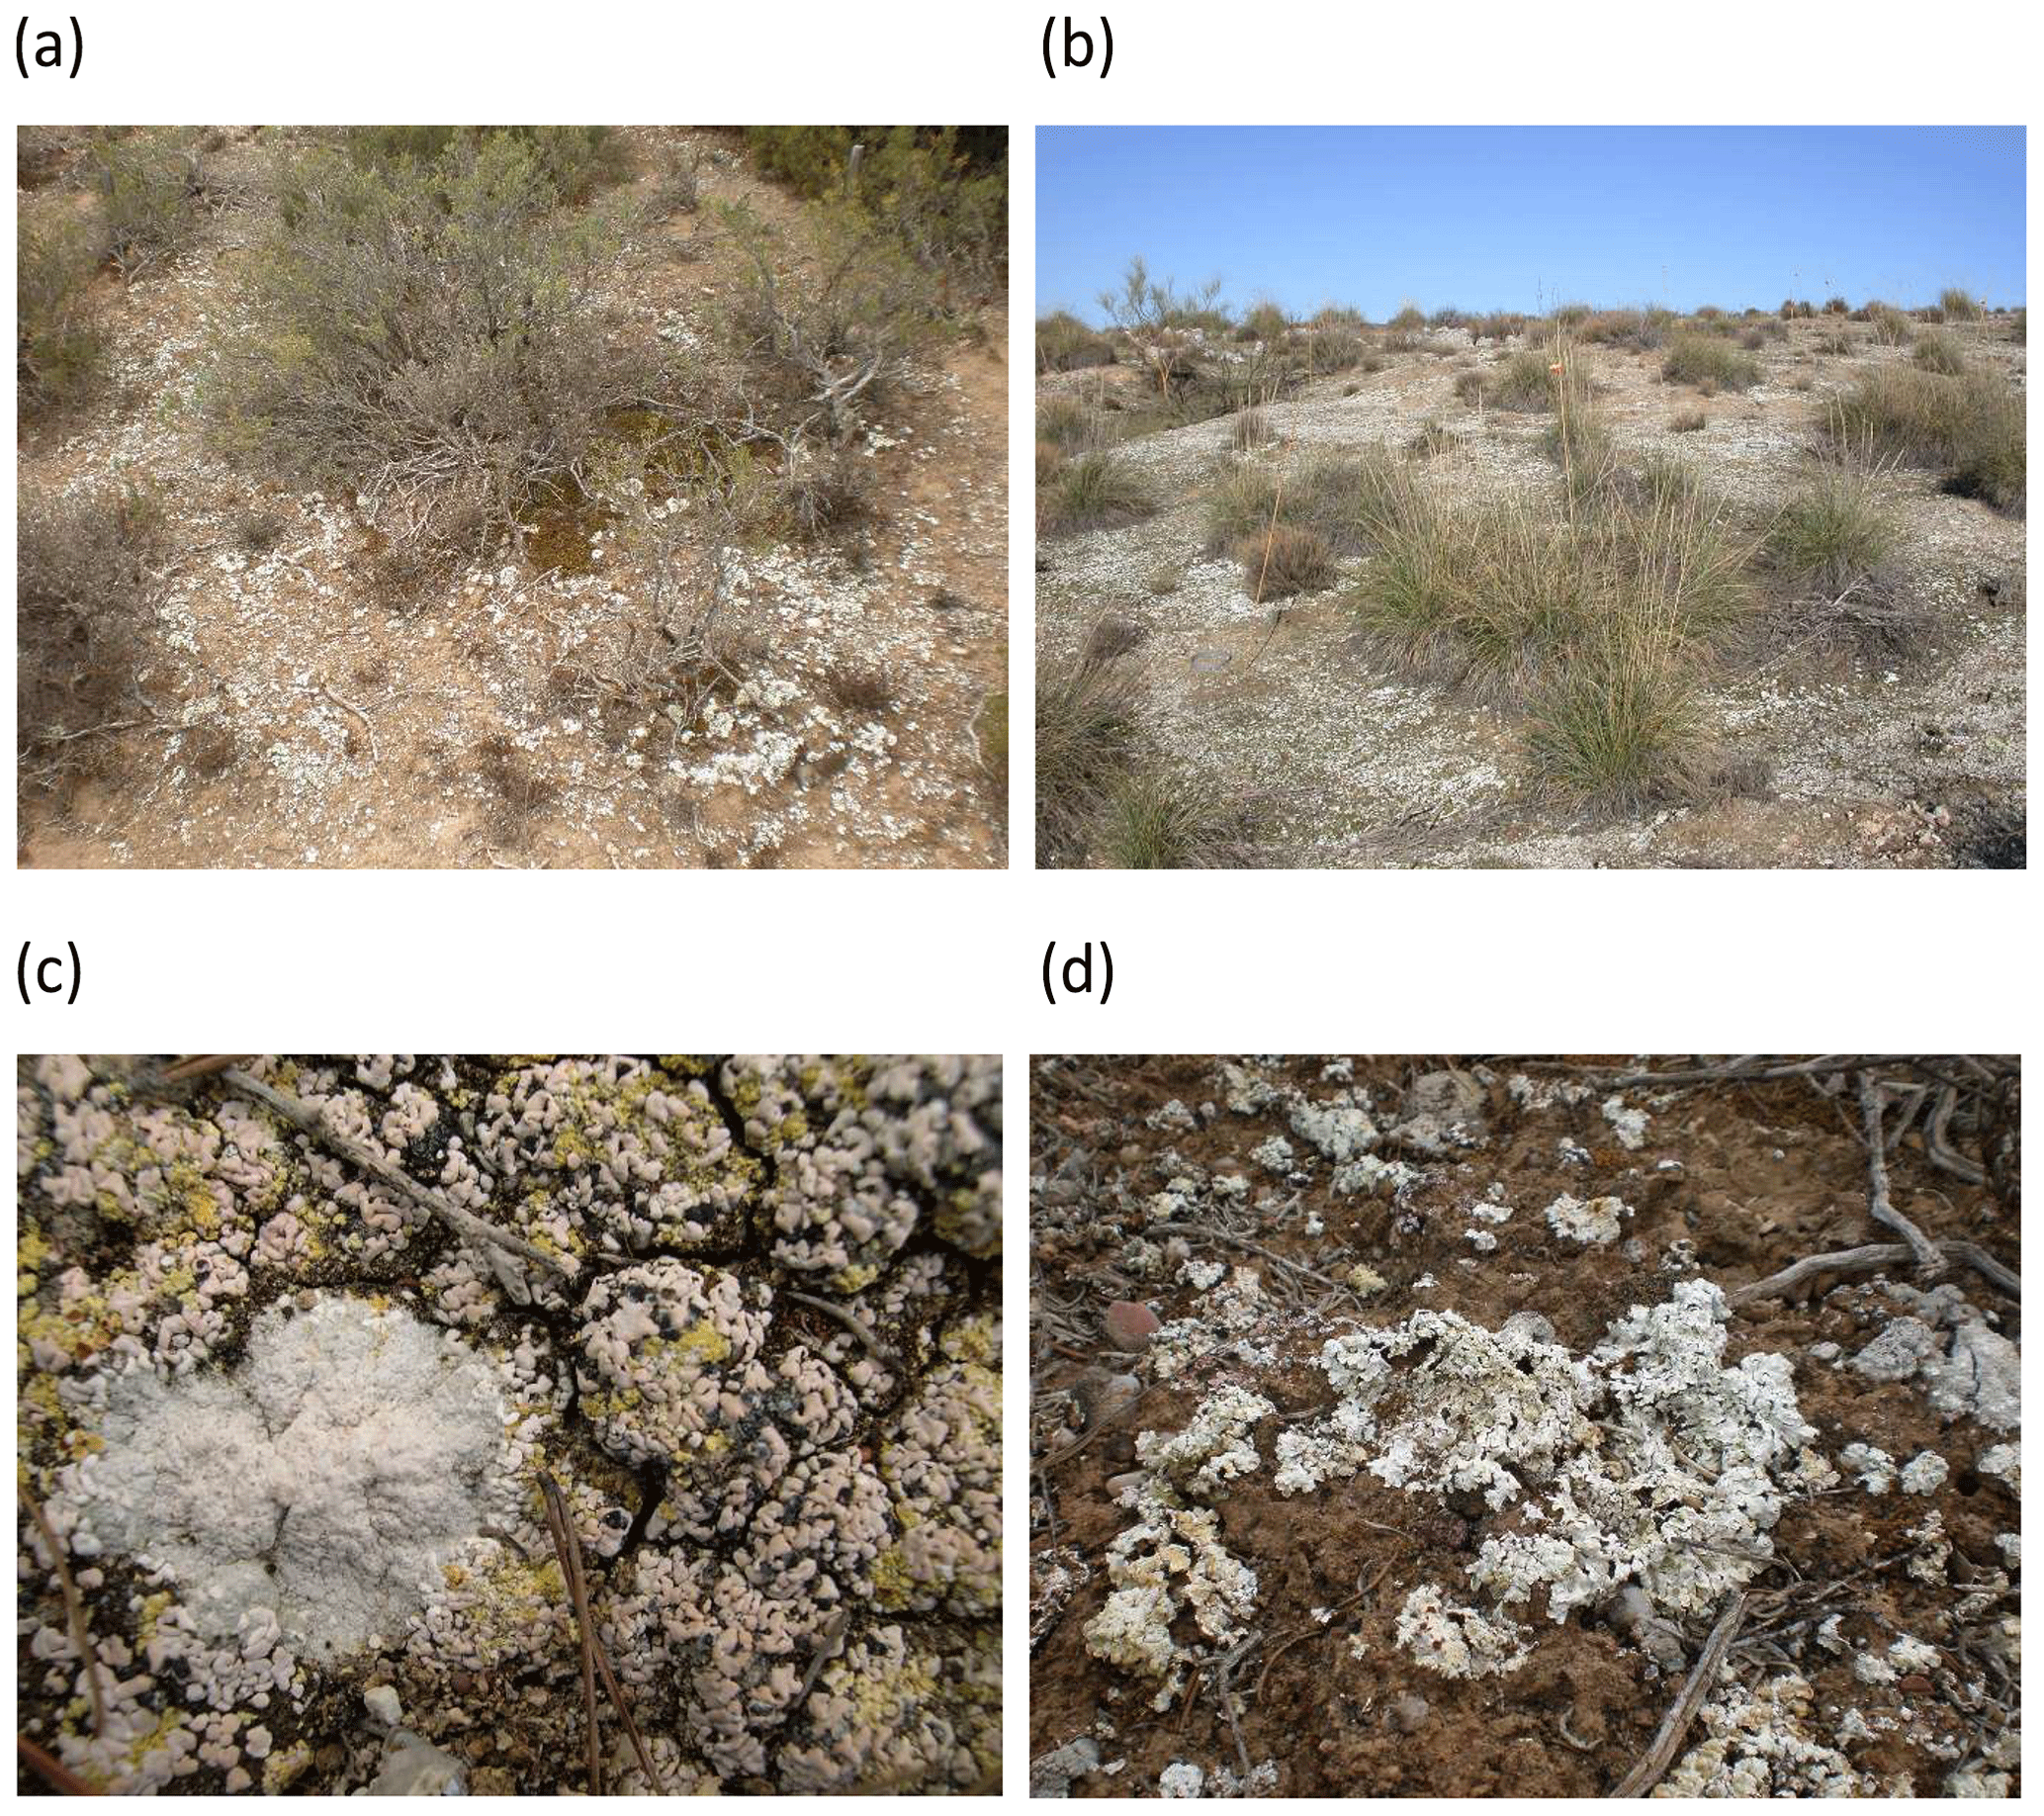
Figure 15Examples of semi-arid shrublands (a) and steppes (b), showing the dominance of biocrusts in plant interspaces. Close-up views of biocrust communities dominated by lichens are shown in (c) and (d), respectively. Photographs by Fernando T. Maestre.
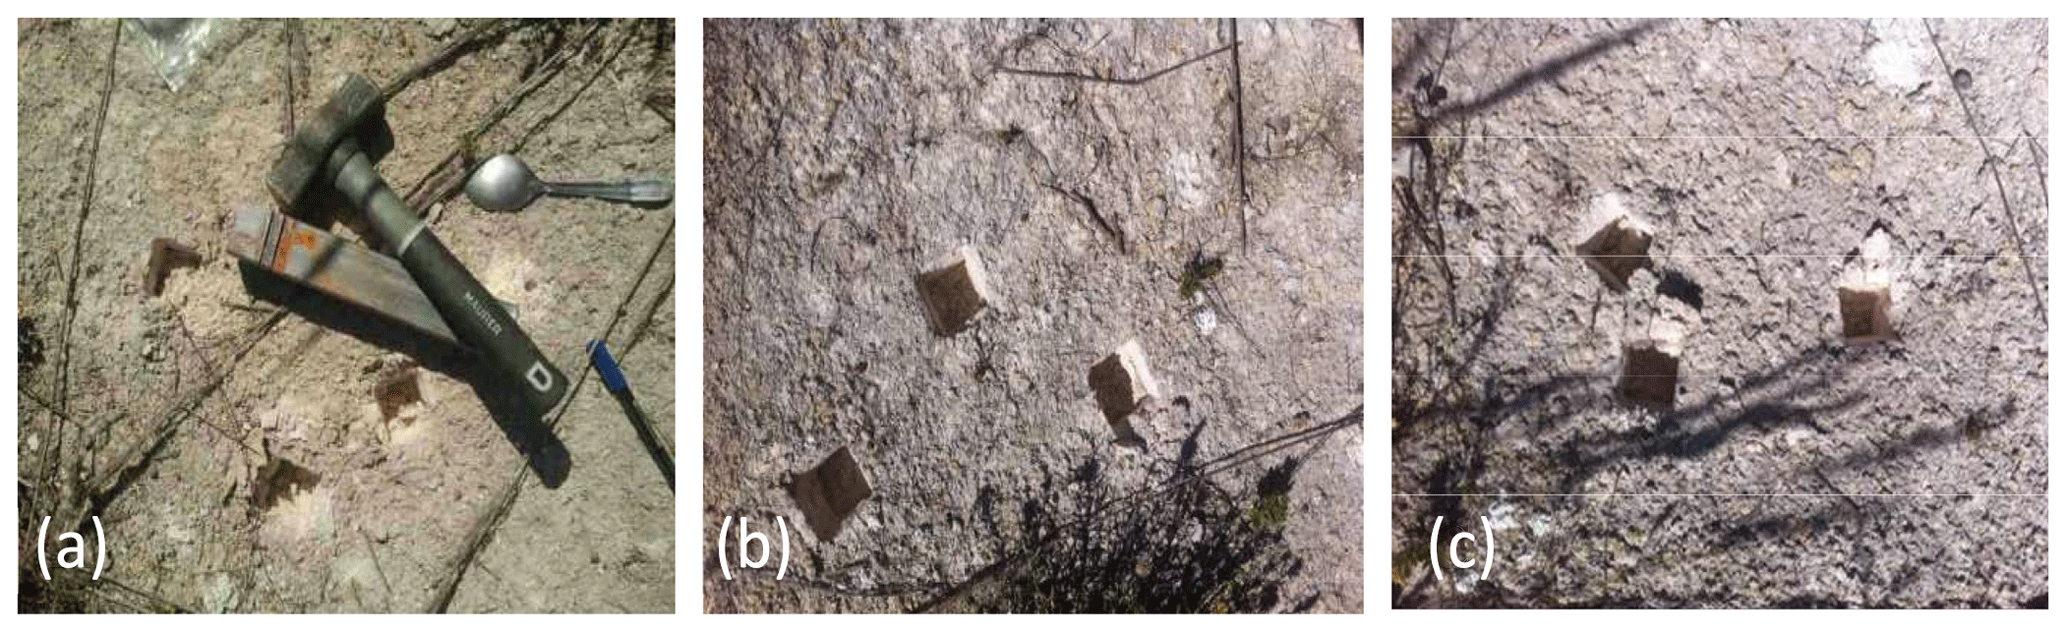
Figure 16(a) Corer and hammer used to get the soil samples. (b, c) Examples of replicated samples collected in bare ground areas in the field (please note that only three cores are collected in the pictures shown here). Photographs by Victoria Ochoa.
-
When more than one dominant species was present (e.g., as in Fig. 13), sampling at plant microsites was conducted in five randomly selected individuals of the dominant species (one sampling point per individual), recording the species under which each sample was collected.
-
When biocrusts were present (Figs. 9 and 15), five additional sampling points were placed in each biocrust-dominated area (biocrust microsite hereafter). Before collecting the soils from biocrust microsites, a 20 cm × 20 cm quadrat was placed in the area where the soils were collected, and a photograph was taken with a digital camera with a spatial reference (a coin, a pen). This allowed us to identify the type of biocrust present at the plot. Whenever possible, the biocrust species was also identified.
-
Each sampling point was separated by at least 3 m to avoid spatial dependency. Sampling points in open and biocrust microsites were also separated from the nearest plant patch by at least 1 m. When this was not possible due to the small-scale pattern of vegetation, samples were taken beyond the influence of the nearest plant canopy (at least one patch radius away from the edge of the nearest perennial plant patch).
-
A composite sample obtained from four soil cores (0–7.5 cm depth; Fig. 16) was collected at each sampling point, bulked and homogenized in the field (∼ 600 g of soil per sampling point was obtained). A total of 10–15 samples per plot were collected (10 when biocrust microsites were absent, 15 when they were present).
All soil samples were stored upon field collection in properly labeled Ziploc-type plastic bags (one sample per bag). In the case of samples from plant and biocrust microsites, the name of the plant species or biocrust type (moss, lichen, cyanobacteria, mixed; Fig. 10) was included on the bag label. During the transportation to the laboratory, the soil samples were maintained, when possible, in a cooler with ice packs.
Once in the laboratory, soil samples were sieved (2 mm mesh) and air-dried at room temperature for 1 month. In samples obtained from biocrust microsites, visible biocrust constituents (e.g., lichens and mosses) were carefully removed with a knife (avoiding losing soil) before air-drying the samples. After sieving but before air-drying the samples, 40 g of sieved (2 mm mesh) soil of each sample was introduced in a plastic bag, labeled properly and frozen at −20 ∘C for microbiological analyses; the use of frozen samples is the most used and accepted storage method for soil microbial communities (Lauber et al., 2010). In some sites it was logistically impossible to freeze the samples immediately following field collection.
Additional sampling was conducted to measure soil bulk density at every site. Bulk density is the weight of soil for a given volume, and it is used as a measure of soil compaction and to estimate nutrient stocks. Bulk density was measured at each plot following the cylindrical core method (Arshad et al., 1996). Volumetric soil cores were collected to 7.5 cm depth with a cylindrical corer to calculate soil bulk density (the mass of soil for a given volume, Mg m−3 or g cc−1). Three samples were collected in randomly selected open and plant microsites as bulk (Throop et al., 2012). Samples were dried at 60 ∘C for 48 h (gypsum soils) or 100 ∘C for 24 h (all other soils).
Thus, for each plot we obtained three sets of samples:
-
Set 1. Replicated samples of each microsite (open/plant/biocrust microsites, 10–15 samples per site) were air-dried at room temperature for a month. These samples will be used for physico-chemical analyses.
-
Set 2. Replicated samples of each microsite (open/plant/biocrust microsites, 10–15 samples per site) were frozen at −20 ∘C. These samples will be used for microbiological analyses.
-
Set 3. This set includes samples for bulk density measurements (open/plant microsites, six samples per site).
All dried and frozen samples were shipped (following current national and international regulations and with the proper import/export permits) to the Dryland Ecology and Global Change Laboratory in Spain, where they were either analyzed or distributed to other laboratories.
2.5 Assessing in situ nitrogen and phosphorus availability using ion exchange membranes
Measuring soil nitrogen (N) supplies with ion exchange membranes (IEMs; Subler et al., 1995; Fig. 17) has become a popular approach for measuring in situ soil nutrient availability for plants and microbes in dryland ecosystems (e.g., Drohan et al., 2005; Castillo-Monroy et al., 2010; Durán et al., 2013, Delgado-Baquerizo et al., 2014). IEMs exhibit surface characteristics and nutrient uptake phenomena that simulate a plant root surface (Drohan et al., 2005). Unlike traditional measurements, results obtained by resins integrate nutrient diffusion capacity in soil, and studies have shown that ion concentrations in resin extracts correlate to the plant uptake of such ions (Qian and Schoenau, 2007). Overall, IEMs provide a reliable method to estimate inorganic N and P production in soils (Subler et al., 1995) and are a good alternative to more destructive and time-consuming traditional methods for estimating soil inorganic N and phosphorus (P) availability (Durán et al., 2013).
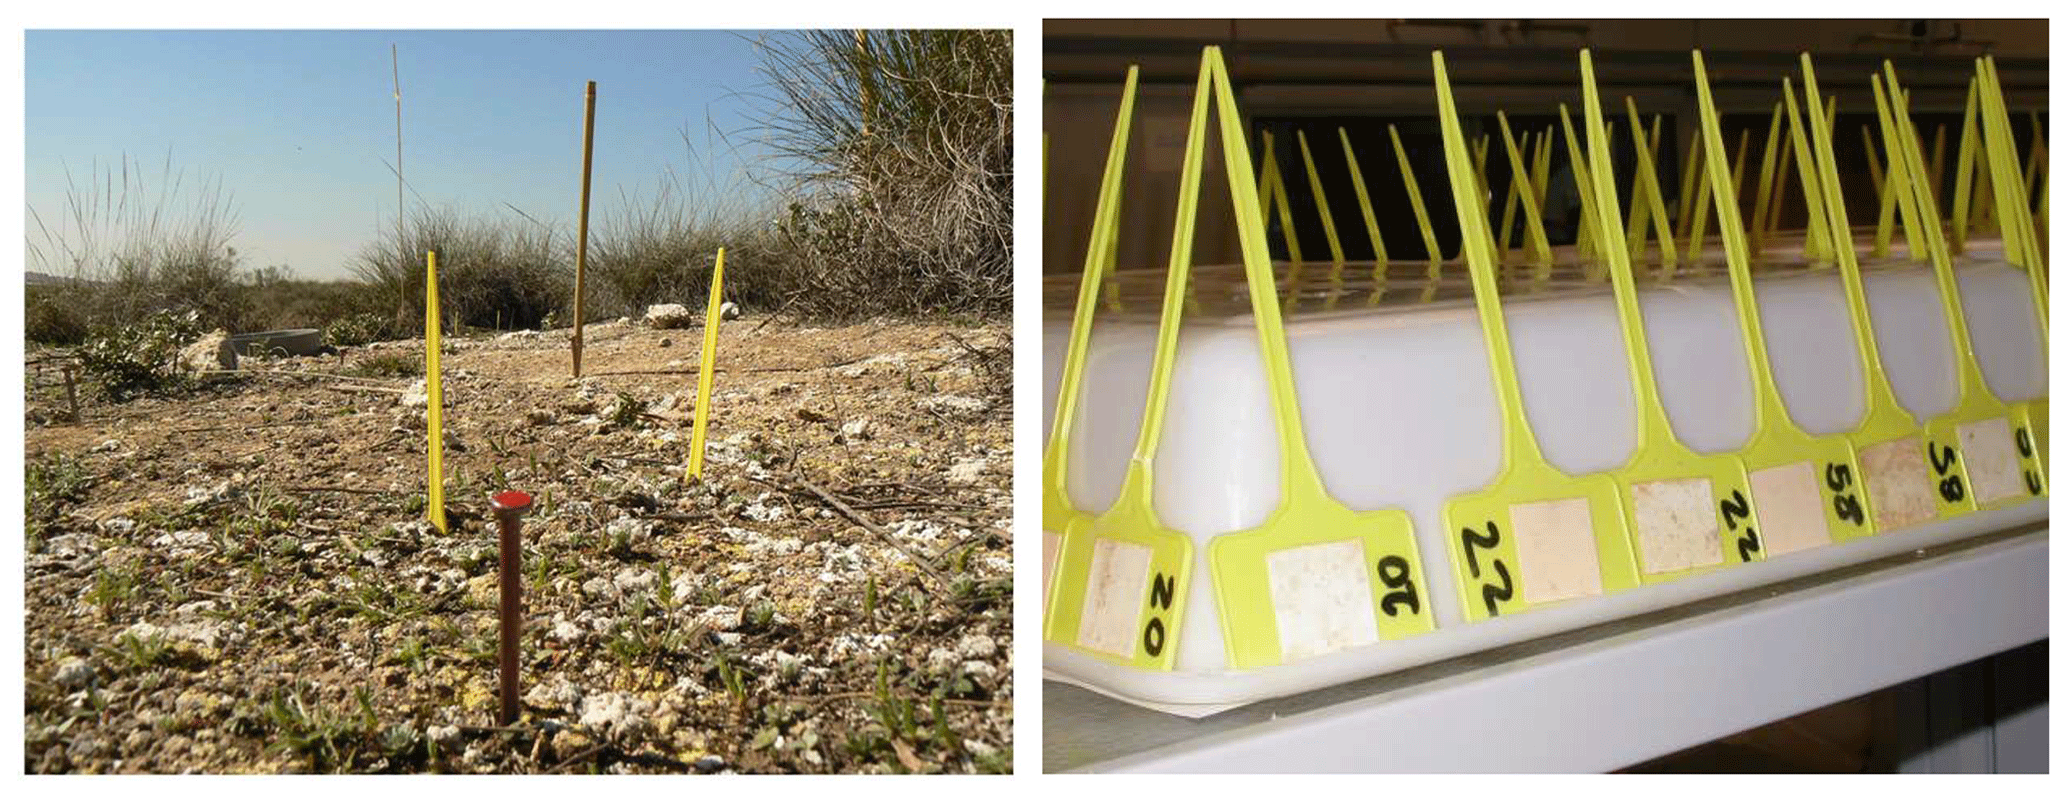
Figure 17View of ion exchange membranes placed in the field on the left and after field collection on the right. Photographs by Andrea P. Castillo-Monroy.
We conducted an IEM survey following a stratified random sampling according to the same guidelines described in Sect. 2.4 for soil sampling. At each sampling point, this survey was conducted as follows:
-
One anion and cation IEM (types AMI-7001S and CMI-7000S, Membranes International Inc, Ringwoods, NJ) was carefully inserted 5 cm into the soil using a small spatula or knife to limit soil disturbance. Within each sampling point, IEMs were located 10 cm apart (Fig. 17). Once installed in the field, the location of the IEMs was recorded with a GPS and marked with a metal stick/tag to avoid loss of membranes during the retrieval phase following incubation.
-
IEMs were incubated in the field for 4 weeks. This incubation was done during the main rainy season.
-
After the incubation period, IEMs were carefully removed from the soil using a knife or a small shovel, taken to the laboratory and dried at ambient temperature for 2 weeks.
-
Once dried, the IEMs were carefully brushed to remove soil particles, placed into separate plastic bags, and shipped to the Dryland Ecology and Global Change Laboratory for analyses.
2.6 Quantification of biological activity using the tea bag index
We quantified biological activity in situ using the tea bag index technique (Keuskamp et al., 2013). This measurement gives us insights into potential leaf litter decomposition at each site and complements the information obtained from the soil sampling and IEMs described in Sect. 2.4 and 2.5. This survey was conducted using commercial tea bags from Lipton (Lipton Green tea, EAN 87 22700 05552 5, and Rooibos tea, EAN 87 22700 18843 8) and were provided to all the participating groups by the Dryland Ecology and Global Change Laboratory, so the same material was used across all the plots where these measurements were conducted.
This part of the survey was conducted following the same stratified random sampling detailed for the soil and IEM surveys (five sampling points in each of bare, plant and biocrust microsites; the same sampling points were used for deploying IEMs and tea bags). At each sampling point, this survey was conducted during the main rainy season following this protocol:
-
The initial weight of the tea bag was measured (0.000 g).
-
The bag plus string weight without content (∼ 0.2 g) and the label (∼ 0.09 g) were measured in three tea bags.
-
Two Lipton tetrahedral bags (one of green tea, the other of rooibos) were properly marked and buried in an 8 cm deep hole, which was filled with soil while keeping the plastic label visible above the soil surface.
-
Once installed in the field, the location of the tea bags was recorded with a GPS and/or marked with a metal stick/tag, to avoid loss of membranes during the retrieval phase following incubation.
-
Tea bags were retrieved after incubating them for 90 d and placed in paper bags properly labeled until lab processing.
-
In the lab, soil particles adhering to the tea bags were carefully removed.
-
The whole tea bags were dried in an oven at 70 ∘C for 48 h and weighed (0.000 g).
-
Dried tea bags were placed in a Ziploc bag, labeled and shipped to the Dryland Ecology and Global Change Laboratory in Spain.
The BIODESERT survey has been carried out by a global and inclusive network of researchers who have agreed to implement a replicated survey following the standardized protocol described in the previous sections. All network participants have agreed to the following basic rules:
-
Fund project infrastructure and implementation at their own sites.
-
Collaborate well with other members of the team.
-
Implement the survey protocols accurately. All participating sites followed these protocols and used the available templates for data submission.
-
Openly share data associated with the project in a common repository, managed by the Dryland Ecology and Global Change Laboratory.
The BIODESERT global survey is supported by steering and publication committees. The steering committee serves to establish general guidelines for the BIODESERT survey, including protocols, data use and timelines. All the samples and data are centralized at the Dryland Ecology and Global Change Laboratory; all the data will be posted in public repositories such as figshare or Dryad upon the publication of the articles using them.
The willingness of many scientists to cooperate and collaborate is what makes BIODESERT possible. Because this network encompasses a diverse group of people from all over the globe and relies on many data contributors, writing scientific papers can be more challenging than with more traditional projects. Thus, we have attempted to lay out ground rules to establish a fair process for establishing authorship and to be inclusive while not diluting the value of the authorship of a paper. We have established a publications committee (PuC) which ensures communication across projects to avoid overlap of papers, works to provide guidance on procedures and authorship guidelines, and serves as the body of last resort for resolution of authorship disputes within the BIODESERT network. The guidelines for co-authorship of the papers arising from the BIODESERT survey are described below:
-
By contributing data to the mandatory parts of the BIODESERT survey according to data submission protocols, two members of each participating group will automatically be included as co-authors on three core papers if the group follow deadlines and rules for data submission.
-
Members from those groups contributing data to the optional parts of the survey (described in Sects. 2.2.5, 2.5 and 2.6 above) will also be co-authors on one paper arising from each part of the survey they have contributed to (two co-authors per group that has contributed data). For example, members of a group that has contributed to the tea bag experiment will be co-authors of a paper using these measurements, while members of a group contributing data to all the optional parts of the survey will be co-authors of three additional papers arising from these data (with the limit of two co-authors per group and paper).
-
In addition to the papers described above, all the researchers involved in collecting field data or data processing will be co-authors of a BIODESERT “data paper”. This paper will be a “one stop shop” including the whole, raw database gathered during the survey and will be published in an open-access format to maximize the visibility and usability of the data.
-
All the manuscripts derived from the BIODESERT survey will be revised by the co-authors before submission; before this the coordinator will contact the responsible person of each participating group, who will provide the names and affiliations of the members of his/her group who should be included as co-authors in each paper.
While members from the PuC will take the lead on the data analysis and writing of the core papers and those arising from the optional parts of the BIODESERT survey, network participants can make proposals to lead additional analyses/articles using BIODESERT data. These proposals will be sent to the coordinator (including title, abstract and potential list of co-authors when doing so), who will discuss them with the PuC. Proposed ideas are reviewed by the PuC to ensure there is sufficient distinction from proposed and ongoing/planned BIODESERT papers. The PuC may suggest altering or combining analyses and papers to resolve issues of overlap, as well as recommendations for including co-authors who could help with the data analysis and writing or who have substantially contributed to the generation of the data used in each paper. If there are no overlaps between a proposal for a new manuscript and other ongoing/planned manuscripts, the PuC will approve the proposal and will provide the lead author with the data needed to conduct the analyses. If a manuscript is proposed and subsequently abandoned for more than 10 months, the PuC reserves the right to contact other interested BIODESERT participants and discuss taking over the development of the manuscript with the original lead author.
In addition to the papers that can be obtained from the analyses of the whole network data, we also encourage papers based on a subset of network data. Authors interested in leading analyses with subsets of the data should send a proposal to the coordinator (including title, abstract and potential list of co-authors when doing so), who will discuss them with the PuC. If there are no overlaps or compromise of novelty between a proposal for a new manuscript using a subset of data and other ongoing/planned manuscripts, the PuC will approve the proposal and will provide the lead author with the data needed for conducting the analyses.
Finally, any participant is free to use the BIODESERT data obtained from his/her plots for publication purposes, presentations, courses and other non-published venues (e.g., blog posts, scientific meetings). For this, there is no need to obtain approval by the PuC, albeit data that are not those directly gathered by each group at their sites should be requested from the coordinator.
The BIODESERT survey is the first standardized field survey with a global coverage that has evaluated the impacts of grazing on ecosystem structure and functioning across the world' s drylands. The wide variety of structural and functional ecosystem attributes that have been collected permit the exploration of multiple questions and hypotheses of interest in community, ecosystem, plant and microbial ecology. The data collected in the framework of this survey, which are not presented here (they will be openly published along with subsequent articles addressing specific questions/hypotheses), provide a baseline towards assessing temporal trends in the ecosystem variables evaluated, a critical task to monitor land degradation processes and the impacts of ongoing climate change (Reynolds et al., 2007; Cherlet et al., 2018). They can also be used to validate remote sensing information using ground data (Gaitán et al., 2013; Zhao et al., 2018), and they nicely complement those provided by global statistical inventories (e.g., Robinson et al., 2014) and grazing models (e.g., Petz et al., 2014). The samples obtained also constitute an invaluable resource that can also be used for further laboratory experiments and analyses to assess specific questions of great scientific interest, such as the role of microorganisms on the resistance of soils to climate change and grazing pressure (Delgado-Baquerizo et al., 2017) or the feedbacks between climate and soil respiration (Dacal et al., 2019).
Finally, the BIODESERT survey is a good example of the power of collaborative research networks to address multiple relevant ecological questions at the global scale using much-needed field data and of the value of international collaboration to (i) generate relevant ecological knowledge for addressing some of the most pressing environmental issues and (ii) promote the work and careers of colleagues from underrepresented minorities and regions. As the Mandalorian would say, “this is the way” towards achieving a more inclusive, representative and collaborative way of doing ecological research, one that not only is relevant from the scientific and management/policy points of view but that is also socially responsible and contributes to the building of scientific capacity where it is needed the most.
The coordinates and environmental characteristics of the study sites are available from Figshare (https://doi.org/10.6084/m9.figshare.17427401, Maestre and Guirado, 2022). No other data have been used in this paper.
FTM conceived the study and designed the soil and vegetation surveys, with inputs from JJG and HS (site selection and vegetation surveys using the line-intercept method), as well as VO and BG (soil survey and ion exchange membranes). DJE designed the grazing pressure and characteristics survey. NG and YLB designed the plant functional trait survey. FTM wrote the original manuscript, and all coauthors revised it and contributed to the final manuscript.
The contact author has declared that none of the authors has any competing interests.
Publisher’s note: Copernicus Publications remains neutral with regard to jurisdictional claims in published maps and institutional affiliations.
This article is part of the special issue “Biological soil crusts”. It is not associated with a conference.
We would like to thank all the participants in the BIODESERT field survey and all its associated tasks (laboratory analyses, handling and storage of samples, maintenance of databases and sample collections, etc.) as without them this survey would have not been possible. We also thank Dolores Ruiz-Lupión of MUSHER Scientific Illustration Studio (https://www.musherstudio.com, last access: 23 December 2021) for drawing Figs. 4, 6, 7, 8 and 9.
This research has been supported by the European Research Council (ERC grant agreement no. 647038 – BIODESERT) and the Conselleria de Innovación, Universidades, Ciencia y Sociedad Digital, Generalitat Valenciana (grant no. CIDEGENT/2018/041). Nicolas Gross was supported by CAP 20-25 (16-IDEX-0001) and the AgreenSkills+ fellowship program which has received funding from the EU's Seventh Framework Programme under grant agreement no. 996 FP7-609398 (AgreenSkills+ contract). Hugo Saiz is supported by a María Zambrano fellowship funded by the Ministry of Universities and European Union Next Generation plan.
This paper was edited by Daniel Montesinos and reviewed by Chi Xu and one anonymous referee.
Adler, P. B. and Hall, S. A.: The development of forage production and utilization gradients around livestock watering points, Landscape Ecol., 20, 319–333, https://doi.org/10.1007/s10980-005-0467-1, 2005.
Arshad, M. A., Lowery, B., and Grossman, B.: Physical Tests for Monitoring Soil Quality. In: Methods for assessing soil quality, edited by:, Doran, J. W. and Jones, A. J., SSSA Spec. Publ. 49, Madison, WI, 123–141, https://doi.org/10.2136/sssaspecpub49.c7, 1996.
Asner, G. P., Elmore, A. J., Olander, L. P., Martin, R. E., and Harris, A. T.: Grazing systems, ecosystem responses, and global change, Annu. Rev. Env. Resour., 29, 261–299, https://doi.org/10.1146/annurev.energy.29.062403.102142, 2004.
Berdugo, M., Kéfi, S., Soliveres, S., and Maestre, F. T.: Plant spatial patterns identify alternative ecosystem multifunctionality states in global drylands, Nat. Ecol. Evol., 1, 003, https://doi.org/10.1038/s41559-016-0003, 2017.
Berdugo, M., Soliveres, S., Kéfi, S., and Maestre, F. T.: The interplay between facilitation and habitat type drives spatial vegetation patterns in global drylands, Ecography, 42, 755–767, https://doi.org/10.1111/ecog.03795, 2019.
Bisigato, A. J. and Bertiller, M. B.: Grazing effects on patchy dryland vegetation in northern Patagonia, J. Arid. Environ., 36, 639–653, https://doi.org/10.1006/jare.1996.0247, 1997.
Borer, E. T., Harpole, W. S., Adler, P. B., Lind, E. M., Orrock, J. L., Seabloom, E. W., and Smith, M. D.: Finding generality in ecology: a model for globally distributed experiments, Methods Ecol. Evol., 5, 65–73, https://doi.org/10.1111/2041-210X.12125, 2014.
Briske, D. D., Coppock, D. L., Illius, A. W., and Fuhlendorf, S. D.: Strategies for global rangeland stewardship: Assessment through the lens of the equilibrium–non-equilibrium debate, J. Appl. Ecol., 57, 1056–1067, https://doi.org/10.1111/1365-2664.13610, 2020.
Castillo-Monroy, A. P., Maestre, F. T., Delgado-Baquerizo, M., and Gallardo, A.: Biological soil crusts modulate nitrogen availability in semi-arid ecosystems: Insights from a Mediterranean grassland, Plant Soil, 333, 21–34, https://doi.org/10.1007/s11104-009-0276-7, 2010.
Cherlet, M., Hutchinson, C., Reynolds, J., Hill, J., Sommer, S., and von Maltitz, G.: World Atlas of Desertification, Publication Office of the European Union, Luxembourg, 248 pp., https://doi.org/10.2760/9205, 2018
Chillo, V., Ojeda, R. A., Anand, M., and Reynolds, J. F.: A novel approach to assess livestock management effects on biodiversity of drylands, Ecol. Indic., 50, 69–78, https://doi.org/10.1016/j.ecolind.2014.10.009, 2015.
Dacal, M., Bradford, M. A., Plaza, C., Maestre, F. T., and García-Palacios, P.: Soil microbial respiration adapts to ambient temperature in global drylands, Nat. Ecol. Evol., 3, 232–238, https://doi.org/10.1038/s41559-018-0770-5, 2019.
Delgado-Baquerizo, M., Maestre, F. T., Gallardo, A., Bowker, M. A., Wallenstein, M., Quero, J. L., Soliveres, S., Ochoa, V., Gozalo, B., García-Gómez, M., García-Palacios, P., Berdugo, M., Valencia, E., Escolar, C., Escudero, A., Carreira, J. A., Arredondo, T., Barraza-Zepeda, C., Bran, D., Chaieb, M., Conceição, A. A., Contreras, J., Derak, M., Eldridge, D. J., Espinosa, C. I., Florentino, A., Gaitán, J., Ghiloufi, W., Gómez-González, S., Gutiérrez, J.R., Hepper, E., Hernández, R. M., Huber-Sannwald, E., Jankju, M., Liu, J., Mau, R. L., Miriti, M., Monerris, J., Morici, E., Muchane, M., Naseri, K., Ospina, A., Polo, V., Pucheta, E., Quevedo-Robledo, L., Ramírez, E., Ramírez-Collantes, D. A., Romão, R., Tighe, M., Torres, D., Torres-Díaz, C., Ungar, E. D., Val, J., Wamiti, W., Wang, D., and Zaady, E.: Decoupling of soil nutrient cycles as a function of aridity in global drylands, Nature, 502, 672–676, https://doi.org/10.1038/nature12670, 2013.
Delgado-Baquerizo, M., Maestre, F. T., Escolar, C., Gallardo, A., Ochoa, V., Gozalo, B., and Prado-Comesaña, A.: Direct and indirect impacts of climate change on microbial and biocrust communities alter the resistance of the N cycle in a semiarid grassland, J. Ecol., 102, 1592–1605, https://doi.org/10.1111/1365-2745.12303, 2014.
Delgado-Baquerizo, M., Maestre, F. T., Reich, P. B., Jeffries, T. C., Gaitan, J. J., Encinar, D., Berdugo, M., Campbell, C. D., and Singh, B. K.: Microbial diversity drives multifunctionality in terrestrial ecosystems, Nat. Commun., 7, 1–8, https://doi.org/10.1038/ncomms10541, 2016.
Delgado-Baquerizo, M., Eldridge, D. J., Ochoa, V., Gozalo, B., Singh, B. K., and Maestre, F. T.: Soil microbial communities drive the resistance of ecosystem multifunctionality to global change in drylands across the globe, Ecol. Lett., 20, 1295–1305. https://doi.org/10.1111/ele.12826, 2017.
Djukic, I., Kepfer-Rojas, S., Schmidt, I. K., et al.: Early stage litter decomposition across biomes, Sci. Total Environ., 628–629, 1369–1394, https://doi.org/10.1016/j.scitotenv.2018.01.012, 2018.
Djukic, I., Guerra, C. A., Maestre, F. T., Hagedorn, F., Oggioni, A., Bergami, C., Magagna, B., Kwon, T., Shibata, H., Eisenhauer, N., Patoine, G., Bierbaumer, M., Kepfer-Rojas, S., Schmidt, I. K., Larsen, K. S., Beier, C., Berg, B., Verheyen, K., Trevathan-Tackett, S. M., Macreadie, P. I., and Initiative, T.: The TeaComposition Initiative: Unleashing the power of international collaboration to understand litter decomposition, Soil Org., 93, 73–78, https://doi.org/10.25674/so93iss1pp73, 2021.
D'Odorico, P., Bhattachan, A., Davis, K. F., Ravi, S., and Runyan, C. W.: Global desertification: Drivers and feedbacks, Adv. Water Resour., 51, 326–344, https://doi.org/10.1016/j.advwatres.2012.01.013, 2013.
Drohan, P. J., Merkler, D. J., and Buck, B. J.: Suitability of the plant root simulator probe for use in the Mojave Desert, Soil Sci. Soc. Am. J., 69, 1482–1491, https://doi.org/10.2136/sssaj2004.0377, 2005.
Durán, J., Delgado-Baquerizo, M., Rodríguez, A., Covelo, F., and Gallardo, A.: Ionic exchange membranes (IEMs): A good indicator of soil inorganic N production, Soil Biol. Biochem., 57, 964–968, https://doi.org/10.1016/j.soilbio.2012.07.016, 2013.
Eldridge, D. J., Bowker, M. A., Maestre, F. T., Roger, E., Reynolds, J. F., and Whitford, W. G.: Impacts of shrub encroachment on ecosystem structure and functioning: towards a global synthesis, Ecol. Lett., 14, 709–722, https://doi.org/10.1111/j.1461-0248.2011.01630.x, 2011.
Eldridge, D. J., Poore, A. G. B., Ruiz-Colmenero, M., Letnic, M., and Soliveres, S.: Ecosystem structure, function, and composition in rangelands are negatively affected by livestock grazing, Ecol. Appl., 26, 1273–1283, https://doi.org/10.1890/15-1234, 2016.
Feng, S. and Fu, Q.: Expansion of global drylands under a warming climate, Atmos. Chem. Phys., 13, 10081–10094, https://doi.org/10.5194/acp-13-10081-2013, 2013.
Fensham, R. J. and Fairfax, R. J.: Water-remoteness for grazing relief in Australian arid-lands, Biol. Conserv., 141, 1447–1460, https://doi.org/10.1016/j.biocon.2008.03.016, 2008.
Fensham, R. J., Fairfax, R. J., and Dwyer, J. M.: Vegetation responses to the first 20 years of cattle grazing in an Australian desert, Ecology, 91, 681–692, https://doi.org/10.1890/08-2356.1, 2010.
Frank, A. S. K., Dickman, C. R., and Wardle, G. M.: Habitat use and behaviour of cattle in a heterogeneous desert environment in central Australia, Rangel. J., 34, 319–328, https://doi.org/10.1071/RJ12032, 2012.
Fraser, L. H., Henry, H. A., Carlyle, C. N., White, S. R., Beierkuhnlein, C., Cahill, J. F., Casper, B. B., Cleland, E., Collins, S. L., Dukes, J. S., Knapp, A. K., Lind, E., Long, R., Luo, Y., Reich, P. B., Smith, M. D., Sternberg, M., and Turkington, R.: Coordinated distributed experiments: an emerging tool for testing global hypotheses in ecology and environmental science, Front. Ecol. Environ., 11, 147–155, https://doi.org/10.1890/110279, 2013.
Fraser, L. H., Pither, J., Jentsch, A., Sternberg, M., Zobel, M., Askarizadeh, D., Bartha, S., Beierkuhnlein, C., Bennett, J. A., Bittel, A., Boldgiv, B., Boldrini, I. I., Bork, E., Brown, L., Cabido, M., Cahill, J., Carlyle, C. N., Campetella, G., Chelli, S., Cohen, O., Csergo, A.-M., Díaz, S., Enrico, L., Ensing, D., Fidelis, A., Fridley, J. D., Foster, B., Garris, H., Goheen, J. R., Henry, H. A. L., Hohn, M., Jouri, M. H., Klironomos, J., Koorem, K., Lawrence-Lodge, R., Long, R., Manning, P., Mitchell, R., Moora, M., Müller, S. C., Nabinger, C., Naseri, K., Overbeck, G. E., Palmer, T. M., Parsons, S., Pesek, M., Pillar, V. D., Pringle, R. M., Roccaforte, K., Schmidt, A., Shang, Z., Stahlmann, R., Stotz, G. C., Sugiyama, S., Szentes, S., Thompson, D., Tungalag, R., Undrakhbold, S., Rooyen, M. van, Wellstein, C., Wilson, J. B., and Zupo, T.: Worldwide evidence of a unimodal relationship between productivity and plant species richness, Science, 349, 302–305, https://doi.org/10.1126/science.aab3916, 2015.
Gaitán, J. J., Bran, D., Oliva, G., Ciari, G., Nakamatsu, V., Salomone, J., Ferrante, D., Buono, G., Massara, V., Humano, G., Celdrán, D., Opazo, W., and Maestre, F. T.: Evaluating the performance of multiple remote sensing indices to predict the spatial variability of ecosystem structure and functioning in Patagonian steppes, Ecol. Indic., 34, 181–191, https://doi.org/10.1016/j.ecolind.2013.05.007, 2013.
Gaitán, J. J., Bran, D. E., Oliva, G. E., Aguiar, M. R., Buono, G. G., Ferrante, D., Nakamatsu, V., Ciari, G., Salomone, J. M., Massara, V., Martínez, G. G., and Maestre, F. T.: Aridity and overgrazing have convergent effects on ecosystem structure and functioning in Patagonian rangelands, Land Degrad. Dev., 29, 210–218, https://doi.org/10.1002/ldr.2694, 2018.
García-Palacios, P., Gross, N., Gaitán, J. J., and Maestre, F. T.: Climate mediates the biodiversity-ecosystem stability relationship globally, P. Natl. Acad. Sci. USA, 115, 8400–8405, https://doi.org/10.1073/pnas.1800425115, 2018.
García-Vega, D. and Newbold, T.: Assessing the effects of land use on biodiversity in the world's drylands and Mediterranean environments, Biodivers. Conserv., 29, 393–408, https://doi.org/10.1007/s10531-019-01888-4, 2020.
Gross, N., Soriano, M. S., Börger, L., Le Bagousse-Pinguet, Y., Quero, J. L., García-Gómez, M., Valencia-Gómez, E., and Maestre, F. T.: Uncovering multi-scale effects of aridity and biotic interactions on the functional structure of Mediterranean shrublands, J. Ecol., 101, 637–649, https://doi.org/10.1111/1365-2745.12063, 2013.
Gross, N., Bagousse-Pinguet, Y. L., Liancourt, P., Berdugo, M., Gotelli, N. J., and Maestre, F. T.: Functional trait diversity maximizes ecosystem multifunctionality, Nat. Ecol. Evol, 1, 0132, https://doi.org/10.1038/s41559-017-0132, 2017.
Hanke, W., Böhner, J., Dreber, N., Jürgens, N., Schmiedel, U., Wesuls, D., and Dengler, J.: The impact of livestock grazing on plant diversity: an analysis across dryland ecosystems and scales in southern Africa, Ecol. Appl., 24, 1188–1203, https://doi.org/10.1890/13-0377.1, 2014.
Hesse, P. R.: The identification of the spoor and dung of East African mammals. Part 1. The Antelopes, J. East Africa Nat. Hist. Soc., 22, 107–110, 1954.
Herrick, J. E., Van Zee, J. W., Havstad, K. M., Burkett, L. M., and Whitford, W. G.: Monitoring Manual for Grassland, Shrubland, and Savanna Ecosystems, Volume I: Quick Start. USDA-ARS, Las Cruces, 36 pp., ISBN 0-9755552-0-0, 2005.
Huang, J., Yu, H., Guan, X., Wang, G., and Guo, R.: Accelerated dryland expansion under climate change, Nat. Clim. Change, 6, 166–171, https://doi.org/10.1038/nclimate2837, 2016.
Jenet, A., Buono, N., Di Lello, S., Gomarasca, M., Heine, C., Mason, S., Nori, M., Saavedra, R., and Troos, K.: The path to greener pastures. Pastoralism, the backbone of the world's drylands, Vétérinaires Sans Frontières International (VSF-International), Brussels, Belgium, 139 pp., available at: http://vsf-international.org/project/pastoralism-report/ (last access: 23 December 2021), 2016.
Johnson, C. N. and Jarman, P. J.: Macropod studies at Wallaby Creek. VI: A validation of the use of dung-pellet counts for measuring absolute densities of populations of Macropodidae, Aust. Wildfire Res., 14, 139–146, https://doi.org/10.1071/WR9870139, 1987.
Keuskamp, J. A., Dingemans, B. J. J., Lehtinen, T., Sarneel, J. M., and Hefting, M. M.: Tea Bag Index: a novel approach to collect uniform decomposition data across ecosystems, Methods Ecol. Evol., 4, 1070–1075, https://doi.org/10.1111/2041-210X.12097, 2013.
Landsberg, J., Stol, J., and Muller, W.: Telling the sheep (dung) from the goats, Range. J., 16, 122–134, https://doi.org/10.1071/RJ9940122, 1994.
Lange, R. T.: The piosphere: sheep track and dung patterns, J. Range Manage., 22, 396–400, https://doi.org/10.2307/3895849, 1969.
Lauber, C. L., Zhou, N., Gordon, J. I., Knight, R., and Fierer, N.: Effect of storage conditions on the assessment of bacterial community structure in soil and human-associated samples, FEMS Microbiol. Lett., 307, 80–86, https://doi.org/10.1111/j.1574-6968.2010.01965.x, 2010.
Le Bagousse-Pinguet, Y., Gross, N., Maestre, F. T., Maire, V., de Bello, F., Fonseca, C. R., Kattge, J., Valencia, E., Leps, J., and Liancourt, P.: Testing the environmental filtering concept in global drylands, J. Ecol., 105, 1058–1069, https://doi.org/10.1111/1365-2745.12735, 2017.
Le Bagousse-Pinguet, Y., Soliveres, S., Gross, N., Torices, R., Berdugo, M., and Maestre, F. T.: Phylogenetic, functional and taxonomic richness have both positive and negative effects on ecosystem multifunctionality, P. Natl. Acad. Sci. USA, 116, 8419–8424, https://doi.org/10.1073/pnas.1815727116, 2019.
Le Bagousse-Pinguet, Y., Gross, N., Saiz, H., Maestre, F. T., Ruiz, S., Dacal, M., Asensio, S., Ochoa, V., Gozalo, B., Cornelissen, J. H. C., Deschamps, L., García, C., Maire, V., Milla, R., Salinas, N., Wang, J., Singh, B. K., and García-Palacios, P.: Functional rarity and evenness are key facets of biodiversity to boost multifunctionality, P. Natl. Acad. Sci. USA, 118, e2019355118, https://doi.org/10.1073/pnas.2019355118, 2021.
Levy, E. B. and Madden, E. A.: The point method of pasture analysis, New Zeal. J. Agr., 46, 267–279, 1933.
Lian, X., Piao, S., Chen, A., Huntingford, C., Fu, B., Li, L. Z. X., Huang, J., Sheffield, J., Berg, A. M., Keenan, T. F., McVicar, T. R., Wada, Y., Wang, X., Wang, T., Yang, Y., and Roderick, M. L.: Multifaceted characteristics of dryland aridity changes in a warming world, Nat. Rev. Earth Environ., 2, 232–250, https://doi.org/10.1038/s43017-021-00144-0, 2021.
Maestre, F. T., Quero, J. L., Gotelli, N. J., Escudero, A., Ochoa, V., Delgado-Baquerizo, M., García-Gómez, M., Bowker, M. A., Soliveres, S., Escolar, C., García-Palacios, P., Berdugo, M., Valencia, E., Gozalo, B., Gallardo, A., Aguilera, L., Arredondo, T., Blones, J., Boeken, B., Bran, D., Conceicao, A., Cabrera, O., Chaieb, M., Derak, M., Eldridge, D., Espinosa, C. I., Florentino, A., Gaitán, J., Gatica, M. G., Ghiloufi, W., Gómez-González, S., Gutiérrez, J. R., Hernández, R. M., Huang, X., Huber-Sannwald, E., Jankju, M., Miriti, M., Monerris, J., Mau, R.L., Morici, E., Naseri, K., Ospina, A., Polo, V., Prina, A., Pucheta, E., Ramírez-Collantes, D. A., Romão, R., Tighe, M., Torres-Díaz, C., Val, J., Veiga, J. P., Wang, D., and Zaady, E.: Plant species richness and ecosystem multifunctionality in global drylands, Science, 335, 214–218, https://doi.org/10.1126/science.1215442, 2012.
Maestre, F. T., Delgado-Baquerizo, M., Jeffries, T. C., Ochoa, V., Gozalo, B., Eldridge, D. J., Quero, J. L., García-Gómez, M., Gallardo, A., Ulrich, W., Bowker, M. A., Arredondo, T., Barraza, C., Bran, D., Florentino, A., Gaitán, J., Gutiérrez, J. R., Huber-Sannwald, E., Jankju, M., Mau, R. L., Miriti, M., Naseri, K., Ospina, A., Stavi, I., Wang, D., Woods, N. N., Yuan, X., Zaady, E., and Singh, B. K.: Increasing aridity reduces soil microbial diversity and abundance in global drylands, P. Natl. Acad. Sci. USA, 112, 15684–15689, https://doi.org/10.1073/pnas.1516684112, 2015.
Maestre, F. T. and Eisenhauer, N.: Ten rules for establishing global collaborative networks in ecology, Soil Org., 91, 73–85, https://doi.org/10.25674/so91iss3pp73, 2019.
Maestre, F. T., Eldridge, D. J., Soliveres, S., Kéfi, S., Delgado-Baquerizo, M., Bowker, M. A., García-Palacios, P., Gaitán, J., Gallardo, A., Lázaro, R., and Berdugo, M.: Structure and functioning of dryland ecosystems in a changing world, Annu. Rev. Ecol. Evol. Syst., 47, 215–237, https://doi.org/10.1146/annurev-ecolsys-121415-032311, 2016.
Maestre, F. T. and Guirado, E.: Coordinates of the sites surveyed in the BIODESERT survey, figshare [data set], https://doi.org/10.6084/m9.figshare.17427401, 2022.
Maestre, F. T., Le Bagousse-Pinguet, Y., Delgado-Baquerizo, M., et al.: Grazing and ecosystem service delivery in global drylands, Science, https://doi.org/10.1126/science.abq4062, 2022.
Manzano, P., Burgas, D., Cadahía, L., Eronen, J. T., Fernández-Llamazares, Á., Bencherif, S., Holand, Ø., Seitsonen, O., Byambaa, B., Fortelius, M., Fernández-Giménez, M. E., Galvin, K. A., Cabeza, M., and Stenseth, N. Chr.: Toward a holistic understanding of pastoralism, One Earth, 4, 651–665, https://doi.org/10.1016/j.oneear.2021.04.012, 2021.
Marques, F. F. C., Buckland, S. T., Goffin, D., Dixon, C. E., Borchers, D. L., Mayle, B. A., and Peace, A. J.: Estimating deer abundance from line transect surveys of dung: sika deer in southern Scotland, J. Appl. Ecol., 38, 349–363, https://doi.org/10.1046/j.1365-2664.2001.00584.x, 2001.
Mehrabi, Z., Gill, M., van Wijk, M., Herrero, M., and Ramankutty, N.: Livestock policy for sustainable development, Nat. Food, 1, 160–165, https://doi.org/10.1038/s43016-020-0042-9, 2020.
Milchunas, D. G. and Lauenroth, W. K.: Quantitative Effects of Grazing on Vegetation and Soils Over a Global Range of Environments, Ecol. Monogr., 63, 328–366, https://doi.org/10.2307/2937150, 1993.
Miyashita, T., Suzuki, M., Ando, D., Fujita, G., Ochiai, K., and Asada, M.: Forest edge creates small-scale variation in reproductive rate of sika deer, Popul. Ecol., 50, 111–120, https://doi.org/10.1007/s10144-007-0068-y, 2008.
Muir, J., Schmidt, M., Tindall, D., Trevithick, R., Scarth, P., and Stewart, J. B.: Field measurement of fractional ground cover: a technical handbook supporting ground cover monitoring for Australia, Prepared by the Queensland Department of Environment and Resource Management for the Australian Bureau of Agricultural and Resource Economics and Sciences, Canberra, 48 pp., ISBN 978-1-921192-84-5, 2011.
Neely, C., Bunning, S., and Wilkes, A.: Review of evidence on drylands pastoral systems and climate change: implications and opportunities for mitigation and adaptation, Land and Water Discussion Paper 8, Land Tenure and Management Unit (NRLA), Land and Water Division, FAO, Rome, Italy, 2009.
Oliva, G., dos Santos, E., Sofía, O., Umaña, F., Massara, V., García Martínez, G., Cecilia, C., Cariac, G., Echevarria, D., Fantozzi, A., Butti, L., Bran, D., Gaitán, J. J., Ferrante, D., Paredes, P., Domínguez, E., and Maestre, F. T.: The MARAS dataset, vegetation and soil characteristics of dryland rangelands across Patagonia, Sci. Data, 7, 327, https://doi.org/10.1038/s41597-020-00658-0, 2020.
Pérez-Harguindeguy, N., Díaz, S., Garnier, E., Lavorel, S., Poorter, H., Jaureguiberry, P., Bret-Harte, M. S., Cornwell, W. K., Craine, J. M., Gurvich, D. E., Urcelay, C., Veneklaas, E. J., Reich, P. B., Poorter, L., Wright, I. J., Ray, P., Enrico, L., Pausas, J. G., de Vos, A. C., Buchmann, N., Funes, G., Quétier, F., Hodgson, J. G., Thompson, K., Morgan, H. D., ter Steege, H., van der Heijden, M. G. A., Sack, L., Blonder, B., Poschlod, P., Vaieretti, M. V., Conti, G., Staver, A. C., Aquino, S., and Cornelissen, J. H. C.: New handbook for standardised measurement of plant functional traits worldwide, Aust. J. Bot., 61, 167–234, https://doi.org/10.1071/BT12225, 2013.
Petz, K., Alkemade, R., Bakkenes, M., Schulp, C. J. E., van der Velde, M., and Leemans, R.: Mapping and modelling trade-offs and synergies between grazing intensity and ecosystem services in rangelands using global-scale datasets and models, Global Environ. Change, 29, 223–234, https://doi.org/10.1016/j.gloenvcha.2014.08.007, 2014.
Piana, R. P. and Marsden, S. J.: Impacts of cattle grazing on forest structure and raptor distribution within a neotropical protected area, Biodivers. Conserv., 23, 559–572, https://doi.org/10.1007/s10531-013-0616-z, 2014.
Plumptre, A. J. and Harris, S.: Estimating the biomass of large mammalian herbivores in a tropical montane forest: a method of faecal counting that avoids assuming a “steady state” system, J. Appl. Ecol., 32, 111–120, https://doi.org/10.2307/2404420, 1995.
Pringle, H. J. R. and Landsberg, J.: Predicting the distribution of livestock grazing pressure in rangelands, Austral Ecol., 29, 31–39, https://doi.org/10.1111/j.1442-9993.2004.01363.x, 2004.
Qian, P. and Schoenau, J. J.: Use of Ion-Exchange Membrane to Assess Nitrogen-Supply Power of Soils, J. Plant Nutr., 28, 2193–2200, https://doi.org/10.1080/01904160500324717, 2007.
Reynolds, J. F., Maestre, F. T., Kemp, P. R., Stafford-Smith, D. M., and Lambin, E.: Natural and human dimensions of land degradation in drylands: causes and consequences, edited by: Canadell, J., Pataki, D., and Pitelka, L. F., Terrestrial Ecosystems in a Changing World, Springer-Verlag, Berlin, 247–258, ISBN 978-3-540-32729-5, 2007.
Robinson, T. P., Wint, G. R. W., Conchedda, G., Boeckel, T. P. V., Ercoli, V., Palamara, E., Cinardi, G., D'Aietti, L., Hay, S. I., and Gilbert, M.: Mapping the Global Distribution of Livestock, PLoS One, 9, e96084, https://doi.org/10.1371/journal.pone.0096084, 2014.
Saiz, H., Gómez-Gardeñes, J., Borda, J. P., and Maestre, F. T.: The structure of plant spatial association networks is linked to plant diversity in global drylands, J. Ecol., 108, 1443–1453, https://doi.org/10.1111/1365-2745.12935, 2018.
Schneider, C. A., Rasband, W. S., and Eliceiri, K. W.: NIH Image to ImageJ: 25 years of image analysis, Nat. Methods, 9, 671–675, https://doi.org/10.1038/nmeth.2089, 2012.
Soliveres, S., Maestre, F. T., Bowker, M. A., Torices, R., Quero, J. L., García-Gómez, M., Cabrera, O., Cea, A., Coaguila, D., Eldridge, D. J., Espinosa, C. I., Monerris, J. J., Tighe, M., Delgado-Baquerizo, M., Escolar, C., García-Palacios, P., Ochoa, V., Blones, J., Derak, M., Ghiloufi, W., Gutiérrez, J. R., Hernández R. M., and Noumi, Z.: Functional traits are more important than phylogeny or abiotic stress as drivers of plant-plant interactions in global drylands, Perspect. Plant Ecol., 16, 164–173, https://doi.org/10.1016/j.ppees.2014.05.001, 2014.
Soliveres, S., Maestre, F. T., Ulrich, W., Manning, P., Boch, S., Bowker, M. A., Prati, D., Delgado-Baquerizo, M., Quero, J. L., Schöning, I., Gallardo, A., Weisser, W., Müller, J., Socher, S. A., García-Gómez, M., Ochoa, V., Schulze, E. D., Fischer, M., and Allan, E.: Intransitive competition is widespread in plant communities and maintains species richness, Ecol. Lett., 18, 790–798, https://doi.org/10.1111/ele.12456, 2015.
Steinfeld, H., Gerber, P., Wassenaar, T., Castel, V., Rosales, M., and de Haan, C.: Livestock's Long Shadow: Environmental Issues and Options, Food and Agriculture Organisation of the United Nations, Rome, 391 pp., ISBN 978-92-5-105571-7, 2006.
Subler, S., Blair, J. M., and Edwards, C. A.: Using anion-exchange membranes to measure soil nitrate availability and net nitrification, Soil. Biol. Biochem., 27, 911–917, https://doi.org/10.1016/0038-0717(95)00008-3, 1995.
Throop, H. L., Archer, S. R., Monger, H. C., and Waltman, S.: When bulk density methods matter: Implications for estimating soil organic carbon pools in rocky soils, J. Arid Environ., 77, 66–71, https://doi.org/10.1016/j.jaridenv.2011.08.020, 2012.
Tongway, D. J. and Hindley, N.: Assessment of Soil Condition of Tropical Grasslands, CSIRO, Ecology and Wildlife, Canberra, ISBN 064305779X, 60 pp., 1995.
Tongway, D. J. and Hindley, N.: Landscape Function Analysis: Procedures for Monitoring and Assessing Landscapes, CSIRO Publishing, Brisbane, ISBN 097517830X, 2004.
Triggs, B.: Tracks, Scats and Other Traces: a field Guide to Australian Mammals, Oxford University Press, London, 352 pp., ISBN 0195536436, 2004.
Tuna, C., Nizam, I., and Altin, M.: Impact of watering points on vegetation changes of a semi-arid natural pasture in Tekirdag Province, Turkey, Afr. J. Agr. Res., 6, 896–900, 2011.
Val, J., Eldridge, D. J., Travers, S. K., and Oliver, I.: Livestock grazing reinforces the competitive exclusion of small-bodied birds by large aggressive birds, J. Appl. Ecol., 55, 1919–1929, https://doi.org/10.1111/1365-2664.13078, 2018.
Valencia, E., Gross, N., Börger, L., García-Gómez, M., Le Bagousse-Pinguet, Y., Quero, J. L., Tamme, R., and Maestre, F. T.: Functional diversity enhances the resistance of ecosystem multifunctionality to aridity in Mediterranean drylands, New Phytol., 206, 660–671, https://doi.org/10.1111/nph.13268, 2015.
Van Auken, O. W.: Shrub Invasions of North American Semiarid Grasslands, Annu. Rev. Ecol. Evol. Syst., 31, 197–215, https://doi.org/10.1146/annurev.ecolsys.31.1.197, 2000.
Weber, B., Büdel, B., and Belnap, J.: Biological Soil Crust: An Organizing Principle in Drylands, Ecological studies, 226, Springer, Berlin, Heidelberg, New York, 549 pp., https://doi.org/10.1007/978-3-319-30214-0, 2016.
Xu, C., Holmgren, M., Van Nes, E. H., Maestre, F. T., Soliveres, S., Berdugo, M., Kéfi, S., Marquet, P. A., Abades, S., and Scheffer, M.: Can we infer plant facilitation from remote sensing? a test across global drylands, Ecol. Appl., 25, 1456–1462, https://doi.org/10.1890/14-2358.1, 2015.
Xu, D., Li, Ch., Zhuang, D., and Pan, J.: Assessment of the relative role of climate change and human activities in desertification: A review, J. Geogr. Sci., 21, 926–936, https://doi.org/10.1007/s11442-011-0890-1, 2011.
Zhao, Y., Wang, X., Novillo, C. J., Arrogante-Funes, P., Vázquez Jiménez, R., and Maestre, F. T.: Albedo estimated from remote sensing correlates with ecosystem multifunctionality in global drylands, J. Arid Environ., 157, 116–123, https://doi.org/10.1016/j.jaridenv.2018.05.010, 2018.